Abstract
Quantum dots (QDs) have many potential clinical and biological applications because of their advantages over traditional fluorescent dyes. However, the genotoxicity potential of QDs still remains unclear. In this paper, a plasmid-based system was designed to explore the genotoxic mechanism of QDs by detecting changes in DNA configuration and biological activities. The direct chemicobiological interactions between DNA and mercaptoacetic acid-coated CdSecore QDs (MAA–QDs) were investigated. After incubation with different concentrations of MAA–QDs (0.043, 0.13, 0.4, 1.2, and 3.6 μmol/L) in the dark, the DNA conversion of the covalently closed circular (CCC) DNA to the open circular (OC) DNA was significantly enhanced (from 13.9% ± 2.2% to 59.9% ± 12.8%) while the residual transformation activity of plasmid DNA was greatly decreased (from 80.7% ± 12.8% to 13.6% ± 0.8%), which indicated that the damages to the DNA structure and biological activities induced by MAA–QDs were concentration-dependent. The electrospray ionization mass spectrometry data suggested that the observed genotoxicity might be correlated with the cadmium–mercaptoacetic acid complex (Cd–MAA) that is formed in the solution of MAA–QDs. Circular dichroism spectroscopy and transformation assay results indicated that the Cd–MAA complex might interact with DNA through the groove-binding mode and prefer binding to DNA fragments with high adenine and thymine content. Furthermore, the plasmid transformation assay could be used as an effective method to evaluate the genotoxicities of nanoparticles.
Introduction
Currently, the use of quantum dots (QDs) in biological applications has received considerable attention because of their advantages over conventional fluorescent dyes. Because of unique optical and electrical properties such as brightness, photostability, narrow emission and broad absorption,Citation1–Citation3 quantum dots have been used for labeling neoplastic cells, peroxisomes, DNA in vitro,Citation4–Citation6 and fluorescence imaging in vivo.Citation7 In addition to biomedical labeling in vitro and imaging in vivo, applications in fields such as medicine and industryCitation8,Citation9 have also been demonstrated.
As the biological applications of nanoparticles have become widely accepted, the need for understanding the potential toxicity of QDs has become an important priority. Although there have been several studies investigating the toxicity of QDs to both cell cultures and live animals because of the inherently toxic elements of the QD core (eg, cadmium, selenium) and QD coatings,Citation10–Citation12 the potential genotoxicity of QDs was masked by their cytotoxicity; therefore, little is known about the direct interactions between QDs and DNA.
The maintenance of biological activity of DNA is considered to be an essential requirement when using nanoparticles for in vitro labeling of DNA or for in vivo imaging. However, there is no quantitative method established to evaluate the biological effects of nanoparticles on DNA. The loss of biological activity of plasmid DNA, arising from exposure to QDs, should be systematically examined to obtain the complete toxicological information of QDs. Thus, in this paper, the plasmid-based transformation assay system, which is a quantitative analysis method, was established to evaluate the genetic effects of nanoparticles used in biological applications.
Furthermore, although the mechanism for the toxicity of QDs due to the effects of their single inherent chemical compositions (eg, cadmium, surface coating) has been reported,Citation10,Citation11 the coeffects of multicomponents have largely been overlooked, as QDs with surface functionalities such as the mercapto (-SH) groups, mercaptoacetic acid-QDs (MAA–QDs), and glutathione–QDs (GSH–QDs) have widely been accepted for use in biological applications.Citation13,Citation14 It has been demonstrated that the binding of Cd to sulfide, thiol groups, and sulfur-rich complex compounds could result in cadmium toxicity,Citation15 and the ability of the cadmium–metallothionein complex to cause DNA damage has been described.Citation16 However, ligand methyl mercaptoacetate, as a chelating agent, forms the CdL2 complex with cadmium chloride in water solutions at any molar ratio,Citation17 and the interaction between DNA and the CdL2 complex is currently unclear.
In the present study, the genotoxic effects and mechanism of QDs have been systematically investigated. Changes in DNA configuration and biological activities were detected by agarose gel electrophoresis and genetic transformation. Electrospray ionization-mass spectroscopy (ESI-MS) was performed to detect the Cd–MAA complex in the solution of MAA–QDs. The in vitro interaction of the Cd–MAA complex with DNA was investigated employing sensitive techniques. The ethidium bromide (EtBr) displacement was investigated using fluorescence spectroscopy to elucidate the binding mechanism of the Cd–MAA complex with DNA. Circular dichroism (CD) was employed to assess whether DNA undergoes conformational changes as a result of Cd–MAA complex formation. Here, we report a quantitative analysis method for evaluating the genotoxicity of nanoparticles and a novel genotoxic mechanism of MAA-coated CdSe QDs. Our results suggest that the Cd–MAA complex formed in the solution of MAA-coated CdSe QDs has an innate tendency to damage plasmids with a high AT content or an AT-rich region through a groove-binding mode, and therefore affect the biological activity of DNA.
Materials and methods
Chemicals
Calf-thymus DNA (CT-DNA) and ethidium bromide (EtBr) were obtained from Sigma-Aldrich (St. Louis, MO). Mercaptoacetic acid and cadmium chloride were purchased from Sinopharm Chemical Reagent Co, Ltd (Shanghai, China). The nano-TiO2 used in this work was obtained from Degussa (P25; Degussa, Essen, Germany). Fullerenes (C60, 98%) were purchased from Sigma-Aldrich (St Louis, MO). The core-shell CdSe/ZnS QDs used in this work were kindly provided by Wuhan Jiayuan Quantum Dots Co, Ltd (Wuhan, China). The QDs were coated with mercaptoacetic acid (MAA) according to the method reported by Wu et al.Citation18 The octylamine-modified polyacrylic acid-coated CdSe/ZnS QDs were prepared according to the method reported by Wu et al.Citation6 All aqueous solutions were prepared using ultrapure water.
Cloning of double-stranded DNA of varying percentages of GC base pairs
The pMD-18T cloning vector (guanine and cytosine [GC] content = 50%, TaKaRa Biotech Co, Dalian, China) was used for DNA cloning. Plasmid Tgc (GC content = 59.55%) and plasmid Tat (GC content = 41.5%) were constructed by inserting different DNA fragments into pMD-18T cloning vector. A 2688-bp fragment (corresponding to nucleotide positions from 4754 to 7442 in the Halobacterium sp. NRC-1 sequence, GC content = 69.1%) was amplified using PCR with the forward primer F-Tgc (5′-TCACCCGCTGTTACGGCACC-3′) and the reverse primer R-Tgc (5′-TCAGGGGCTACATCGGCACC-3′). A 2688-bp fragment (corresponding to nucleotide positions from 5022 to 7710 in the Saccharomyces cerevisiae sequence, GC content = 33.0%) was amplified using PCR with the forward primer F-Tat (5′-CCTTGTTCTACTGACAGGATGG-3′) and the reverse primer R-Tat (5′-TCTCGTTGGTTTGCGATTAT-3′). The products from the PCR were separated using agarose gel electrophoresis, excised, purified using an Agarose Gel DNA Extraction Kit (TaKaRa Biotech, Dalian, China) and cloned into the pMD-18T vector. After the corresponding positive clones were selected, plasmid DNA was prepared from a single clone using the kit from Tiangen (Beijing, China). The quantity and purity of the DNA were verified by measuring A260 and A280.
Detection of DNA strand breaks
The pUC18 plasmid (>70% supercoiled) was purchased from TaKaRa Biotech. DNA single-strand breaks were detected by the conversion of double-stranded covalently closed circular DNA (CCC form) to double-stranded opened circular DNA (OC form). DNA incubations were performed in 1.5 mL micro-centrifuge tubes. After the DNA incubations, the DNA samples were electrophoresed on a 1% agarose gel in 1 × TAE buffer (40 mmol/L Tris-acetate and 1 mmol/L EDTA at pH = 8.0) at 140 V for 40 min. After staining with ethidium bromide, the gel was photographed using a Syngene camera under an ultraviolet illuminator. Each experiment was repeated at least three times. Scanning densitometry results from a single representative gel picture are shown in this study.
Effects of different concentrations of MAA–QDs on plasmid DNA
In a 200 μL reaction mixture (ultrapure water), 833 ng plasmid pUC18 DNA was incubated with QDs (final concentration, 3.6 μmol/L, 1.2 μmol/L, 0.4 μmol/L, 0.13 μmol/L, 0.043 μmol/L) at 4°C for 2 hours in the dark.
Exposure of DNA to different nanoparticles
Plasmid pUC18 DNA, at a concentration of 15 ng/μL, was incubated with nano-TiO2, fullerenes, MAA–QDs, and octylamine-modified polyacrylic acid-coated CdSe/ZnS QDs (OPA-QDs) at final concentrations of 1.5 mg/mL, 1.5 mg/mL, 3.6 μmol/L, 3 μmol/L, respectively, for 2 hours at 4°C in the dark, producing a final volume of 20 μL.
Exposure of DNA to Cd ions, MAA, or both
Damages to DNA caused by Cd ions, MAA or a mixture of Cd ions and MAA were assessed as follows.
MAA: pUC18 DNA, at a concentration of 15 ng/μL, was incubated with increasing concentrations of MAA (final concentration, 0.05, 0.5, 5, 50 mmol/L) at 4°C for 12 hours in the dark, for a final volume of 20 μL.
Cd ions: pUC18 DNA, at a concentration of 15 ng/μL, was incubated with increasing concentrations of Cd ions (final concentration, 0.5, 5, 50, 500 μmol/L), at 4°C for 12 hours in the dark, for a final volume of 20 μL.
Cd and MAA: pUC18 DNA, at a concentration of 15 ng/μL, was incubated with Cd ions (final concentration, 500 μmol/L) and increasing concentrations of MAA (final concentration, 0, 5, 10, 15, 25, 35, 45 mmol/L) at 4°C for 12 hours in the dark, for a final volume of 20 μL.
Genetic transformation
The biological activities of the plasmids were determined from the transformation tests. A variation of the procedure of Cohen was implemented for transformationCitation19. Escherichia coli strain DH5α was cultured with shaking at 37°C overnight in Luria–Bertani (LB) medium. Competent cells were prepared by inoculating 1 mL overnight culture in 100 mL LB medium and then grown with shaking at 37°C to reach a density of 1 × 10⁹ colony-forming units per mL (CFU/mL). The cells were then quickly chilled, centrifuged and washed in 20 mL CaCl2 (100 mmol/L), kept cold at 0°C for 1 hour, then centrifuged and washed in 5 mL CaCl2 and further chilled for 30 minutes. Competent cells were dispensed into chilled micro-centrifuge tubes after simply inverting and gently shaking. We added 4.17 ng (1 μL) of the DNA sample incubated with nanoparticles to 100 μL of CaCl2-treated E. coli DH5α competent cells, and an additional incubation was performed for 30 minutes at 0°C. The cells were then subjected to a heat pulse at 42°C for 90 seconds, kept at 0°C for 2 minutes and then plated directly onto a solid LB medium containing 100 μg/mL of ampicillin.Citation19 The transformants were counted after 12 to 16 hours of incubation at 37°C.
For all transformation experiments, transformation efficiency was calculated as CFU per μg plasmid DNA. We regarded the transformation efficiency of untreated plasmid DNA as 100%, and then calculated the residual transformation activity of the incubated plasmid DNA by comparing the transformation efficiency to that of untreated control. The biological effect of nanoparticles on DNA should be confirmed in repeated experiments (n > 3). All quantitative data are expressed as the mean ± standard deviation. The values of the residual transformablities are the averages from three replicate transformation experiments for each sample, and the error bars represent the standard deviations. All data were statistically analyzed. P values less than 0.05 were considered to indicate statistical significance.
In the process of testing, the untreated DNA control must be prepared using the same conditions as the incubated sample. As the final amount of 4.17 ng (1 μL) nanoparticles-treated plasmid DNA sample was used to transform 100 μL of CaCl2-treated competent E. coli strain DH5α, the transformation frequency and viability of the competent E. coli strain DH5α treated with 100-fold diluted nanoparticles should also be monitored to make sure that there was no apparent difference between the nanoparticles-treated and non-treated competent E. coli strain DH5α. Additionally, the influence of nanoparticles on the competent E. coli strain DH5α could be avoided by using DNA purification kits.
Preparation of Cd complexes and ESI-MS measurements
A mixture of 50 mmol/L of the mercaptoacetic acid ligand and 50 mmol/L of cadmium chloride in water was stirred for 30 minutes. Both the solid residue and the supernatant were separated by centrifuging. The Cd complex solution was obtained by washing the solid residue three times with cool water followed by dissolution in water, and finally filtered off. After processing to remove the intact nanoparticles by centrifuging, the remaining solutions of the QDs samples were also tested for Cd complex by ESI-MS. Data were measured using a LCQ-Advantage MS spectrometer (Thermo Finnigan Inc, New York, NY) in positive ion mode. The flow rate was 0.8 mL minute−1. Injections were carried out at a spray voltage of 4.5 kV, a capillary voltage of 4.0 V, and a capillary temperature of 200°C.
MAA-Cd-DNA binding analysis by fluorescence spectroscopy
The ethidium bromide (EtBr) fluorescence quenching experiments were carried out by adding 0 to 1 mmol/L Cd–MAA complex into the EtBr bound CT-DNA (0.05 mmol/L) solution in ddH2O (pH 7.0). The mixtures were incubated at room temperature for 30 minutes in the dark. The fluorescence spectra of EB bound to DNA were obtained at an emission wavelength of 605 nm in the fluorometer.
Circular dichroism measurements
All CD spectroscopic studies were carried out with a continuous flow of nitrogen purging the polarimeter using a Jasco J-810 automatic recording spectropolarimeter (Jasco, Tokyo, Japan). The measurements were performed at room temperature, using cells with a 1 cm pathway. The CD spectra of each sample solution were scanned over the range of 320–220 nm, and the buffer background was automatically subtracted. Data were recorded at an interval of 2 nm. The CD spectrum of pUC18 DNA alone (0.2 mmol/L) was recorded as the control experiment.
Results and discussion
Effect of MAA-coated CdSe QDs on the configuration of plasmid DNA
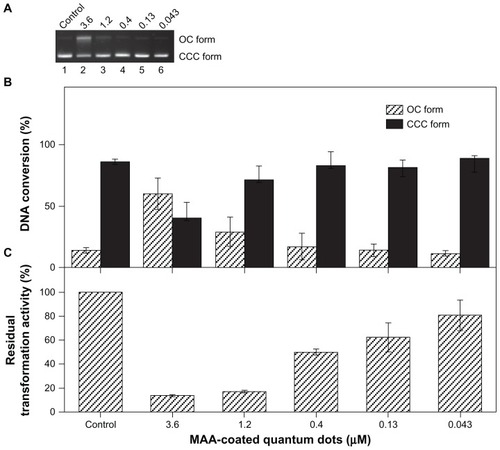
The damage caused by the MAA-coated CdSe QDs to the configuration of DNA was detected using agarose gel electrophoresis. The incubated plasmid DNA exhibited two bands on the agarose gel. The faster moving band corresponds to the CCC form, and the slower band corresponds to the OC form. Although DNA nicking could hardly be detected when the plasmid was incubated with low concentrations (0.4 μmol/L, 0.13 μmol/L, 0.043μmol/L) of MAA–QDs (lanes 4–6, ), it was evident that the exposure of 833 ng of pUC18 DNA to high concentrations of QDs (3.6 μmol/L, 1.2 μmol/L) at 4°C for 2 hours in the dark resulted in DNA nicking (lanes 2–3, ). The percentage of the OC form of plasmid DNA reached approximately 59.9% ± 12.8% at a concentration of 3.6 μmol/L QDs (), which indicated that the MAA-coated CdSe QDs are a potent DNA cleavage agent.
Figure 1 Effects of MAA-coated CdSe QDs on the plasmid DNA. (A) Electrophoresis in 1% agarose gel of pUC18 DNA (150 ng per sample) incubated for 2 hours at 4°C in the dark with QDs. Lane 1: pUC18 DNA only; lanes 2–6: pUC18 DNA incubated with different concentrations of QDs (3.6, 1.2, 0.4, 0.13, 0.043 μmol/L). (B) DNA quality of plasmids pUC18 incubated with different concentrations of QDs (3.6, 1.2, 0.4, 0.13, 0.043 μmol/L) for 2 hours at 4°C in the dark was tested by transformation with Escherichia coli strain DH5α. (C) Scanning densitometry results of three replicate experiments for each sample, with the error bars representing the standard deviations.
Abbreviations: OC, opened circular; CCC, covalently closed circular; MAA, mercaptoacetic acid; QDs, quantum dots.
Effect of QDs on the biological potential of plasmid DNA
The biological activity of DNA may be lost due to the DNA lesions,Citation20 and the biological effects on DNA molecules could be reflected sufficiently by the reduction in the transformation capacity of the plasmid DNA.Citation21 Thus, the DNA quality of plasmids pUC18 incubated with nanoparticles could be tested by transformation with E. coli strain DH5α, and the residual transformation activity used as a parameter to evaluate the biological damage to plasmid DNA that was incubated with MAA–QDs (3.6~0.043 μmol/L). After incubation with different concentrations of MAA–QDs (3.6 μmol/L, 1.2 μmol/L, 0.4 μmol/L, 0.13 μmol/L, 0.043 μmol/L) at 4°C for 2 hours in the dark, a dose-dependent decrease in the residual transformation activity of plasmid DNA was observed (from 80.7% ± 12.8% to 13.6% ± 0.8%, ). As shown in , significant damage to the DNA was observed when the DNA was treated with 3.6 μmol/L (P < 0.001), 1.2 μmol/L (P < 0.001), 0.4 μmol/L(P < 0.01), and 0.13 μmol/L (P < 0.05) of QDs. The damage to the DNA was not statistically significant when treated with QDs at the concentration of 0.043 μmol/L. In contrast to previous data on the potency of QDs to damage DNA (), the statistical analysis of the residual transformation activity () could show better accuracy for the evaluation of the genetic toxicity of nanoparticles.
Furthermore, biological effects of nano-TiO2, fullerenes, and octylamine-modified polyacrylic acid-coated CdSe/ZnS QDs (OPA-QDs) were also investigated using the transformation assay. DNA qualities of plasmids pUC18 incubated with nano-TiO2 (1.5 mg/mL), fullerenes (1.5 mg/mL) and OPA-QDs (3 μmol/L) for 2 hours at 4°C in the dark were tested by transformation with E. coli strain DH5α. The results demonstrated that there is no significant difference between the incubated and non-incubated plasmids in transformation activity (P > 0.05, ). Hence, in the present study, despite the different mechanisms of DNA damage that are caused by nanoparticles, a quantitative analysis method was well established and the effects of damage from most nanoparticles on DNA could be evaluated in the plasmid-based noncellular system.
Figure 2 Effects of different nanoparticles on the transformablities of plasmid DNA.
Notes: DNA qualities of plasmids pUC18 incubated with nano-TiO2 (1.5 mg/mL), fullerenes (1.5 mg/mL), MAA–QDs (3.6 μmol/L) and OPA-QDs (3 μmol/L) for 2 hours at 4°C in the dark were tested by transformation with Escherichia coli strain DH5α. There is no significant difference between the incubated and non-incubated plasmids in transformation activity when plasmids were incubated with nano-TiO2, fullerenes, and OPA-QDs (P > 0.05), respectively.
Abbreviations: MAA-QDs, mercaptoacetic acid-coated quantum dots; OPA-QDs, octylamine-modified polyacrylic acid-coated quantum dots.

Primary toxin in the solution of MAA-coated CdSe QDs
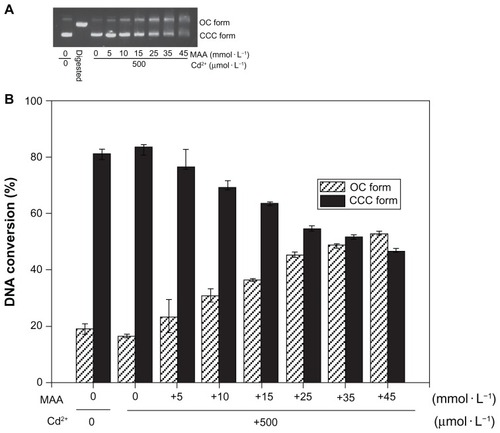
In previous work, high levels of free cadmium (1.1 mmol/L) could be found in 0.25 mg/mL solutions of QDs because of the degradation of the QDs.Citation10 DNA strand breaks, arising from the photogenerated free radicals or the generated surface oxide,Citation22,Citation23 have been reported; however, the direct interaction between DNA and the chemical composition of QDs currently remains unclear. To determine whether cadmium or MAA is capable of inducing damage to DNA, the effects of MAA, Cd2+ and the combination of both on DNA nicking were studied. Because incubations of plasmid DNA with 0.5, 5, 50, 500 μmol/L CdCl2 (lanes 3–6, ) at 4°C for 12 hours in the dark did not cause DNA nicking, it is evident that the DNA nicking caused by QDs in the dark was not due to cadmium. Additionally, when the DNA was incubated with increasing concentrations of MAA, the gel electrophoresis bands became smeared without the expected DNA nicking (lanes 8–10, ). However, a dose-dependent increase in DNA nicking was observed when 300 ng of the pUC18 plasmid DNA was incubated with mixtures of Cd2+ (0.5 mmol/L) and MAA (0, 5, 10, 15, 25, 35 mmol/L) at 4°C for 12 hours in the dark (lanes 3–8, ).
Figure 3 Effect of Cd2+ or MAA on the configuration of plasmid DNA.
Notes: Electrophoresis in 1% agarose gel of pUC18 DNA (150 ng per sample) incubated for 12 hours at 4°C in the dark with increasing concentrations of Cd2+ or with increasing concentrations of MAA. Lane 1: pUC18 DNA only; lane 2: pUC18 DNA digested by Hind III; lanes 3–6: pUC18 DNA incubated with 0.5, 5, 50, 500 μmol/L Cd ions; lanes 7–10: pUC18 DNA incubated with 0.05, 0.5, 5, 50 mmol/L MAA. DNA smear caused by MAA was observed in lanes 8–10, and the pUC18 plasmid DNA in lane 10 was completely degraded by MAA.
Abbreviations: OC, opened circular; CCC, covalently closed circular; MAA, mercaptoacetic acid.
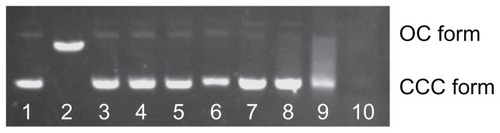
Figure 4 Co-effect of Cd2+ and MAA on the configuration of plasmid DNA. (A) Electrophoresis in 1% agarose gel of pUC18 DNA (150 ng per sample) incubated with Cd2+ in the presence of increasing MAA concentrations for 12 hours at 4°C in the dark. Lane 1: pUC18 DNA only; lane 2: pUC18 DNA digested by Hind III; lanes 3–9: pUC18 DNA incubated with mixtures of Cd2+ (500 μmol/L) and 0, 5, 10, 15, 25, 35, 45 mmol/L MAA. (B) Scanning densitometry results of three replicate experiments for each sample, with the error bars representing the standard deviations.
Abbreviations: OC, opened circular; CCC, covalently closed circular; MAA, mercaptoacetic acid.
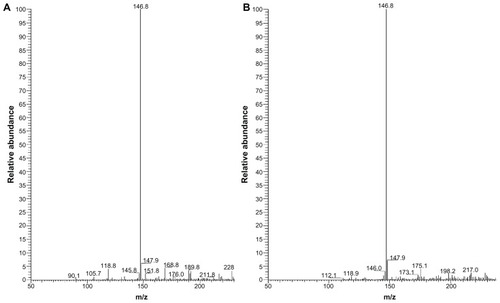
Electrospray ionization mass spectrometry (ESI-MS) was performed to find the primary toxin in the mixture of Cd2+ and MAA. As a chelating agent, the ligand mercaptoacetic acid forms a CdL2 complex with cadmium chloride () in the mixture of Cd and MAA. The Cd complex with mercaptoacetic acid could also be formed in the solution of MAA-coated CdSe QDs (). When incubated with pUC18 DNA, the Cd–MAA complex had a nicking effect on the plasmid DNA (data not shown). Furthermore, the configurational damage to plasmid pUC18 that was treated with non-sulfur compound coated QDs (OPA-QDs) was monitored, and no detectable DNA nicking was observed (data not shown). The biological damage to plasmid pUC18 treated with OPA-QDs was also monitored. The data indicated that the DNA was only slightly damaged when incubated with non-sulfur compound coated QDs (P > 0.05, ). Thus, in the case of MAA-coated CdSe QDs, we suggest that the DNA damage caused by MAA–QDs is a co-effect of the MAA and cadmium and that the Cd(SCH2COOH)2 complexes may be related to the DNA nicking. To the best of our understanding, the formation of the Cd–MAA complex in the solution of QDs and its effect on the secondary structure of DNA have not been comprehensively pursued in a systematic manner.
Figure 5 ESI mass spectra of Cd(SCH2COOH)2 complex. Each peak represents an ion having a specific mass-to-charge ratio (m/z), and the height of the peak indicates the relative abundance. The base peak in the mass spectrum, corresponding to the ion which has the greatest intensity, is set to 100% relative abundance. (A) The base peak at m/z 146.8 suggests the greatest intensity of Cd(SCH2COOH)2 in the mixture of Cd and MAA. (B) The base peak at m/z 146.8 suggests the greatest intensity of Cd(SCH2COOH)2 in the solution of MAA-coated CdSe QDs. Cd(SCH2COOH)2 appears to be the primary toxin as no other ions were present above 10% relative abundance in either of the solutions.
Abbreviations: ESI mass, electrospray ionization mass; MAA, mercaptoacetic acid.
Interaction between DNA and the cadmium-MAA complex
To gain a deeper insight into the DNA damage induced by the MAA–QDs, the direct interactions between DNA and the cadmium–MAA complex were investigated. DNA binding is the critical step for DNA damage in most cases. Therefore, fluorescence, circular dichroism spectroscopy and transformation assays were performed to investigate the binding of the ligand, MAA, and its complex, Cd–MAA, to DNA.
Fluorescence spectroscopy
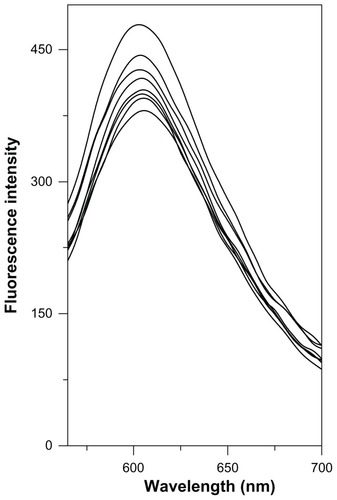
Ethidium bromide (EtBr) fluorescence displacement experiments were employed to further investigate the interaction mode between the cadmium complex and DNA. The assay was based on the theory that a highly fluorescent complex could be formed between native DNA and the intercalating agent, EtBr. Using CT-DNA as a model, the damage to DNA caused by the cadmium complex was explored using the fluorescence method. The binding of the cadmium complex to CT-DNA was studied by evaluating the fluorescence emission intensity of the EtBr–DNA system following addition of the compound. In our experiment, as illustrated in , the fluorescence intensity at 605 nm of EtBr bound to DNA showed no significant decreasing trend with increasing concentrations of the cadmium complex, which is suggestive of a nonintercalative mode of DNA binding. By considering the fluorescence intensity value of EtBr-DNA complexes as equal to 100%, the extent of fluorescence quenching with the Cd–MAA complex has been determined to be equal to 20.21% at the highest molar ratio of 1:20. Furthermore, similar fluorescence quenching effects of EtBr bound to DNA have been observed for the addition of several groove-binding compounds, including distamycin A, methyl thiophanate, and amsacrine.Citation24–Citation26 This observation leads us to suggest that the cadmium complex may interact with DNA through the groove-binding mode.Citation27
Figure 6 Competitive displacement of intercalating dye EtBr from EtBr-CT-DNA complex by the Cd–MAA complex.
Notes: Curves from top to bottom: EtBr (10 μmol/L) +CT-DNA (50 μmol/L); EtBr (10 μmol/L) +CT-DNA (50 μmol/L) +cadmium complex (10, 20, 30, 40, 50, 100, 1000 μmol/L). Fluorescence was monitored at 605 nm using an excitation wavelength of 518 nm.
Abbreviations: EtBr, ethidium bromide; CT-DNA, Calf-thymus DNA; Cd-MAA, cadmium-mercaptoacetic acid.
Circular dichroism studies
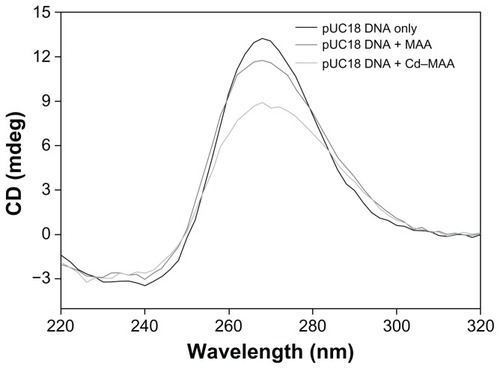
Circular dichroism is a powerful technique to assess whether nucleic acids undergo conformational changes during drug–DNA interactions, as the bands arising from base stacking (275 nm) and from right-handed helicity (248 nm) are quite sensitive to the mode of DNA interactions with small molecules.Citation28,Citation29 In the CD spectra of pUC18 DNA that was treated with MAA and Cd–MAA (compound:DNA = 0.4:1) (), the positive (275 nm) band decreased in intensity with the addition of the compound, while the negative (245 nm) band exhibited no significant change. This suggests that MAA and Cd–MAA can unwind the DNA helix and lead to the loss of helicity.Citation30,Citation31 The larger decrease in the CD band intensity, caused by Cd–MAA compared to MAA at the same concentration, implies that Cd–MAA is more effective than MAA in perturbing the secondary structure of DNA.
Figure 7 CD spectra of pUC18 DNA.
Notes: The interactions of pUC18 DNA with MAA and Cd–MAA were at a ratio of compound:DNA = 0.4. All the spectra were recorded in Tris-HCl buffer, pH 7.0.
Abbreviations: CD, circular dichroism; MAA, mercaptoacetic acid; Cd-MAA, cadmium-mercaptoacetic acid.
High GC content DNA shows resistance to Cd–MAA complex
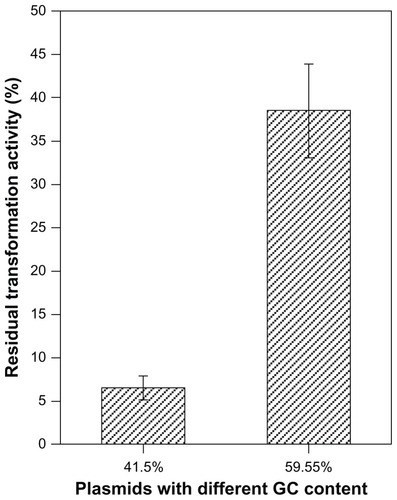
Groove-binding compounds, such as the Cu–methyl thiophanate complex and amsacrine, prefer binding to the AT-rich region or to poly(dA-dT).Citation24,Citation26,Citation32 Therefore, DNA containing higher contents of AT could receive more damage from the groove-binding compounds. To examine whether the Cd–MAA complex is a groove-binding compound, experiments evaluating the biological damage to plasmids with different GC percentage (41.5%, 59.55%) were performed. After incubation with the same concentration of MAA–QDs (3.6 μmol/L) at 4°C for 12 hours in the dark, a significantly higher residual transformation activity of the high GC% plasmid was observed compared to the low GC% one (P < 0.001, ), indicating that the Cd–MAA complex is a groove-binding compound and has an innate tendency to damage plasmids with high content of AT.
Figure 8 Effects of QDs on the plasmids with different GC contents.
Notes: Plasmids with the same size and dose but contained different GC contents (41.5%, 59.55%) and were incubated with MAA-coated CdSe QDs (3 μmol/L) for 2 hours at 4°C in the dark. P < 0.001.
Abbreviations: QDs, quantum dots; GC content, guanine + cytosine content.
In conclusion, dose-dependent DNA damage caused by MAA-coated CdSe-core QDs at 4°C in the dark has been shown in this paper. We attribute the effects of DNA damage to a coeffect due to the chemical components in the QDs solution, which could be linked to the instability of QDs. A novel mechanism, which may be generally applicable or only apply to this system, was demonstrated in this paper and shows that the Cd–MAA complex may contribute to the DNA nicking and the decrease of biological activity of DNA. The Cd–MAA complex in the solution of MAA–QDs may interact with DNA through the groove-binding mode, and furthermore, the Cd–MAA complex has an innate tendency to damage plasmids with a high AT content or an AT-rich region. Although the damage mechanism remains unclear, considering the loose base-pairing of thymine and adenine, it was understandable that the Cd–MAA complex can bind with AT-rich region and then induce DNA damage with facility. Furthermore, these findings serve to suggest parameters to minimize the genotoxicity of QDs in biological applications: storing QDs uncoated, replacing the sulfur compound coating, and using QDs with sulfur compound coating immediately after coated if absolutely necessary.
The evaluation of biosafety is considered to be an essential requirement in the biological applications of nanoparticles. However, the scarcity of quantitative analysis methods has become an obstacle to gaining more information about the basic concerns of DNA damage induced by nanoparticles. Therefore, the plasmid transformation assay, which is a functional test, was performed to evaluate the genotoxic damage caused by nanoparticles.
Acknowledgments
This work was supported by the National Natural Science Foundation of China (20677044, 30971573), the Science Fund for Creative Research Groups of NSFC (20621502, 20921062), National High-tech R&D Program of China (863 Program) (2007 AA06Z407), the Fundamental Research Funds for the Central Universities (3081001), and the National Fund for Fostering Talents of Basic Science (J1103513). We would also like to thank Dr. Yong Li (Wuhan University), Dr. Yan Zhang (Wuhan University) and Dr. Jingwei Gao (Wuhan University) for technical assistance and helpful discussion.
Disclosure
The authors report no conflicts of interest in this work.
References
- BruchezMJrMoronneMGinPWeissSAlivisatosAPSemiconductor nanocrystals as fluorescent biological labelsScience19982815385201320169748157
- ChanWCNieSQuantum dot bioconjugates for ultrasensitive nonisotopic detectionScience19982815385201620189748158
- ChanWCMaxwellDJGaoXBaileyREHanMNieSLuminescent quantum dots for multiplexed biological detection and imagingCurr Opin Biotechnol2002131404611849956
- DubertretBSkouridesPNorrisDJNoireauxVBrivanlouAHLibchaberAIn vivo imaging of quantum dots encapsulated in phospholipid micellesScience200229855991759176212459582
- GaoXCuiYLevensonRMChungLWNieSIn vivo cancer targeting and imaging with semiconductor quantum dotsNat Biotechnol200422896997615258594
- WuXLiuHLiuJImmunofluorescent labeling of cancer marker Her2 and other cellular targets with semiconductor quantum dotsNat Biotechnol2003211414612459735
- AryaHKaulZWadhwaRTairaKHiranoTKaulSCQuantum dots in bio-imaging: Revolution by the smallBiochem Biophys Res Commun200532941173117715766550
- RudgeSRKurtzTLVesselyCRCatterallLGWilliamsonDLPreparation, characterization, and performance of magnetic iron-carbon composite microparticles for chemotherapyBiomaterials200021141411142010872770
- WuYLiXSteelDGammonDShamLJCoherent optical control of semiconductor quantum dots for quantum information processingPhysica E Low Dimens Syst Nanostruct2004252–3242248
- DerfusAMChanWCWBhatiaSNProbing the cytotoxicity of semiconductor quantum dotsNano Lett2004411118
- HoshinoAFujiokaKOkuTPhysicochemical properties and cellular toxicity of nanocrystal quantum dots depend on their surface modificationNano Lett200441121632169
- YuWWChangEDrezekRColvinVLWater-soluble quantum dots for biomedical applicationsBiochem Biophys Res Commun2006348378178616904647
- AldanaJWangYAPengXPhotochemical instability of CdSe nanocrystals coated by hydrophilic thiolsJ Am Chem Soc2001123368844885011535092
- ZhengYGaoSYingJSynthesis and cell-imaging applications of glutathione- capped CdTe quantum dotsAdv Mater2007193376380
- HelbigKGrosseCNiesDHCadmium toxicity in glutathione mutants ofEscherichia coliJ Bacteriol2008190155439545418539742
- MüllerTSchuckeltRJaenickeLCadmium/zinc-metallothionein induces DNA strand breaks in vitroArch Toxicol199165120261645950
- CrisponiGDiazANurchiVMPivettaTTapia EstevezMJEquilibrium study on Cd(II) and Zn(II) chelates of mercapto carboxylic acidsPolyhedron20022114–1513191327
- WuSMZhaoXZhangZLQuantum-dot-labeled DNA probes for fluorescence in situ hybridization (FISH) in the microorganismEscherichia coliChemphyschem2006751062106716625674
- CohenSNChangACHsuLNonchromosomal antibiotic resistance in bacteria: genetic transformation of Escherichia coli by R-factor DNAProc Natl Acad Sci U S A1972698211021144559594
- OtoshiEYagiTMoriTRespective roles of cyclobutane pyrimidine dimers, 6–4 photoproducts, and minor photoproducts in ultraviolet mutagenesis of repair-deficient xeroderma pigmentosum A cellsCancer Res20006061729173510749146
- RomanowskiGLorenzMGWackernagelWUse of polymerase chain reaction and electroporation of Escherichia coli to monitor the persistence of extracellular plasmid DNA introduced into natural soilsAppl Environ Microbiol19935910343834468250566
- AnasAAkitaHHarashimaHItohTIshikawaMBijuVPhotosensitized breakage and damage of DNA by CdSe-ZnS quantum dotsJ Phys Chem B200811232100051001118582008
- GreenMHowmanESemiconductor quantum dots and free radical induced DNA nickingChem Commun (Camb)2005112112315614393
- BaguleyBCLe BretMQuenching of DNA-ethidium fluorescence by amsacrine and other antitumor agents: a possible electron-transfer effectBiochemistry19842359379436546881
- NelsonSMFergusonLRDennyWANon-covalent ligand/DNA interactions: minor groove binding agentsMutat Res20076231–2244017507044
- SaquibQAl-KhedhairyAAAlarifiSADuttaSDasguptaSMusarratJMethyl thiophanate as a DNA minor groove binder produces MT-Cu(II)-DNA ternary complex preferably with AT rich region for initiation of DNA damageInt J Biol Macromol2010471687520371372
- BogerDLFinkBEBrunetteSRTseWCHedrickMPA simple, high-resolution method for establishing DNA binding affinity and sequence selectivityJ Am Chem Soc2001123255878589111414820
- LakowiczJRWeberGQuenching of fluorescence by oxygen. Probe for structural fluctuations in macromoleculesBiochemistry19731221416141704795686
- UmaMPPalaniandavarMDNA binding and cleavage properties of certain tetrammine ruthenium(II) complexes of modified 1,10-phenanthrolines – effect of hydrogen-bonding on DNA-binding affinityJ Inorg Biochem200498221923014729302
- PasternackRFCircular dichroism and the interactions of water soluble porphyrins with DNAChirality200315432933212666240
- DalgleishDGFeilMCPeacockeARThe circular dichroism of complexes of 2,7-Di-tertiary-butyl proflavine with DNABiopolymers19721112241524224675327
- Bourdouxhe-HousiauxCColsonPHoussierCWaringMJBaillyCInteraction of a DNA-threading netropsin-amsacrine combilexin with DNA and chromatin?Biochemistry19963514425142648605173