 ?Mathematical formulae have been encoded as MathML and are displayed in this HTML version using MathJax in order to improve their display. Uncheck the box to turn MathJax off. This feature requires Javascript. Click on a formula to zoom.
Abstract
Sample preparation is a significant challenge for detection and sensing technologies, since the presence of blood cells can interfere with the accuracy and reliability of virus detection at the nanoscale for point-of-care testing. To the best of our knowledge, there is not an existing on-chip virus isolation technology that does not use complex fluidic pumps. Here, we presented a lab-on-a-chip filter device to isolate plasma and viruses from unprocessed whole blood based on size exclusion without using a micropump. We demonstrated that viruses (eg, HIV) can be separated on a filter-based chip (2-μm pore size) from HIV-spiked whole blood at high recovery efficiencies of 89.9% ± 5.0%, 80.5% ± 4.3%, and 78.2% ± 3.8%, for viral loads of 1000, 10,000 and 100,000 copies/mL, respectively. Meanwhile, 81.7% ± 6.7% of red blood cells and 89.5% ± 2.4% of white blood cells were retained on 2 μm pore–sized filter microchips. We also tested these filter microchips with seven HIV-infected patient samples and observed recovery efficiencies ranging from 73.1% ± 8.3% to 82.5% ± 4.1%. These results are first steps towards developing disposable point-of-care diagnostics and monitoring devices for resource-constrained settings, as well as hospital and primary care settings.
Introduction
Pandemic diseases including HIV, malaria, and TB, as well as emerging infectious diseases such as influenza H1N1 have raised serious challenges for global health and homeland security. For instance, HIV has caused more than 25 million deaths since the first reported case of AIDS in 1981, and currently there are approximately 33.3 million people living with HIV.Citation1 Emerging endemics present grand threats to the public health. For example, H1N1 rapidly spread worldwide and caused a global pandemic in 2009,Citation2,Citation3 and a similar strain led to over 50 million deaths in 1918.Citation3 To prevent and control these highly contagious infectious diseases, there is a need for implementing rapid and simple diagnostic technologies to detect early cases in the field. As such, microfluidic systems, due to their portability, affordability, and high sensitivity, have become promising technologies to develop point-of-care (POC) diagnostics.Citation4–Citation7
Currently, POC diagnostics require on-chip sample processing, including plasma separation from whole blood as an initial step.Citation8,Citation9 For example, inclusion of blood cells or components such as hemoglobin and lactoferrin may inhibit DNA polymerase in polymerase chain reaction (PCR) analysis and lead to inaccurate quantification or even amplification failure.Citation10 Similarly, inhibitors from whole blood can interfere with enzyme-linked immunosorbent assay (ELISA) and result in low sensitivity and specificity.Citation11,Citation12 In addition, reducing the concentration of cellular components of blood, and separating viruses in plasma using a rapid system may increase the capture efficiency microfluidic-based viral detection platforms.Citation13,Citation14 This is particularly important for optical sensors, since the presence of blood cells in the sample can negatively affect the optical detection path and compromise accuracy. Detection technologies such as whispering gallery– mode devices,Citation15 plasmon resonance devices,Citation16 and photonic crystals,Citation17 can benefit from the preremoval of nontargeted cells from whole blood to enhance the capture efficiency of targeted pathogens and proteins. In a clinical laboratory setting, plasma separation can simply be performed by centrifugation, whereas it remains a challenge at the POC, especially in resource-constrained settings due to lack of laboratory infrastructure.Citation18–Citation20 Hence, simple, inexpensive, and rapid plasma separation on-chip is urgently needed to facilitate POC diagnosis.
There have been microfluidic approaches to achieve on-chip plasma separation via driving forces such as centrifugal force,Citation21,Citation22 capillary force,Citation23 and the Zweifach–Fung effect.Citation24 However, these approaches have inherent shortcomings that render them not suitable for POC testing. For example, centrifugation-based compact-disk chips require electricity for high-speed rotation.Citation21,Citation22 Although capillary forces can be utilized to extract plasma to remove the need for electricity, small volumes of plasma can be extracted (a few nanoliters to microliters),Citation25 which may be insufficient for conventional detection methods such as PCR or ELISA. To improve the yield, a continuous cross-flow device was designed to separate blood cells in microchannels at high flow rates.Citation24 Despite enhanced plasma yields, this device requires accurate flow rates and a long fractionation time, which may not be ideal to achieve rapid detection of infectious agents at resource-constrained settings. Recently, plasma separation on-chip can also be achieved using a H2O2-powered pumpCitation26 or degas-driven flow in evacuated polydimethylsiloxane devices.Citation25 However, the demanding storage conditions for H2O2 or vacuum limits the shelf life of these devices. Thus there is an unmet need to develop simple, robust sample-processing devices that can achieve rapid plasma separation to facilitate POC testing.Citation27
Microfilters with pore sizes ranging from 5 to 30 μm have been used to isolate plasma from whole blood;Citation28 however, these approaches focus on cells. In contrast, we demonstrated isolation of viruses using small pore sizes (1–2 μm), which has not yet been reported. We separated viruses, which were 110–146 nm in size,Citation29 from whole blood using a microchip with 1–2 μm diameter porous filter membranes, which can be used as a preliminary on-chip step to detect viruses from whole blood by immunocapture.Citation13,Citation14 We used HIV as a relevant virus model, and validated this microchip using hematological analysis and reverse transcription quantitative PCR (RT-qPCR). The presented work is the first demonstration of a simple, rapid, pump-free, antibody-free pathogen isolation device, which can reliably recover infectious agents using size-based separation from unprocessed whole blood. The presented microchip has broad potential applications; for instance, it can be coupled with existing battery-operated diagnostic tools, or integrated with microchip ELISA or PCR as a sample preparation module for POC testing.
Materials and methods
Device fabrication
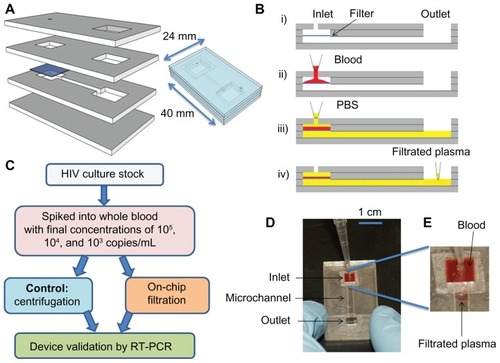
The device consisted of four layers of poly(methyl methacrylate) (PMMA) (McMaster-Carr, Atlanta, GA) and four layers of double-sided adhesive (DSA) (iTapestore, Scotch Plains, NJ), and a filter membrane (). The device was fabricated utilizing a laser cutter, as previously described.Citation4,Citation7,Citation14,Citation30,Citation31 The device had outer dimensions of 25 × 40 mm. PMMA and DSA layer thicknesses were 1.5 mm and 50 μm, respectively. There was a circular opening with a diameter of 800 μm on the first PMMA layer to allow for blood injection into the inlet chamber. On this layer of PMMA, there was a rectangular opening (7.7 × 8.1 mm2) to collect plasma at the outlet chamber. The second PMMA layer had two separate rectangular openings (7.7 × 8.1 mm2). Underneath the second PMMA layer was a Whatman nuclepore polycarbonate track-etched membrane with low protein-binding capacity (Fisher Scientific, Pittsburgh, PA), and pore sizes ranging from 0.4 to 3 μm in diameter. The third PMMA layer contained two rectangular openings, which were connected by a channel (1.7 × 7.8 × 1.5 mm3). The fourth PMMA layer had no openings. These four PMMA layers and one layer of filter membrane were assembled via four layers of DSA (50 μm in thickness). Once assembled, the filter device had two rectangular chambers (100 μL) above and below the filter membrane (). The rectangular chamber under the filter membrane was connected to the outlet chamber by a microfluidic channel.
Figure 1 (A–E) Design of the size-based filter microchip. (A) Assembly of a size-based filter microchip; (B) functionality of the size-exclusion-based filter microchip (i) cross-section of the assembled device, (ii) injection of blood into the inlet through a pipette, (iii) injection of PBS into the inlet chamber to wash platelets and plasma through the microchannel and into the output channel, (iv) collection of plasma from the outlet; (C) the experimental chart for validation of virus recovery using filter microchips; (D)
the device during filtration; (E) close-up of the plasma separated by the filter membrane.
Abbreviations: PBS, phosphate-buffered saline; RT-PCR, reverse transcriptase–polymerase chain reaction.
Device operation
To investigate the microchip performance, we evaluated the device operation in a range of flow rates using a micropump. After we validated the chip operation using a flow-controlled system, we utilized manual flow for virus separation by pipetting, eliminating the need for a micropump. The filtration process included injection of blood and continuous wash with phosphate-buffered saline (PBS, pH 7.4). First, 40 μL of de-identified whole blood purchased from Blood Research Component (Cambridge, MA) was injected into the inlet chamber using a micropump (Programmable Syringe Pump, Sarasota, FL). Next, a minimum of 200 μL of PBS was injected using a micropump at flow rates of 100, 200, 300, 400, and 500 μL/min. These flow rates covered a broad flow-rate range before evaluating manual pipetting. The injection of PBS allowed the solution in the inlet chamber to replenish as separated plasma was pushed out from the outlet chamber (). Red blood cells (RBCs) and white blood cells (WBCs) were retained by the filter membrane, since their sizes exceed the pore size of the filter membrane. The injected PBS volume used in this study varied from 200 to 500 μL so that the inlet chamber could be completely washed. Following the wash, plasma was collected from the outlet chamber using a syringe with a tubing with an inner diameter of 0.05 cm (VWR Scientific, West Chester, PA) attached. The tubing was pushed from the outlet through the channel to the chamber under the membrane. This approach maximized the collection volume, and the volume of collected plasma was measured using a pipette.
For virus isolation from whole blood, we did not use a syringe pump. We manually introduced HIV-spiked whole blood samples into the microchip using a pipette. HIV subtype C intact particles were isolated from a clinical sample and co-cultured in peripheral blood mononuclear cells using a standard protocol. HIV particles were recovered using the (1 and 2 μm filter membranes) microchip and compared to centrifugation at 1000 g for 10 minutes (chart as shown in ). Forty μL of blood sample was spiked with cultured HIV viruses (with final concentrations of 105, 104, and 103 copies/mL). The spiked samples were loaded into the microchip using a pipette and manually washed with 300 μL of PBS using a manual pipette. The filtration process took approximately 1 minute to complete.
Hematological analysis
D3 Hematology Analyzer (Drew Scientific, Dallas, TX) was used for hematological analysis. The machine was calibrated and maintained according to the manufacturer’s instructions. For hematological analysis, 10 μL of blood sample or plasma filtrate was analyzed to measure the concentration of blood components, ie, RBCs, WBCs, and platelets. The passage rate was calculated as follows:
where concentrationfiltrate is the concentration of WBCs, RBCs, and platelets in the filtrate, and concentrationblood is the concentration of WBCs, RBCs, and platelets in blood before filtration.
Quantification of HIV by RT-qPCR
Plasma filtrate containing HIV subtype C was quantified using RT-qPCR.Citation32 HIV-1 RNA was first extracted using the QIAamp Viral RNA Mini Kit (Qiagen, Valencia, CA) according to the manufacturer’s instructions. In the RT reaction (20 μL), the master mixture contained 10 μL of 2 × core RT buffer, 2 μL of 10 μM of reverse primer LTR-R2 (5′-GTCTGAGGGATCTCTCTAGTTACCAG-3′), 0.5 μL of AffinityScript (Applied Biosystems, Carlsbad, CA), and 7.5 μL of HIV-1 RNA. The RT reaction was carried out at 25°C for 5 minutes, 45°C for 60 minutes, and 95°C for 3 minutes, on the GeneAmp PCR System 9700 (Applied Biosystems). In the following qPCR (50 μL), the master mixture consisted of 1 × core PCR buffer, 0.4 μM of forward primer LTR-F (5′-TAAAGCTTGCCTTGAGTGCT-3′) and reverse primer LTR-R2, 0.2 μM of TaqMan probe LTR-P (JOE as the fluorophore and TAMRA as the quencher), 2.5 U of SureStart Taq polymerase, and 10 μL of cDNA template. The amplification reaction was carried out at 25°C for 5 minutes and then at 95°C for 10 minutes, and it was followed by 50 two-step cycles of 60°C for 1 minute and 95°C for 30 seconds on the 7300 Real-Time PCR System (Applied Biosystems). In addition, seven discarded and de-identified HIV-infected whole blood samples were collected from Massachusetts General Hospital with the approval of the Institutional Review Board (protocol: 2009P000749). These patient samples were processed on-chip as the spiked samples described above. The recovery of HIV was determined by the following formula, in which the parameter of volume was omitted since the sample volume of ultracentrifugation and microchip separation was adjusted in RNA extraction.
The sample volume processed in centrifugation was adjusted to 40 μL, which was equivalent to the sample volume processed on-chip.
Results and discussion
In this study, we developed an on-chip filtration method based on size exclusion, characterized the filter device for plasma filtration from various aspects including pore size, flow rate, and wash volume, and finally applied it to HIV isolation from unprocessed whole blood. Blood components have different sizes; the average diameters of RBCs, WBCs, and platelets are 6–8 μm, 6–20 μm (depending on the cell types, including basophils, eosinophils, lymphocytes, monocytes, and neutrophils), and 1.5–3.5 μm,Citation33 respectively. Thus, we used four different filters with varying pore sizes (0.4, 1, 2 and 3 μm) to explore the capability of a filter membrane assembled in a microfluidic device to separate plasma, which is often used as a standard sample type for clinical diagnosis (eg, HIV viral load measurement). Also, we evaluated the effects of flow rate and wash volume on passage rates of blood components so as to minimize their presence in the filtrate. Lastly, we investigated the on-chip recovery of HIV particles, which have diameters ranging from 110 to 146 nm,Citation29 from whole blood spiked with HIV or from HIV-infected patient blood samples.
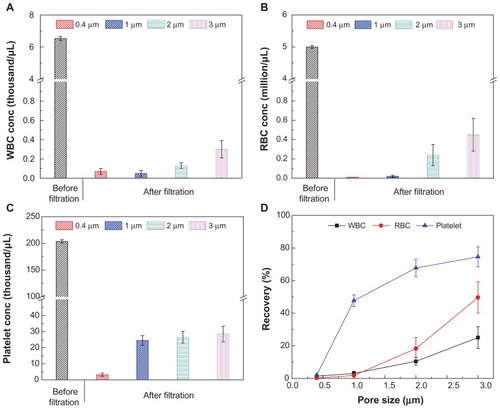
We evaluated the effect of pore size on plasma separation using four filter membranes of different pore sizes (0.4, 1, 2, and 3 μm) and measured the passage rates of blood components. For the pore sizes ranging from 0.4 to 3 μm, WBC concentrations in the filtrate were below 0.3 × 10³/μL, compared to 6.5 × 10³/μL in whole blood (); the RBC concentrations in the filtrate were less than 0.45 × 10⁶/μL, compared to 5.0 × 10⁶/μL in whole blood (); and the platelet concentrations in the filtrate were below 28.5 × 10³/μL, compared to 203.7 × 10³/μL in whole blood (). The size constraint by the filter was also reflected in the passage rates of these blood components in the filtrate (). For the pore size of 0.4 μm, the passage rates of WBCs, RBCs, and platelets were below 2.1%, indicating that these blood components can be separated from plasma by size exclusion–based filter microchips (). It was also observed that by using a 3 μm pore size microchip, a considerable amount of WBCs and RBCs passed through the filters, with the passage rate increasing to 25.1% and 49.7%, respectively. The passage rates of platelets were 47.7%, 67.7%, and 74.6%, using microchips with pore sizes of 1, 2, and 3 μm, respectively. These results indicated that larger pore sizes allowed more cells and platelets to pass through the filter microchip. It should be noted that 0.4 μm filters clogged rapidly since the collected volume of filtrate was 55 ± 6 μL. The collected filtrate volumes were 159 ± 10, 197 ± 8, and 220 ± 5 μL for 1, 2 and 3 μm diameter filters, respectively. Thus, we selected the 2 μm pore–sized filter for further evaluation, as it represented the best balance between high selectivity and high filtrate yield.
Figure 2 (A–D) Comparison of 0.4, 1, 2 and 3 μm pore–sized membranes for blood component filtration. In this experiment, 40 μL of blood was injected into the inlet chamber, and it was subsequently injected with 300 μL of phosphate-buffered saline. To evaluate the separation process, a micropump was used and the flow rate was 300 μL/min. The collected filtrate volumes were 55 ± 6, 159 ± 10, 197 ± 8, and 220 ± 5 μL for 0.4, 1, 2 and 3 μm pore–sized filters, respectively. (A) The concentration of RBCs before and after filtration. (B) The concentration of platelets before and after filtration. (C) The concentration of WBCs before and after filtration. (D) Summary of the passage rate of blood components on-chip.
Note: Data are presented as average ± standard error (n = 6).
Abbreviations: WBCs, white blood cells; RBCs, red blood cells.
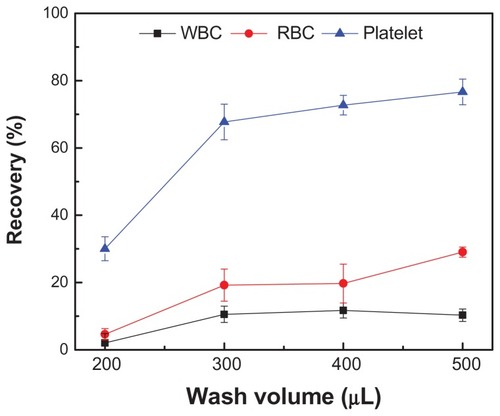
Secondly, we evaluated the effect of wash volume on plasma separation using PBS. For a filter size of 2 μm, the collected volumes at the outlet were 103 ± 6, 202 ± 14, 307 ± 6, and 403 ± 15 μL for wash volumes of 200, 300, 400, and 500 μL, respectively. The passage rates of WBCs, RBCs, and platelets increased as more wash buffer passed through a filter (). For example, the passage rate of platelets increased from 30% to 76% when the wash volume increased from 200 to 500 μL. For WBCs, the passage rate remained at approximately 10% for the wash volumes of 300, 400, and 500 μL. In comparison, the passage rates of RBCs were 19.1% ± 2.4%, 19.7% ± 2.6%, and 29.0% ± 3.1% for the wash volumes of 300, 400, and 500 μL, respectively. It was observed that the average passage rate of RBCs (22.6% ± 5.0%) was higher than that of WBCs (10.8% ± 2.2%) when the wash volume was larger (300–500 μL). These results indicated that larger wash buffer could pass more platelets and RBCs through the filter microchip, which may be due to the deformability of RBCs.Citation34 Thus, we chose a wash volume of 300 μL for the following experiments to maximize the analyte yield and minimize the number of blood cells passing through the filter.
Figure 3 Passage rates of blood components on-chip with different volumes of wash buffer.
Notes: 40 μL of blood was injected into the device with a pore size of 2 μm. Subsequently, the device was injected with 200, 300, 400, and 500 μL of phosphatebuffered saline. To evaluate the separation process, a micropump was used and the flow rate was 300 μL/min. The collected filtrate volumes were 103 ± 6, 202 ± 14, 307 ± 6, and 403 ± 15 μL, for wash volumes of 200, 300, 400, and 500 μL, respectively. Data are presented as average ± standard error (n = 6).
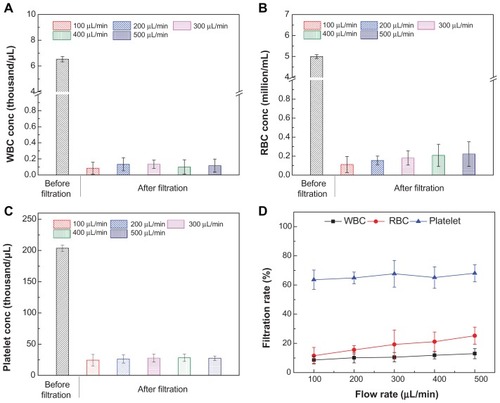
Third, we evaluated the effect of flow rate on the passage rate of blood components, in which a micropump was used to set a flow rate ranging from 100 to 500 μL/minute (). Although the device was designed to be operated by manual flow, we evaluated the filtration performance using a flow pump to set up flow rates within the range that manual pipetting may vary. We observed that the concentrations of WBCs in the filtrate remained below 0.2 × 10³/μL (). In comparison, the concentrations of RBCs increased from 0.11 × 10⁶ cells/μL to 0.22 × 10⁶ cells/μL, as the flow rate increased from 100 to 500 μL/minute (). Under these flow rates, the platelet concentration in the filtrate increased from 24.3 to 27.7 × 10³/μL (). The passage rates of blood components at different flow rates are shown in . The passage rates of WBCs and platelets were not significantly affected by flow rates, with an average passage rate of 10.8% ± 1.6%, and 65.8% ± 1.9%, respectively. There was an increase in the passage rate of RBCs from 11.5% ± 5.7% to 25.2% ± 5.9%, as the flow rate increased from 100 to 500 μL/min. The increase in the passage of RBCs could be due to high flow rates that exert more shear stress on cells and subsequently force RBCs through the filter pores. The passage rates of blood components are summarized in . As shown in and , the evaluated flow rates did not significantly affect the passage rates of blood components, which leads to the conclusion that the flow rate of manual pipetting (within the evaluated flow-rate range) can be used for plasma separation and virus isolation without using a micropump.
Table 1 Effects of device operation parameters on the passage rate of blood components
Figure 4 (A–D) Passage rates of blood components on-chip at different flow rates. 40 μL of blood was injected into the size-based microchips with a pore size of 2 μm at a flow rate ranging from 100 to 500 μL/minute. The device was injected with 300 μL of PBS to evaluate the passage rate. The collected filtrate volume was 202 ± 2 μL. Comparisons of the concentrations of blood components including RBCs (A), WBCs (B), and platelets (C). The passage rates of RBCs, WBCs and platelets were also compared (D).
Note: Data are presented as average ± standard error (n = 6).
Abbreviations: WBCs, white blood cells; RBCs, red blood cells.
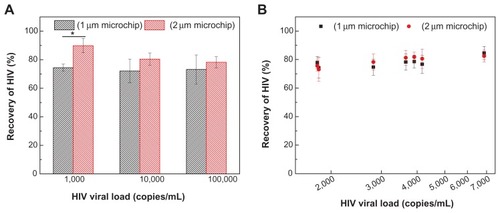
Lastly, we assessed HIV recovery on-chip by employing 1 and 2 μm pore–sized filters by manual pipette-based, pump-free separation (). To prepare HIV samples, we spiked three concentrations (103, 104, and 105 RNA copies/mL) of HIV into whole blood, because current clinical practice recommends 1000–10,000 RNA copies/mL to monitor antiretroviral treatment in resource-constrained settings.Citation35–Citation37 The measured HIV concentrations in the control (without on-chip filtration) were 624, 12,873, and 114,390 copies/mL. The measured HIV concentrations after filtration using microchips of 1-μm pore size were 456, 9280, and 85,173 copies/mL, leading to recovery rates of 74.5% ± 2.4%, 72.1% ± 2.4%, and 73.1% ± 2.4%, respectively (). For the 2 μm pore–size microchip, measured HIV concentrations after filtration were 488, 10,358, and 102,840 copies/mL, leading to recovery rates of 89.9% ± 5.0%, 80.5% ± 4.3%, and 78.2% ± 3.8%, respectively (). These data demonstrate that the presented device can be potentially used for clinical testing. Statistical analysis revealed that 2 μm pore–sized microchips had a higher recovery of HIV viruses than 1 μm pore–sized microchips only at 1000 copies/mL (P < 0.05). In addition, we evaluated our devices using anonymous discarded HIV-infected patient blood samples (). The results showed that 1 μm pore–sized filters had a recovery ranging from 74.2% ± 7.3% to 84.6% ± 4.7%, and 2 μm pore– sized filters had a recovery ranging from 73.1% ± 8.3% to 82.5% ± 4.1%. One-way analysis of variance showed that there was no statistical significance in HIV recovery between these two microchips.
Figure 5 (A and B) Manual pipette-based, pump-free separation of HIV particles from whole blood using the filter microchip. (A) Whole blood samples spiked with HIV at concentrations of 103, 104, and 105 copies/mL, and (B) discarded HIV patient whole blood samples were flowed through filter microchips with membrane pore size of 1 μm or 2 μm.
Notes: Subsequently, blood samples containing HIV particles were manually washed with 300 μL of phosphate-buffered saline and all the filtrate (approximately 200 μL) was collected. HIV recoveries (%) in both 1 μm and 2 μm filter microchips were then calculated using formula 2. Data are presented as average ± standard error (n = 6). One-way analysis of variance was performed. *P < 0.05; in B, x-axis is log-scaled.
The significant difference in HIV recovery at 1000 copies/mL may be attributed to variations in RT-PCR at such a low input of HIV RNA in the reaction. At 1000 copies/mL of HIV spiked in whole blood, loading of 40 μL blood only led to 40 copies of HIV particles in the inlet chamber. Assuming 100% recovery of virus isolation and RNA extraction, 7.5 μL of RNA out of 50 μL extract in RT resulted in six copies of HIV cDNA (twelve copies of LTR DNA), which were further split into two reactions of PCR. In this case, only six copies of HIV LTR were amplified in PCR, which may have led to the difference in HIV recovery at 1000 copies/mL (). By contrast, there was no significant difference in HIV recovery at higher concentrations. Nevertheless, we cannot exclude the possibility that 2 μm pore–sized microchips may allow more free viruses to pass through, since 1 μm pore–sized microchips resulted in relatively lower volumes of filtrate. The 2 μm pore–sized microchips left 0.13 × 10³ cells/μL of WBCs () in the filtrate, compared to a standard centrifugation protocol (1000 g, twice for 10 minutes), which removed nearly 100% of blood cells.
In this study, we demonstrated successful and reliable recovery of HIV particles from whole blood using a filter-based microchip without requiring a micropump. The presented filter microchip can be used to separate plasma for POC testing, including initial sample processing in a microfluidic-based ELISA or PCR virus-detection system. Generally, plasma samples, rather than whole blood, are needed in PCR and ELISA for optimal results. As such, microfluidic-based isolation of plasma samples would facilitate POC testing when integrated with microchip-based immunoassay and nucleic acid amplification,Citation5,Citation38–Citation40 as well as sensing technologies such as surface plasmon resonance,Citation16 photonic crystal-based sensors,Citation17 and spectral reflectance imaging biosensors.Citation41 The example that we demonstrated was virus isolation on-chip, which can facilitate HIV viral load testing in resource-constrained settings since the viral load is defined as the free circulating viruses in plasma. The microchip platform can also be modified to provide sample processing for a host of other applications. Since the virus size is below 1 μm, the developed filter microchip, in principle, can be used as a generic virus–filtration device. Another potential application is that the device may be adapted for filtration of mycobacterium TB, which is approximately 2–4 μm in length and 0.2–0.5 μm in width. This application may require pore sizes as large as 4 μm of efficient separation for mycobacterium TB, since sputum may clog the filter easily due to viscosity.
An apparent advantage of the filter microchip is that the used materials (10¢ on PMMA, and 67¢ on filter membrane) significantly reduce the cost associated with plasma separation in a laboratory setting (consumables and a centrifuge). The filter device was designed to be disposable and inexpensive, thus avoiding contamination between samples. In addition, there is no involvement of antibodies or nucleic acids in the microchip that could degrade with heat or humidity. Thus, the device can be robust at various temperature and humidity conditions. Although hand-cranked centrifuges can be potentially used to provide the required centrifugal forces for plasma separation, they require an operator to continuously crank the centrifuge over a period of time (eg, 10 minutes), which is tedious and may lead to operator-to-operator variations. There have also been efforts to use an eggbeater to separate plasma from blood.Citation42 However, manual centrifugation requires more hands-on time, and this process cannot be readily integrated with on-chip analytical systems. In comparison, the filter microchip only takes a minute to complete the plasma/virus separation, significantly decreasing the turnaround time. Another potential solution to plasma separation at the POC might be to place a filter in a pipette tip. However, the effective filtering area can be considerably limited by the size of pipette tips, which may result in low yields in plasma separation. In addition, fixing the filter in the pipette tips may be technically difficult, and it would be difficult to control the flow, thus causing variations from operator to operator.
Conclusion
In conclusion, we developed a disposable, pump-free, size exclusion–based filter microchip that can be used for plasma and virus separation from unprocessed whole blood samples in resource-constrained settings. Initially, we evaluated the microchip at various flow rates and showed that the flow rate does not affect the HIV recovery rates from whole blood. These evaluated flow rates overlap with range of manual pipetting. Then, we demonstrated that the microchip produces high yields of separated HIV particles and plasma using only manual pipetting, eliminating the complexity of using a micropump. Due to its simplicity, this microfluidic device can be potentially integrated with HIV microchip diagnostic systems, on-chip ELISA and PCR sensing methodologies, and optical detection modalities, thus realizing comprehensive sample-to-result testing. This would eliminate the need for peripheral instruments for plasma separation. Since the pore size of the filter is adjustable, the microchip could be broadly adapted for applications targeting other pathogens, including viruses such as influenza, allowing rapid sample processing and blood screening at the POC.
Acknowledgments
We would like to acknowledge NIH R01 A1081534, NIH R01-A1093282, R21 AI087107, NIH U54EB015408, and R21 HL095960. Also, this work was made possible by a research grant that was awarded and administered by the United States Army Medical Research and Materiel Command (USAMRMC) and the Telemedicine and Advanced Technology Research Center (TATRC), at Fort Detrick, MD.
Disclosure
The authors report no conflicts of interest in this work.
References
- Joint United Nations Programme on HIV/AIDS (UNAIDS)UNAIDS Report on the Global AIDS Epidemic 20102010 Available from: http://www.unaids.org/documents/20101123_GlobalReport_em.pdfAccessed July 18, 2012
- VijaykrishnaDPoonLLZhuHCReassortment of pandemic H1N1/2009 influenza A virus in swineScience2010328152920558710
- CohenJSwine flu pandemic. What’s old is new: 1918 virus matches 2009 H1N1 strainScience20103271563156420339037
- MoonSGurkanUABlanderJEnumeration of CD4+ T-cells using a portable microchip count platform in Tanzanian HIV-infected patientsPLoS One20116e2140921754988
- WangSZhaoXKhimjiIIntegration of cell phone imaging with microchip ELISA to detect ovarian cancer HE4 biomarker in urine at the point-of-careLab Chip2011113411341821881677
- GurkanUAAnandTTasHControlled viable release of selectively captured label-free cells in microchannelsLab Chip201111233979398922002065
- AlyassinMAMoonSKelesHORapid automated cell quantification on HIV microfluidic devicesLab Chip200993364336919904402
- BhattacharyyaAKlapperichCAMicrofluidics-based extraction of viral RNA from infected mammalian cells for disposable molecular diagnosticsSens Actuators B Chem2008129693698
- BhattacharyyaAKlapperichCMThermoplastic microfluidic device for on-chip purification of nucleic acids for disposable diagnosticsAnal Chem20067878879216448052
- Al-SoudWARadstromPPurification and characterization of PCR-inhibitory components in blood cellsJ Clin Microbiol20013948549311158094
- ChakravartiARawatDYadavSWhole blood samples as an alternative to serum for detection of immunity to measles virus by ELISADiagn Microbiol Infect Dis20034756356714711476
- RaivioTKorponay-SzabóIRPaajanenTComparison of a novel whole blood transglutaminase-based ELISA with a whole blood rapid antibody test and established conventional serological celiac disease assaysJ Pediatr Gastroenterol Nutr20084756256718979578
- WangSEsfahaniMGurkanUAInciFKuritzkesDRDemirciUEfficient on-chip isolation of HIV subtypesLab Chip2012121508151522391989
- KimYGMoonSKuritzkesDRDemirciUQuantum dot-based HIV capture and imaging in a microfluidic channelBiosens Bioelectron20092525325819665685
- Santiago-CordobaMABoriskinaSVVollmerFDemirelMCNanoparticle-based protein detection by optical shift of a resonant microcavityAppl Phys Lett201199073701
- TrevinoJCalleARodriguez-FradeJMMelladoMLechugaLMSurface plasmon resonance immunoassay analysis of pituitary hormones in urine and serum samplesClin Chim Acta2009403566219361471
- KimSMZhangWCunninghamBTPhotonic crystals with SiO2-Ag “post-cap” nanostructure coatings for surface enhanced Raman spectroscopyAppl Phys Lett200893143112
- GurkanUAMoonSGeckilHMiniaturized lensless imaging systems for cell and microorganism visualization in point-of-care testingBiotechnol J2011613814921298800
- LeeWGKimYGChungBGDemirciUKhademhosseiniANano/microfluidics for diagnosis of infectious diseases in developing countriesAdv Drug Deliv Rev20106244945719954755
- WangSXuFDemirciUAdvances in developing HIV-1 viral load assays for resource-limited settingsBiotechnol Adv20102877078120600784
- ZhangJLGuoQQLiuMYangJA lab-on-CD prototype for high-speed blood separationJ Micromech Microeng200818125025
- LiTJZhangLMLeungKMYangJOut-of-plane microvalves for whole blood separation on lab-on-a-CDJ Micromech Microeng201020105024
- WalkerGMBeebeDJA passive pumping method for microfluidic devicesLab Chip2002213113415100822
- YangSUndarAZahnJDA microfluidic device for continuous, real time blood plasma separationLab Chip2006687188016804591
- DimovIKBasabe-DesmontsLGarcia-CorderoJLRossBMRiccoAJLeeLPStand-alone self-powered integrated microfluidic blood analysis system (SIMBAS)Lab Chip20111184585021152509
- QinLVermeshOShiQHeathJRSelf-powered microfluidic chips for multiplexed protein assays from whole bloodLab Chip200992016202019568669
- YagerPDomingoGJGerdesJPoint-of-care diagnostics for global healthAnnu Rev Biomed Eng20081010714418358075
- ThorslundSKlettONikolajeffFMarkidesKBergquistJA hybrid poly(dimethylsiloxane) microsystem for on-chip whole blood filtration optimized for steroid screeningBiomed Microdevices20068737916491334
- GentileMAdrianTScheidlerADetermination of the size of HIV using adenovirus type 2 as an internal length markerJ Virol Methods19944843527962259
- MoonSKelesHOOzcanAIntegrating microfluidics and lensless imaging for point-of-care testingBiosens Bioelectron2009243208321419467854
- WangSInciFChaunzwaTLPortable microfluidic chip for detection of Escherichia coli in produce and bloodInt J Nanomedicine201272591260022679370
- CandottiDTempleJOwusu-OforiSAllainJPMultiplex real-time quantitative RT-PCR assay for hepatitis B virus, hepatitis C virus, and human immunodeficiency virus type 1J Virol Methods2004118394715158067
- YoungBLoweJStevensAHeathJWWheater’s Functional Histology: A Text and Color Atlas5th edEdinburghChurchill Livingstone2006
- ParkYBestCAAuthTMetabolic remodeling of the human red blood cell membraneProc Natl Acad Sci U S A20101071289129420080583
- StevensWSScottLECroweSMQuantifying HIV for monitoring antiretroviral therapy in resource-poor settingsJ Infect Dis2010201Suppl 1S16S2620225942
- TanriverdiSChenLChenSA rapid and automated sample-to-result HIV load test for near-patient applicationJ Infect Dis2010201Suppl 1S52S5820225947
- UsdinMGuillermMCalmyAPatient needs and point-of-care requirements for HIV load testing in resource-limited settingsJ Infect Dis2010201Suppl 1S73S7720225951
- HosokawaKOmataMMaedaMImmunoassay on a power-free microchip with laminar flow-assisted dendritic amplificationAnal Chem2007796000600417614367
- LaBarrePHawkinsKRGerlachJA simple, inexpensive device for nucleic acid amplification without electricity-toward instrument-free molecular diagnostics in low-resource settingsPLoS One20116e1973821573065
- LiuCQiuXOngagnaSA timer-actuated immunoassay cassette for detecting molecular markers in oral fluidsLab Chip2009976877619255658
- DaaboulGGVedulaRSAhnSLED-based interferometric reflectance imaging sensor for quantitative dynamic monitoring of biomolecular interactionsBiosens Bioelectron2011262221222720980139
- WongAPGuptaMShevkoplyasSSWhitesidesGMEgg beater as centrifuge: isolating human blood plasma from whole blood in resource-poor settingsLab Chip200882032203719023465