 ?Mathematical formulae have been encoded as MathML and are displayed in this HTML version using MathJax in order to improve their display. Uncheck the box to turn MathJax off. This feature requires Javascript. Click on a formula to zoom.
Abstract
Cerebral cortical astrocyte responses to polyamide nanofibrillar scaffolds versus poly-L-lysine (PLL)-functionalized planar glass, unfunctionalized planar Aclar coverslips, and PLL-functionalized planar Aclar surfaces were investigated by atomic force microscopy and immunocytochemistry. The physical properties of the cell culture environments were evaluated using contact angle and surface roughness measurements and compared. Astrocyte morphological responses, including filopodia, lamellipodia, and stress fiber formation, and stellation were imaged using atomic force microscopy and phalloidin staining for F-actin. Activation of the corresponding Rho GTPase regulators was investigated using immunolabeling with Cdc42, Rac1, and RhoA. Astrocytes cultured on the nanofibrillar scaffolds showed a unique response that included stellation, cell–cell interactions by stellate processes, and evidence of depression of RhoA. The results support the hypothesis that the extracellular environment can trigger preferential activation of members of the Rho GTPase family, with demonstrable morphological consequences for cerebral cortical astrocytes.
Introduction
Astrocytes cultured on electrospun polyamide nanofibers whose nanophysical properties may reproduce key aspects of native extracellular matrices have demonstrated promising results in both in-vitro and in-vivo situations. In vitro, astrocytes cultured on nanofibrillar scaffolds assumed morphologies that appeared to recapitulate those observed in native tissuesCitation1,Citation2 when observed by fluorescent microscopy. Furthermore, autocrine upregulation of fibroblast growth factor (FGF)-2 was demonstrated by Western blot, along with increased neurite outgrowth by co-cultured neurons.Citation1 In vivo, the same scaffolds introduced into spinal cord wound sites promoted accelerated hindlimb recovery, measured by standardized observational scoring (Beattie, Basso, Breshnahan [BBB] score), with aligned and fasciculated axon development and revascularization throughout wound sites.Citation3,Citation4 Furthermore, low levels of astrocytic scarring were observed at 3 and 5 weeks after injury in comparison to injury-only controls, with reduced levels of glial fibrillary acidic protein, a marker for reactive astrocytes, and chondroitin sulfate proteoglycans, a group of molecules expressed by both glial and fibroblastic components of a glial scar and believed to be inhibitory to axonal regrowth.Citation5,Citation6 The in-vitro and in-vivo results suggest that nanofibrillar scaffolds could induce preferential astrocyte differentiation leading to minimized glial scar formation. Attenuation of scarring may be due to a nanofibrillar architecture that closely resembles the features of naturally occurring extracellular matrix/basement membrane scaffolds. It is therefore important to investigate the physical properties of the nanofibrillar environment and to elucidate their directive effects on neural cell responses.
The present work explores the hypothesis that external physical cues of the nanofibrillar scaffolds can trigger the initiation of specific signaling cascades with morphological consequences. The external physical cues of surface polarity and surface roughness were investigated in this study. Previous investigations suggested that surface polarity might be an influential parameter of neural cell responses.Citation7 Because the macroscopic surface roughness introduced by the nanofibrillar scaffolds differed significantly from previous investigations,Citation8,Citation9 this parameter was also considered. Additionally, new nanoscopic investigations of surface roughness were performed. Contact angle measurements were used to assess surface polarity and atomic force microscopy (AFM) was used to investigate both macroscopic and nanoscopic surface roughness.
In this study, the morphological response of cerebral cortical astrocytes to nanofibrillar scaffolds was investigated at high-resolution using AFM. The three-dimensional capability of AFM was also used to characterize cell spreading. An initial study of the corresponding activation of GTPase upstream regulators was performed using immunocytochemistry. For each immunolabel, phalloidin staining of F-actin was also performed to allow assessment of colocalization with the cytoskeleton. The immunocytochemistry study focused on investigation of the main GTPase regulators for the observed morphological responses: filopodia, lamellipodia, stress fiber formation, and stellation. Immunolabeling with Cdc42, Rac1, and RhoA was performed, as these are upstream regulators of filopodia, lamellipodia, and stress fiber formation, respectively.Citation10,Citation11 Inhibition of the RhoA effector kinase (ROCK) through depression of RhoA is one pathway that is associated with the cessation of stress fiber formation and the onset of stellation.Citation12
As only external cues were used to trigger cell responses, astrocyte responses to nanofibrillar surfaces were studied in comparison with their responses to three additional culture surfaces: poly-L-lysine-functionalized planar glass (PLL glass), unfunctionalized planar Aclar (Aclar), and PLL-functionalized planar Aclar (PLL Aclar). PLL glass is a standard astrocyte culture surface, and astrocyte responses to it are well characterized,Citation13 making it useful for identifying differences in astrocyte responses to other surfaces. The polyamide nanofibrillar scaffolds were electrospun on Aclar substrates; therefore, astrocyte responses to Aclar surfaces were investigated to distinguish responses to the nanofibrillar scaffolds from possible responses to the underlying Aclar substrate. Astrocyte responses to PLL Aclar surfaces were studied to clarify the role of the underlying substrate versus surface functionalization.
The results of the morphological investigations and immunocytochemistry experiments consistently indicated that preferential activations of Rho GTPases were induced by the variations in the physical environments. These were directive for specific cell morphologies and responses.
Materials and methods
Culture surfaces
Nanofibrillar scaffolds
Polyamide (proprietary blend) nanofibers (median diameter ∼180 nm) were electrospun from a blend of two polymers [(C28O4N4H47)n and (C27O4.4N4H50)n] onto Aclar coverslips by Donaldson Co, Inc (Minneapolis, MN).Citation14 The resulting non-woven polymeric nanofibrillar scaffold was approximately 2 μm thick when measured on edge by optical microscopy. The matrix comprised approximately ten layers of randomly oriented nanofibers and appeared to be uniformly dense, with ∼25 nanofiber segments per 5 × 5 μm2 scan area per surface layer when measured by AFMCitation1 and no direct openings to the coverslip surface. Astrocytes could attach to the nanofibrillar surfaces but not migrate into them. The nanofibrillar scaffolds in the present study were not chemically modified.
Planar culture surfaces
Glass coverslips (12 mm, No 1 coverglass; Thermo Fisher Scientific, Waltham, MA) and Aclar coverslips (Ted Pella, Inc, Redding, CA) were used as underlying planar substrates. Glass or Aclar coverslips were placed in a 24-well tissue culture plate (one coverslip per well) and covered with 1 mL of PLL solution (50 μg PLL/mL in dH2O) overnight. The coverslips were then rinsed with dH2O, sterilized with ultraviolet light, and used for the cultures. One set of Aclar coverslips was left unfunctionalized.
Primary astrocyte culture
Purity-enhanced cultures of primary astrocytes were established as previously reported.Citation1,Citation3,Citation4 All procedures were approved by the Rutgers Animal Care and Facilities Committee (IACUC Protocol #02-004). This includes a number of steps taken to assure the purity of the primary astrocyte cultures. Briefly, rat cerebral cortical astrocytes were prepared from postnatal day P2 Sprague Dawley rats and grown to confluence in astrocyte medium in 75 cm2 tissue culture flasks. This enhances astrocyte purity, because after birth, the neurons in the cerebral cortex are post mitotic and do not grow in tissue culture (tissue for culturing cortical neuron tissue is obtained from embryos). Astrocyte medium was composed of Dulbecco’s Modified Eagle’s Medium (DMEM; Life Technologies, Carlsbad, CA) +10% fetal bovine serum (Life Technologies), 1% penicillin, and streptomycin (Sigma-Aldrich, St Louis, MO), which does not support growth of primary, dissociated neurons in culture. Cultured astrocytes were then harvested with 0.5% Trypsin/EDTA (Sigma-Aldrich) and reseeded at a density of 30,000 cells per well directly on 12 mm Aclar or PLL Aclar coverslips, PLL glass coverslips, or on Aclar coverslips coated with nanofibers in 24-well trays in astrocyte medium (0.5 mL), and then stained for F-actin, Cdc42, Rac1, and RhoA. The subculturing processes further purified the primary cultures. Parallel cultures were immunostained with glial fibrillary acidic protein (GFAP), a marker for astrocytes, and more than 95% were found to be GFAP positive.
Contact angle
Contact angle measurements of culture surfaces were acquired using VCA Optima contact angle analysis equipment (AST Products, Inc, Billerica, MA). Two samples from each set of culture surfaces were analyzed by five randomly selected measurements from each sample. Variations in contact angle data among the culture surfaces were analyzed using analysis of variance (ANOVA) followed by pairwise post hoc comparisons with Tukey’s test.Citation15 Significance levels were set at P < 0.05.
Optical microscopy
Differential interference contrast (DIC) images (eight per substrate) using Olympus software FV10-ASW, version 03.01.02.02 (Olympus Corporation, Tokyo, Japan) were captured to ensure that representative specimens were considered for AFM investigation. The 30,000 cell plating density versus the cell adhesion density for the individual substrates was also investigated.
AFM
AFM images of individual astrocytes at 24 hours were acquired using a Veeco Instruments Nanoscope IIIA (Bruker AXS Inc, Madison, WI; formerly Veeco Metrology) operated in ambient air. Three scanners were used, as noted in the relevant figure captions: a J scanner with 125 μm × 125 μm × 5.548 μm x-y-z scan range, an E scanner with 13.5 μm × 13.5 μm × 3.08 μm x-y-z scan range, and an A scanner with 1 μm × 1 μm ×0.66 μm x-y-z scan range. Both contact mode, using silicon nitride tips with a nominal tip radius of 20 nm and cantilever spring constant k = 0.58 N/m, and tapping mode, using silicon tips with a nominal tip radius of 10 nm and drive frequency of ∼320 kHz, were used. The closed-loop Multimode scanner (iCXY100Z15-MM; nPoint Inc, Middleton, WI) with 100 μm × 100 μm × 15 μm x-y-extended z scan range was used to investigate astrocyte morphology on Aclar surfaces.
As the heights of the cellular processes investigated on the nanofibrillar scaffolds were on the same order as the background nanofibers, it was not possible to clearly distinguish them in conventional height, amplitude, or phase images. Frequency domain Gaussian high pass filtering (GHPF) was therefore used to segment the cellular extensions from the nanofibrillar background in height images.Citation16 AFM images of at least 30 astrocytes for each culture surface were evaluated to ensure that the results were representative. Astrocytes having stellate morphologies were counted to obtain the percentage stellation for each cell culture used in this work using the sum criteria as previously reported.Citation17 Astrocytes having at least one process longer than the width of the cell soma were considered as stellate.
AFM surface roughness analysis of the scaffolds was performed by Nanoscope Software version 5.30r3.sr3. Square 1 ×1 μm2 and 10 ×10 μm2 regions were randomly selected, and five measurements were taken from each sample. The flatten command was used to remove the bow of the AFM height images. Surface roughness data along individual nanofibers were collected using scanning probe recognition microscopy (SPRM).Citation18,Citation19 Variations in root mean square (RMS) surface roughness data among the culture surfaces were analyzed using ANOVA followed by pairwise post-hoc comparisons with Tukey’s test.Citation15 Significance levels were set at P < 0.05.
Immunofluorescence and analysis
Antibody and F-actin staining of astrocytes
The astrocytes cultured on coverslips were fixed with 4% paraformaldehyde for 10 minutes, permeabilized with 0.5% Triton X-100 for 5 minutes, and blocked with 10% normal goat serum for 30 minutes. After removing the normal goat serum, the cells were double stained with one of the primary antibodies mouse anti-Cdc-42 (1:200), mouse anti-RhoA (1:200), or mouse anti-Rac1 (1:25) (all from Cytoskeleton, Denver, CO), and phalloidin (Life Technologies). The incubation in the primary antibodies was done overnight at room temperature in a humidity chamber. Coverslips were then washed with phosphate buffered saline (PBS) and stained with goat anti-mouse Alexa 568 IgG secondary antibody (ex 579 nm, em 603 nm; Life Technologies) at a 1:500 dilution for 1 hour. Following the antibody staining, the cells were rinsed, stained with Phalloidin-488 (ex 498 nm, em 520 nm; Life Technologies) at a 1:100 dilution for 1 hour, mounted on microscopic slides with GelMount (Biomeda, Foster City, CA), and observed under an Olympus IX81 inverted microscope (Olympus).
Image capture conditions for immunocytochemistry structural investigation
A first set of six representative projection images for each substrate and immunolabeling condition: Cdc42, Rac1, RhoA, each with corresponding phalloidin staining, were captured using fluorescence microscopy, at scales and pixel resolutions that gave optimal representation of structural features (72 cells total).
Image capture conditions for protein expression estimate
A second set of maximum intensity level grayscale images were captured specifically for protein estimation. These had identical scale bars and pixel resolutions as required for accurate comparative analysis of activation intensity patterns. Five images (via 20× objective) were captured for each of the three antibodies on each of the four culture surfaces. At this magnification, each image typically continued several whole cells, and a total of 240 cells were investigated. Images of the astrocyte cultures were captured using Metamorph software (Molecular Devices LLC, Sunnyvale, CA). For each condition, a minimum of five images was captured from different regions of three coverslips to ensure that the results were representative for the cultures as a whole. The amount of detected protein was quantified by selecting a constant rectangular region and measuring the total fluorescence intensity. The mean background intensities of the fluorescence images were calculated and then subtracted from the total fluorescence intensity value. ImageJ software version 1.44p was used for the quantitative analysis of light intensity. Intensity data were analyzed using ANOVA followed by pairwise post-hoc comparisons with Tukey’s test.Citation15 Significance levels were set at P < 0.05.
Analysis of cytoskeletal colocalization
Colocalization analysis of RhoA and F-actin was performed on the first set of images using Olympus Software FV10-ASW version 03.01.02.02 (Olympus). A Pearson coefficient (PC) measure of the colocalization of two proteins was calculated as
six examples from each of the three combinations. F1,i is average brightness of wavelength λ1 at i-th pixel, F2,i is average brightness of wavelength λ2 at i-th pixel,
is average brightness of wavelength λ1, and
is average brightness of wavelength λ2.Citation20
Prior to the calculation of each PC, the background was removed by setting the threshold level manually subsequent to cell segmentation. Individual values were used to calculate a mean value PC ± standard deviation. All results met two separate reliability criteria: a mean PC value >0.5 and a standard deviation of less than 25%.
Results
Culture surface properties
Contact angle results
The hydrophobicity of tissue cultures has been suggested as a possible material property for reduced astrocyte growth.Citation8 In this work, the hydrophobicity of the PLL glass, nanofibrillar scaffolds, Aclar, and PLL Aclar surfaces were characterized by contact angle analysis ().
Figure 1 Contact angle investigation of surface polarity.
Notes: The mean contact angles of the four tissue culture surfaces indicated differences. Error bars show the standard deviation. The contact angle on Aclar was significantly different than on the other three surfaces (analysis of variance, followed by Tukey’s test, max P = 0.017).
Abbreviations: PLL Aclar, poly-L-lysine-functionalized planar Aclar; PLL glass, poly-L-lysine-functionalized planar glass.
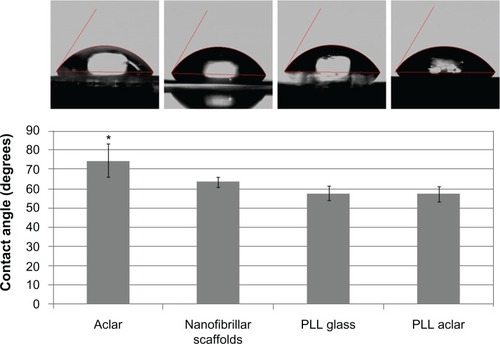
The contact angle was significantly different among the different surfaces (ANOVA, P = 0.0002). Post hoc pairwise comparisons with Tukey’s test demonstrated that the contact angle on Aclar surfaces was significantly different than each of the other surfaces (max P = 0.017). No significant differences were identified from pairwise comparisons among the PLL Aclar, PLL glass, and nanofibrillar scaffolds (min P = 0.280). Aclar surfaces were therefore significantly more hydrophobic than nanofibrillar scaffolds, PLL glass, and PLL Aclar surfaces.
AFM surface roughness results
Surface roughness measured with AFM showed that two scales of surface roughness were present on the nanofibrillar surfaces: a large overall RMS roughness and a much smaller RMS roughness along the nanofibers (). The overall nanofiber roughness was more than an order of magnitude greater than the roughness of any of the other surfaces (ANOVA, followed by post-hoc pairwise comparisons with Tukey’s test, all P < 0.0001). A separate analysis, followed by pairwise comparisons of the surface roughness among PLL glass, PLL Aclar, and Aclar surfaces indicated that each was different than the other (max P = 0.0111).
Figure 2 AFM surface roughness investigation of scaffolds. High-resolution AFM deflection images of (A) nanofibrillar scaffold, (B) PLL glass, (C) Aclar, and (D) PLL Aclar by an A scanner RMS surface roughness measurement results (E) of nanofibrillar scaffolds, along nanofibers, PLL glass, Aclar, and PLL Aclar.
Notes: Scale bars, 250 nm. The mean RMS surface roughness measurements showed that nanofibrillar scaffolds had the highest surface roughness but surface roughness along individual nanofibers was comparable to the planar surfaces (inset). Error bars show the standard deviation.
Abbreviations: AFM, atomic force microscopy; PLL Aclar, poly-L-lysine-functionalized planar Aclar; PLL glass, poly-L-lysine-functionalized planar glass; RMS, root mean square.
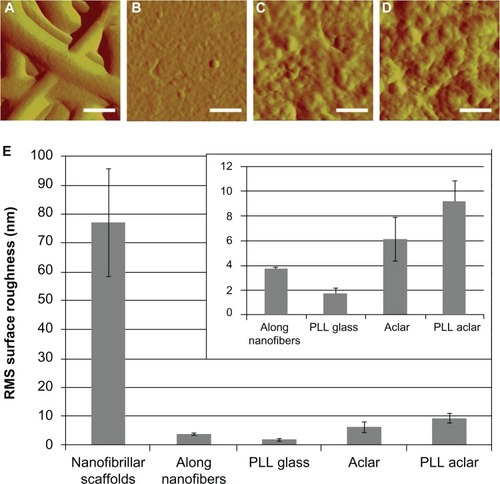
SPRMCitation18,Citation19 was used to investigate the surface roughness along individual nanofibers. SPRM AFM data was obtained by raster-scan auto-tracking along individual nanofibers.Citation18 The RMS surface roughness was calculated on each pixel based on a local neighborhood region, after curvature removal by Kasa circle fit.Citation21 The local neighborhood region was a rectangular box around each pixel whose box size was set to be close to the nanofiber diameter. Multiple sets of overlapping surface roughness information were generated, with the provision that any box that extended outside the nanofiber boundaries was automatically truncated. Based on a sampling of over 1000 data points from multiple nanofibers, the mean value of the RMS surface roughness along the individual nanofibers was midway between the values for PLL glass and Aclar. The AFM surface roughness results therefore indicated that the nanofibrillar surfaces had significantly higher RMS surface roughness at the macroscopic level but lower RMS surface roughness at the cell receptor level, with values that were comparable to those of PLL glass. Representative high-resolution A-scanner AFM height images of the four surfaces are shown in , and the mean values for RMS surface roughness ± standard deviation are shown in .
Optical microscopy survey of astrocyte morphology and cell density
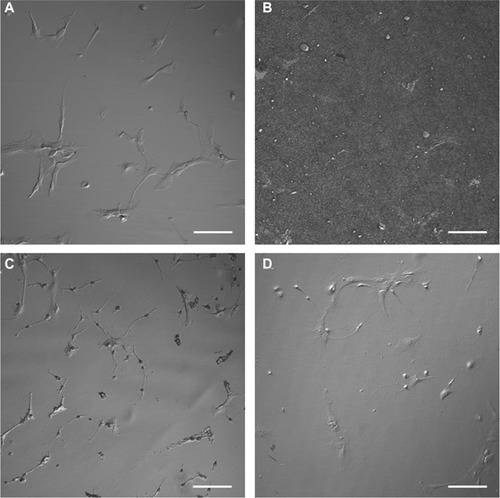
DIC images (eight per substrate) were captured to ensure that representative specimens were considered for AFM investigation. The results shown in indicated that relatively homogeneous populations of astrocytes with different morphologies were present on each substrate. The 30,000 cell plating density versus the cell adhesion density for the individual substrates was also investigated. The mean value results in cells per mm2 were: PLL glass, 86; nanofibrillar scaffolds, 56; Aclar, 90; and PLL Aclar, 91. It is noted that DIC and also brightfield images (not shown) were unable to resolve the cell morphologies of astrocytes on nanofibrillar scaffolds, as shown in . This is because the cellular edges and processes are approximately the same order in height as the background nanofibers, ∼100–200 nm.Citation16 The adhesion density for astrocytes on nanofibrillar scaffolds was therefore estimated from GHPF filtered AFM images.
Figure 3 Differential interference contrast images of astrocytes cultured on (A) PLL glass, (B) nanofibrillar scaffolds, (C) Aclar, and (D) PLL Aclar.
Note: Scale bars, 100 μm.
Abbreviations: PLL Aclar, poly-L-lysine-functionalized planar Aclar; PLL glass, poly-L-lysine-functionalized planar glass.
AFM investigation of astrocyte morphology and interactions
AFM provided detailed three-dimensional images of cell morphologies and cell–cell and cell–surface interactions. Astrocyte responses to PLL glass surfaces are briefly discussed first, to place differences noted in astrocyte responses to the nanofibrillar scaffolds and the Aclar surfaces in the context of previously reported results.Citation22
Astrocyte responses to poly-L-lysine-functionalized glass surfaces
Different stages of attachment and growth were observed simultaneously at 24 hours as shown in the representative seven-member group shown in . Most cells had lamellipodial vertices, suggesting activation of Rac.Citation23 Fan-shaped astrocytes were also observed; this is a morphological indicator of a migratory phenotype via lamellipodial leading edges.Citation24 Cell clusters were observed, such as shown in the upper left. Potentially apoptotic cells were occasionally observed, as shown in the lower right. Close-ups of areas marked by arrows in show details of: a lamellipodial migration leading edge, with stress fibers evident (); filopodial anchor spikes (); and interacting lamellipodia between two cells ().
Figure 4 AFM astrocyte morphology investigation on PLL glass. (A) AFM high pass filtered composite height image of astrocytes by J scanner show lamellipodia formation (scale bar, 20 μm). (B–D) Close-ups by E scanner of arrow regions a–d shown in (A): stress fibers (B); filopodia anchors (C); and cell–cell interaction (D) (scale bars, 2 μm). (E and F) Cross-section profiles of cells e and f in (A).
Note: Axis units are in μm with astrocyte soma extent identified by red arrow.
Abbreviations: AFM, atomic force microscopy; PLL glass, poly-L-lysine-functionalized planar glass.
AFM profile measurements of cell soma typically showed well delineated nuclear and cytoplasmic regions. Representative section measurements across cells (along the dotted lines of ) are shown in . Nuclear regions in these desiccated samples had maximum heights of 0.5–1.0 μm. Cytoplasmic regions were often directional about the nucleus.
Astrocyte responses to nanofibrillar scaffolds
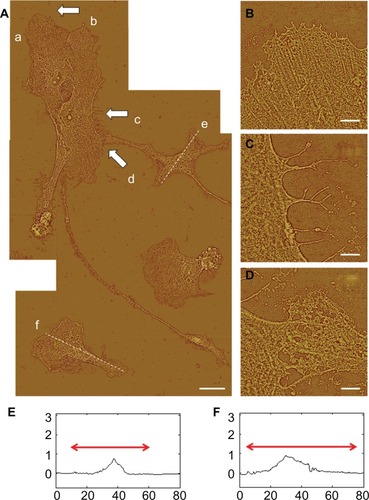
Astrocyte responses to the nanofibrillar scaffolds were different from those observed for PLL glass. Astrocytes cultured on nanofibrillar surfaces typically had stellate morphologies as shown in the composite AFM images of and . Also, for most cells at 24 hours, one vertex had developed into a process that traversed most or all of the distance to a neighboring cell as shown in . AFM section measurements of cell somata showed well delineated nuclear regions about 1–2 μm in height with elevated perinuclear regions.Citation17 Representative profiles taken along the dotted lines in are shown in .
Figure 5 AFM astrocyte morphology investigation on nanofibrillar scaffolds. (A) AFM GHPF composite height image of astrocytes cultured on nanofibrillar surfaces by J scanner. Scale bar, 20 μm. (B–D) Cross section profiles of cells b–d in (A).
Note: Axis units are in μm with astrocyte soma extent identified by red arrow.
Abbreviations: AFM, atomic force microscopy; GHPF, Gaussian high pass filtering.
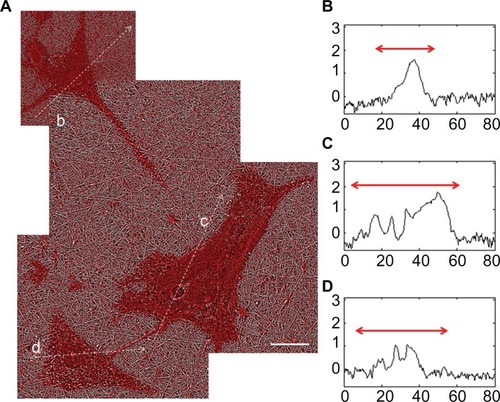
Figure 6 Atomic force microscopy high pass filtered composite height images of astrocytes cultured on nanofibrillar scaffolds by J scanner. (A) Dashed box identifies the intercellular connection. (B) Close-up of the intercelluar connection by E scanner. Dashed box identifies a contacted area. (C) Close-up of a contacted area by E scanner.
Note: The scale bars show 10, 2, and 0.5 μm in (A), (B), and (C), respectively.
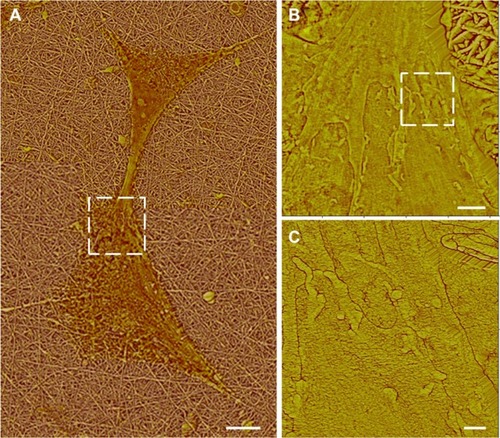
Process-mediated cell–cell interactions appeared to result from contacts between neighboring cells. Multiple examples (not shown) of process growth were studied with the following observations. Processes typically tapered to ∼1 μm wide and ∼100 nm tall at their narrowest points and then developed broadened tips (∼8–15 μm wide) within about 5 μm of a neighboring cell, as shown by the interacting cell pair in . Ribbon-like elongations from the broadened tips formed the actual physical contact to the neighboring cell. In the example shown in , the ribbon-like structures are visible on the top surface of a neighboring cell (boxed region in and its closeup, ); in other cell–cell interactions (not shown), they extended across an open gap to contact a cell at their tips. Interdigitating, 10 nm-diameter villar-like structures were typically observed near the contacted region as shown in , which is a close-up image of the boxed region in .
Astrocyte responses to unfunctionalized Aclar planar surfaces
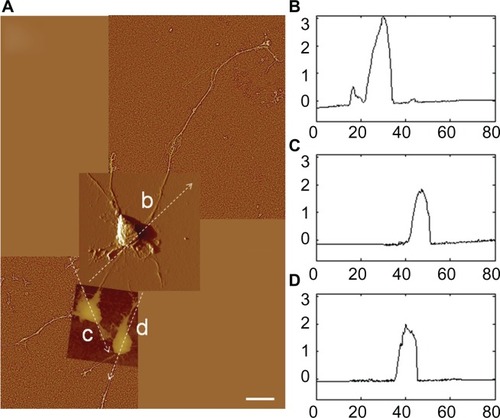
Astrocyte responses to the Aclar surfaces were different from those observed for both PLL glass and nanofibrillar scaffolds. Extensive networks of astrocyte processes about 100–150 nm in diameter were observed between astrocytes, as shown in the composite AFM image of . The three-dimensional AFM investigation demonstrated that the cell somata were not well spread, as shown in the representative section measurements of , taken along the dotted lines in . Maximum somata heights frequently exceeded 3 μm, requiring use of an extended z-range scanner.
Figure 7 (A) AFM GHPF composite height image of astrocytes cultured on Aclar surfaces by J scanner. Scale bar 20 μm. (B–D) The cross sections shown by b–d in (A) were given in corresponding section profiles.
Note: Axis units are in μm.
Abbreviations: AFM, atomic force microscopy; GHPF, Gaussian high pass filtering.
Astrocyte responses to PLL functionalized Aclar planar surfaces
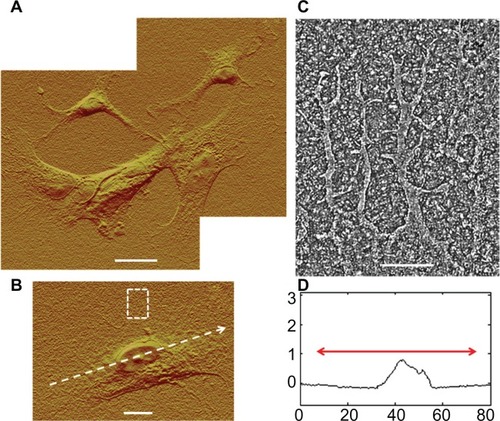
PLL functionalization of Aclar surfaces induced astrocyte behavior consistent with those cells cultured on PLL glass. Astrocytes were once again observed in clusters, as shown in and were well spread. The typical heights of the well-defined nuclear regions were also similar, 0.5–1.0 μm, as shown in . The chief difference between the astrocyte responses to PLL Aclar versus PLL glass was the increased cell edge interaction with the substrate. High resolution AFM investigation of cell edges revealed branched structures that appeared to infiltrate along the valleys created by the surface roughness, as shown in .
Figure 8 AFM investigation of astrocytes cultured on PLL Aclar surfaces. (A) Composite AFM deflection image of astrocytes by J scanner. Scale bar, 20 μm. (B) AFM deflection image of an astrocyte by J scanner. Scale bar, 10 μm. Dotted arrow identifies cross section. Dashed box identifies a cell edge. (C) Corresponding cross section profile. Axis units are in μm with astrocyte soma extent identified by red arrow. (D) Corresponding cell edge showing nanoscale filopodia by E scanner.
Notes: Scale bar, 2 μm.
Abbreviations: AFM, atomic force microscopy; PLL Aclar, poly-L-lysine-functionalized planar Aclar.
AFM-based assessment of astrocyte stellation response
A stellation response, defined in Davis-Cox et alCitation17 as the development of a process longer than the cell body, was assessed based on AFM images of 35–45 cells per each culture surface. Use of the GHPF as described in Tiryaki et alCitation16 enabled accurate assessment of process lengths on nanofibrillar surfaces. The stellation responses based on GHPF AFM height images or on AFM deflection images are shown in . The highest percentage of stellate cells was found on the nanofibrillar scaffolds.
Table 1 Quantitative astrocyte stellation response results
Immunocytochemistry
Rac1, Cdc42, and RhoA are Rho GTPase family members that are involved in actin and microtubule dynamics.Citation25,Citation26 Cdc42 produces filopodial extensions,Citation10 Rac1 induces lamellipodia formation and membrane ruffling,Citation23 and RhoA causes actin bundles and focal adhesions in nonneuronal cells.Citation27 Kalman et al have shown that Rac1 and RhoA GTPases induce growth of hippocampal astrocyte processes.Citation28 The four key morphologies observed in varying proportions on the different surfaces using AFM suggested preferential Rac1, Cdc42, and RhoA involvement. The expression of these GTPase proteins, as well as F-actin organization, was investigated with immunocytochemistry and phalloidin staining, respectively.
Immunocytochemistry structural investigation
An immunocytochemistry structural investigation was performed to investigate whether protein expression was generally consistent with the observed AFM morphology results. Six representative images for each substrate and immunolabeling condition were captured and studied, with typical results shown in . From analysis of the phalloidin results, astrocytes on PLL glass displayed prominent stress fibers. Astrocytes on nanofibers displayed a stellate response with obviously less stress fiber formation. Astrocytes on PLL Aclar consistently displayed extensive filopodia formation. Astrocytes on Aclar appeared to display less filopodia formation; however, the full extent of the branched networks shown in consistently required AFM for observation. The phalloidin results of the immunocytochemistry structural investigation therefore generally supported the results of the AFM morphology study.
Figure 9 Immunocytochemistry structural investigation results. Left to right: fluorescence images of astrocytes cultured on PLL glass, nanofibrillar scaffolds, Aclar, and PLL Aclar substrates. Immunnolabeling and corresponding phalloidin are represented in red and green, respectively. Astrocytes were labeled with (A) anti-Cdc42, (B) anti-Rac1, and (C) anti-RhoA.
Note: Scale bars, 10 μm.
Abbreviations: PLL Aclar, poly-L-lysine-functionalized planar Aclar; PLL glass, poly-L-lysine-functionalized planar glass.
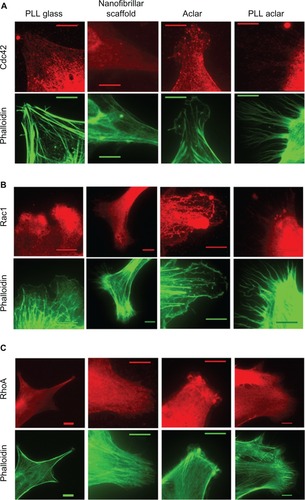
Analysis of the immunolabeling results suggested upregulation of RhoA for astrocytes on PLL glass versus downregulation of RhoA for astrocytes on nanofibers. It also indicated possible differences in the sequestration of the protein expression, ie, whether the greatest intensity was observed near the cell periphery or the cell interior. A semi-quantitative protein expression estimate and a colocalization analysis were therefore performed to address these two points.
Protein expression estimate
A protein expression estimate based on maximum intensity level images was performed. A second set of maximum intensity level grayscale images (not shown) was captured specifically for quantification analysis and estimation. These had identical scale bars and pixel resolutions and were therefore accurate for the comparative analysis of activation intensity patterns. Twenty whole cell images (via 20× objective) for each of the three antibodies co-stained with phalloidin on each of the four culture surfaces were investigated using maximum intensity levels (240 cells total). The ImageJ softwareCitation29 free-hand tool was used to individually outline the area of each cell. ImageJ software was further used to calculate a mean intensity defined as the total intensity divided by the selected area. The results were compiled into an average mean intensity with standard error for each antibody type on each culture surface. The average mean intensities of the maximum intensity levels were used to investigate the activation intensity patterns for each surface.
The activation intensity patterns for Cdc42, Rac1, and RhoA are shown in . For each surface, significant differences were observed in the intensity of immunostaining among Cdc42, RhoA, and Rac1 (ANOVA, max P = 0.023), which regulate actin dynamics and cell adhesion. For astrocytes cultured on PLL glass, post hoc analysis with Tukey’s test revealed that the intensity of RhoA labeling was significantly greater than Cdc42 (P = 0.0005) and Rac1 (P = 0.0289). Labeling of Cdc42 and Rac1 were not statistically different (P =0.366). For astrocytes cultured on nanofibers, the intensity of Cdc42 immunolabeling was significantly greater than RhoA (P =0.0154). No significant differences were detected between Cdc42 and Rac1 (P =0.663) or Rac1 and RhoA (P = 0.120).
Figure 10 The white, gray, and dark gray bars show the Cdc42, Rac1, and RhoA intensities, respectively.
Notes: The data is based on maximum intensity level images. Bars show the mean, and error bars show standard error of n = 20 cells.
Abbreviations: PLL Aclar, poly-L-lysine-functionalized planar Aclar; PLL glass, poly-L-lysine-functionalized planar glass.
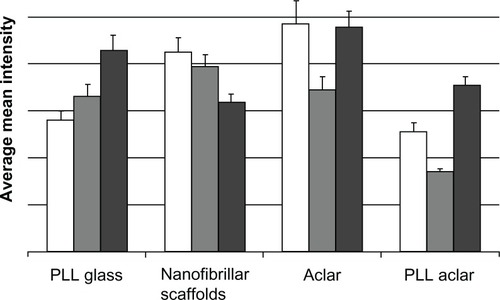
For astrocytes cultured on Aclar, Cdc42 immunolabeling was significantly greater than Rac1 (P = 0.041). No differences were observed in labeling of Cdc42 and RhoA (P = 0.995). Large differences were observed between Rac1 and RhoA expression on Aclar, but the P-value following Tukey’s test (P = 0.051) did not reach the significance threshold of P < 0.05. For cells cultured on PLL Aclar, the intensity of each immunolabel was significantly different from the other two (max P = 0.001).
The results for astrocytes on PLL glass showed RhoA > Rac1 > Cdc42. This result was consistent with the AFM morphology and immunocytochemistry structural investigations, and indicated that RhoA activation had occurred by 24 hours. The results for astrocytes on nanofibrillar scaffolds were reversed: Cdc42 > Rac1 > RhoA. The depression of RhoA relative to Rac1 is consistent with the stellate formation of the astrocytes, as RhoA negatively regulates stellation.Citation30 The activation intensity results for astrocytes on Aclar and PLL Aclar are similar to each other but different from the PLL glass and nanofiber patterns, with Rac1 being depressed relative to both Cdc42 and RhoA: Cdc42 > Rac1 < RhoA.
Colocalization analysis
The possible colocalization of actin with RhoA was investigated, using six 100× magnification fluorescence microscopy images of leading edges. Nanofiber autofluorescence apparent in the Cdc42 channel was minimized prior to PC calculation, as discussed in the Materials and methods section.
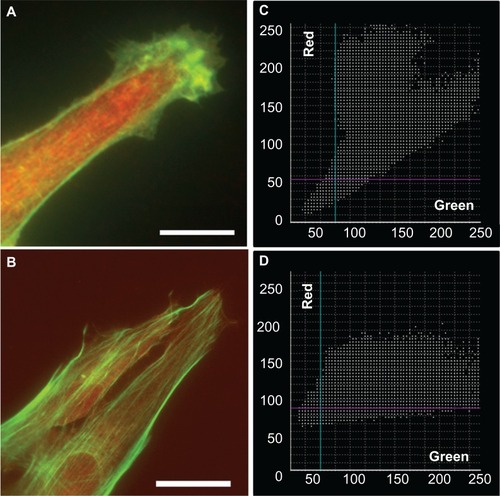
Investigation of the colocalization of RhoA with F-actin yielded reliable results for astrocytes cultured on the nanofibrillar and PLL glass surfaces, with PCs equal to 0.656 ±0.153 and 0.584 ±0.096, respectively. While both exhibited partial colocalization, the character of the colocalization appeared to be different. Scatter plots obtained from astrocytes on the nanofibrillar surfaces consistently showed a weak tendency toward negative colocalization, which was supported by the appearance of the corresponding colocalization images. Scatter plots obtained from astrocytes on the PLL glass surfaces consistently showed partial colocalization but tended to be noisy. The slopes of the scatter plots were also different, astrocytes on the nanofibrillar surface showed higher intensity of RhoA, whereas the PLL glass surfaces indicated higher intensity of F-actin ().
Figure 11 Overlaid fluorescence images of astrocytes cultured on nanofibrillar scaffolds (A) and PLL glass (B) labeled with phalloidin (F-actin) and anti-RhoA. The fluorescence was represented in green for F-actin and red for RhoA in (A) and (B). The scatter plots of F-actin and RhoA for nanofibrillar scaffolds (C) and PLL glass (D) showed partial colocalization with a mean PC of 0.66 and 0.58 respectively.
Note: Scale bar in (A) 10 μm, and (B) 20 μm.
Abbreviation: PLL glass, poly-L-lysine-functionalized planar glass.
Discussion
Investigation of the morphological responses of cerebral cortical astrocytes to the four different culture surfaces demonstrated a series of responses, which involved combinations of filopodia, lamellipodia, stress fiber formation, and stellation. The three-dimensional nature of AFM imaging demonstrated that differences in cell spreading were involved. Preferential activation of Rho GTPase upstream regulators known to be associated with the morphological responses was demonstrated using immunocytochemistry. The observed responses were induced by the four different culture surfaces without the introduction of any chemical agents. The results therefore support the hypothesis that the extracellular environment can trigger preferential activation of members of the Rho GTPase family with demonstrable morphological consequences for cerebral cortical astrocytes.
The maximum intensity level images of immunolabeling results of Cdc42, Rac1, and RhoA indicated that preferential activation of Cdc42 compared with RhoA occurred for the astrocytes on the nanofibrillar surfaces, while the opposite, preferential activation of RhoA compared with Cdc42, occurred for the astrocytes on the PLL glass. Partial colocalization of RhoA and F-actin was also demonstrated by astrocytes on the PLL glass. The standard interpretation of the immunolabeling results for PLL glass would be that at 24 hours, the astrocytes on the PLL glass surfaces had formed contractile stress fibers.Citation31 The morphological response observed by the AFM and phalloidin imaging showed prominent stress fiber formation, consistent with the standard interpretation. In contrast, astrocytes on the nanofibrillar surfaces showed a different morphological response. The astrocytes on nanofibrillar scaffolds displayed the highest percentage of stellate response, with long processes instead of the lamellipodia/filopodia observed on the PLL functionalized surfaces. This is consistent with previously reported results.Citation1–Citation4,Citation13 There was also a difference in the typical cell body shape, with vertices instead of a rounded, lamellipodial morphology. Using GHPF AFM, it was also shown that by 24 hours direct cell–cell interaction by long processes with specialized contacting structures had occurred. The immunocytochemistry results indicated that RhoA was depressed relative to Cdc42. This would be consistent with stellation induced by inhibition of the ROCK through depression of RhoA.Citation12 It has been reported that stellation can proceed via either protein kinase C (PKC) or cyclic AMP dependent protein kinase A pathways.Citation17 Additional investigations suggest that RhoA is an effector of the PKC signaling pathway.Citation30 A possible hypothesis consistent with the present results is that stellation was associated with inhibition of Rho kinaseCitation12 achieved through depression of RhoA levels, potentially with alteration to the PKC cycle.Citation30
As no chemical agents were used, the differences in the responses were attributed to differences in the physical environments. The contact angle measurements demonstrated that the nanofibrillar scaffolds had surface polarities that were about 10% more hydrophobic than those of the PLL glass and PLL Aclar surfaces. This enables some of the known properties of PLL functionalization to be extrapolated to the unfunctionalized nanofibrillar scaffolds. PLL functionalization is known to add positive charge to culture surfaces. The net charge behavior of cell membranes is dominated by negatively charged sialic-acid-containing glycoproteins.Citation32,Citation33 Therefore, the expected interaction between the astrocytes and the PLL functionalized surfaces would be to maximize the Coulomb interaction, resulting in an increase of the cell-substrate interaction area and spreading of the cell body; and this was the effect that was observed. Astrocytes on the nanofibrillar surfaces displayed less cell spreading, while astrocytes on the Aclar surfaces, about 30% more hydrophobic than the PLL surfaces, were characterized by a marked lack of cell spreading. These results and othersCitation34 suggest that astrocytes may be fairly sensitive to the charge characteristics of their environments, which is a hypothesis that can be tested in future work.
The surface roughness variations considered in the present work were those that existed “naturally” in the four culture environments. These measurements demonstrated that two scales of surface roughness were present on the nanofibrillar surfaces: a large-scale RMS roughness between nanofibers and a small-scale RMS roughness along the nanofibers. The RMS roughness along the individual nanofibers was close in value to that of the PLL glass surfaces. Therefore, one distinguishing physical property for the nanofibrillar surfaces was the large-scale component of their surface roughness. This suggests that multiple receptor types may be involved in the astrocyte response to nanofibrillar scaffolds.
Astrocyte responses to the PLL glass and PLL Aclar surfaces appeared to reflect the differences in their surface roughness. The AFM surface roughness measurements demonstrated that significant differences in RMS surface roughness existed between the PLL glass and PLL Aclar surfaces, although similarity in their surface polarity, confirmed by the contact angle measurements, was achieved through PLL functionalization. The AFM results indicated that there was a stronger stimulation of filopodia formation on the PLL Aclar surfaces, although the cell clustering and cell spreading behavior was similar for the astrocytes on the PLL glass and PLL Aclar surfaces. The AFM images further demonstrated that the astrocyte filopodia appeared to infiltrate the valleys on PLL Aclar (). The immunocytochemistry results indicated that Cdc42 activation was significantly greater than Rac1 activation for the PLL Aclar surfaces, which is consistent with a filopodia response. The Cdc42 activation was significantly less than Rac1 activation for the PLL glass surfaces. These results suggest a possible link between the nanoscale surface roughness and activation of Cdc42, with consequent filopodia formation as an exploratory response.
Surface roughness may be a meaningful parameter for certain response aspects rather than a dominant factor for an overall response in astrocytes. As the latter may be an aggregate of all meaningful parameters, not just one, the nanoscale influence of surface roughness should continue to be investigated.
Conclusion
Morphological differences among astrocytes cultured on PLL glass, nanofibrillar matrices, Aclar, and PLL Aclar surfaces were demonstrated with AFM and phalloidin staining of F-actin. The differences and similarities of the morphological responses were consistent with differences and similarities of the surface polarity and surface roughness of the four surfaces investigated in this work. An initial quantitative immunolabeling study further identified significant differences in the activation of Rho GTPases. Astrocytes cultured on nanofibrillar scaffolds showed a response that included stellation, cell–cell interactions by stellate processes, and evidence of depression of RhoA. The astrocyte response to the nanofibrillar scaffolds was unique among four surfaces studied. The results support the hypothesis that the extra-cellular environment can trigger preferential activation of members of the Rho GTPase family with demonstrable morphological consequences for cerebral cortical astrocytes, and suggest that the large-scale component of the nanofibrillar scaffold surface roughness (a form of nanopatterning) is a possible environmental trigger.
Acknowledgements
The support of National Science Foundation grants PHY-0957776 (VMA and VMT) and ARRA-CBET-0846328 (DIS and IA), the Michigan-Louis Stokes Alliance for Minority Participation Summer Undergraduate Research Academy (AAK), the General Directorate for Higher Education, Ministry of National Education of the Republic of Turkey (VMT), and the New Jersey Commission on Spinal Cord Research Grants 06A-007-SCR1and 06-3058-SCR-E-O (SM) are gratefully acknowledged. The authors thank Dr Melinda Frame (Michigan State University USA) for valuable discussions about colocalization and quantitative immunolabeling analysis, Lars Haubold (Fraunhofer USA) for assistance in contact angle measurements, and Katerina Moloni (nPoint Inc) for assistance in closed-loop multimode AFM investigation.
Disclosure
The authors report no conflicts of interest in this work.
References
- Delgado-RiveraRHarrisSLAhmedIIncreased FGF-2 secretion and ability to support neurite outgrowth by astrocytes cultured on polyamide nanofibrillar matricesMatrix Biol20092813714719243701
- GeorgesPCMillerWJMeaneyDFMatrices with compliance comparable to that of brain tissue select neuronal over glial growth in mixed cortical culturesBiophys J2006903012301816461391
- MeinersSAhmedIPoneryASEngineering electrospun nanofibrillar surfaces for spinal cord repair: a discussionPolymer Int20075613401348
- MeinersSHarrisSLDelgado-RiveraRNanofibers: fabrication, performance, and applicationsChangWNHauppaugeNova Science Publishers Inc2009327343
- McKeonRJSchreiberRCRudgeJSReduction of neurite outgrowth in a Model of Glial Scarring following CNS injury is correlated with the expression of inhibitory molecules on reactive astrocytesJ Neurosci199111339834111719160
- TangXDaviesJEDaviesSJAChanges in distribution, cell associations, and protein expression levels of NG2, neurocan, phosphacan, brevican, versican V2, and tenascin-C during acute to chronic maturation of spinal cord scar tissueJ Neurosci Res20037142744412526031
- BiranRNobleMDTrescoPACharacterization of cortical astrocytes on materials of differing surface chemistryJ Biomed Mater Res19994615015910379992
- PatelKRTangHGreverWEEvaluation of polymer and self-assembled monolayer-coated silicone surfaces to reduce neural cell growthBiomaterials2006271519152616174526
- TonazziniIBystrenovaEChelliBMultiscale morphology of organic semiconductor thin films controls the adhesion and viability of human neural cellsBiophys J2010982804281220550892
- NobesCDHallARho, Rac, and Cdc42 GTPases regulate the assembly of multimolecular focal complexes associated with actin stress fibers, lamellipodia, and filopodiaCell199581153627536630
- BiyashevaASvitkinaTKundaPCascade pathway of filopodia formation downstream of SCARJ Cell Sci200411783784814762109
- RacchettiGD’AlessandroRMeldolesiJAstrocyte stellation, a process dependent on Rac1 is sustained by the regulated exocytosis of enlargeosomesGlia201160346547522144092
- AhmedILiuH-YMamiyaPCThree-dimensional nanofibrillar surfaces covalently modified with tenascin-C-derived peptides enhance neuronal growth in vitroJ Biomed Mater Res A20067685186016345089
- ChungHYHalJRBGoginsMADonaldson Company, Inc, assigneePolymer, polymer microfiber, polymer nanofiber and applications including filter structures US patent US 6743273 B2; June 1, 2004.
- SpatzCBasic Statistics: Tales of Distributions10th edBelmontWadsworth Cengage Learning2011
- TiryakiVMKhanAAAyresVMAFM feature definition for neural cells on nanofibrillar tissue scaffoldsScanning5142012 [Epub ahead of print.]
- Davis-CoxMITurnerJNSzarowskiDPhorbol ester-stimulated stellation in primary cultures of astrocytes from different brain regionsMicrosc Res Tech1994293193277841503
- AyresVMChenQFanYScanning probe recognition microscopy investigation of neural cell prosthetic propertiesInt J Nanomanufacturing20106279290
- FanYChenQAyresVMScanning probe recognition microscopy investigation of tissue scaffold propertiesInt J Nanomedicine20072465166118203431
- BolteSCordelièresFPA guided tour into subcellular colocalization analysis in light microscopyJ Microsc200622421323217210054
- KasaIA curve fitting procedure and its error analysisIEEE Trans Inst Meas197625814
- PetroskiREGriersonJPChoi-KwonSBasic fibroblast growth factor regulates the ability of astrocytes to support hypothalamic neuronal survival in vitroDev Biol199114711131879603
- RidleyAJPatersonHFJohnstonCLThe small GTP-binding protein Rac regulates growth factor-induced membrane rufflingCell1992704014101643658
- JonesKJKorbEKundelMACPEB1 regulates beta-catenin mRNA translation and cell migration in astrocytesGlia200856131401141318618654
- Etienne-MannevilleSHallARho GTPases in cell biologyNature200242062963512478284
- BishopALHallARho GTPases and their effector proteinsBiochem J200034824125510816416
- RidleyAJHallAThe small GTP-binding protein Rho regulates the assembly of focal adhesions and actin stress fibers in response to growth factorsCell1992703893991643657
- KalmanDGompertsSNHardySRas family GTPases control growth of astrocyte processesMol Biol Cell1999101665168310233170
- SchneiderCARasbandWSEliceiriKWNIH Image to ImageJ: 25 years of image analysisNature Methods20129671675
- AbeKMisawaMAstrocyte stellation induced by Rho kinase inhibitors in cultureBrain Res Dev Brain Res200314399104
- HallARho GTPases and the actin cytoskeletonScience19982795095149438836
- CookGMWGlycoproteins in membranesBiol Rev1968433633914920213
- FinkelsteinEIChaoPGHungCTElectric field-induced polarization of charged cell surface proteins does not determine the direction of galvanotaxis, cell motility and the cytoskeleton200764833846
- SeilJTWebsterTJElectrically active nanomaterials as improved neural tissue regeneration scaffoldsAdv Rev20102635647