Abstract
Background
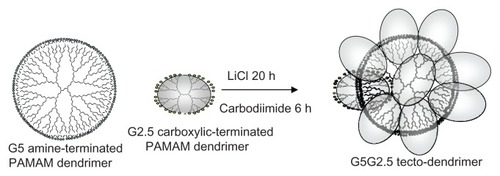
The controlled introduction of covalent linkages between dendrimer building blocks leads to polymers of higher architectural order known as tecto-dendrimers. Because of the few simple steps involved in their synthesis, tecto-dendrimers could expand the portfolio of structures beyond commercial dendrimers, due to the absence of synthetic drawbacks (large number of reaction steps, excessive monomer loading, and lengthy chromatographic separations) and structural constraints of high-generation dendrimers (reduction of good monodispersity and ideal dendritic construction due to de Gennes dense-packing phenomenon). However, the biomedical uses of tecto-dendrimers remain unexplored. In this work, after synthesizing saturated shell core–shell tecto-dendrimers using amine-terminated polyamidoamine (PAMAM) generation 5 (G5) as core and carboxyl-terminated PAMAM G2.5 as shell (G5G2.5 tecto-dendrimers), we surveyed for the first time the main features of their interaction with epithelial cells.
Methods
Structural characterization of G5G2.5 was performed by polyacrylamide gel electrophoresis, matrix-assisted laser desorption time-of-flight mass spectrometry, and microscopic techniques; their hydrodynamic size and Z-potential was also determined. Cellular uptake by human epidermal keratinocytes, colon adenocarcinoma, and epidermal melanoma (SK-Mel-28) cells was determined by flow cytometry. Cytotoxicity was determined by mitochondrial activity, lactate dehydrogenase release, glutathione depletion, and apoptosis/necrosis measurement.
Results
The resultant 60%–67% saturated shell, 87,000-dalton G5G2.5 (mean molecular weight) interacted with cells in a significantly different fashion in comparison to their building blocks and to its closest counterpart, PAMAM G6.5. After being actively taken up by epithelial cells, G5G2.5 caused cytotoxicity only on SK-Mel-28 cells, including depletion of intracellular glutathione and fast necrosis that was manifested above 5 μM G5G2.5. It cannot be discounted that traces of LiCl within G5G2.5 were involved in such deleterious effects.
Conclusion
These preliminary results suggest that at concentrations that do not damage healthy keratinocytes, G5G2.5 could display antimelanoma activity.
Introduction
Dendrimers were first described by Vögtle in 1978Citation1 as highly branched macromolecules of unique structural properties, such as controlled size, shape, surface chemistry, flexibility, and near unit polydispersity. Polyamidoamine (PAMAM) dendrimers were the first water-soluble and essentially nonimmunogenic complete family to be synthesized, characterized, and commercialized.Citation2 Toxicity of amine-terminated PAMAM dendrimers upon intravenous administration was formally screened in mice in 1996,Citation3 while the in vivo biodistribution of 125I-labelled PAMAM dendrimers in rats was determined in 2000.Citation4 These and further studiesCitation5 of toxicity revealed similar trends after oral and intravenous administration. In general, the toxicity of cationic dendrimers increases with generation and dose, and is less pronounced than that of their neutral or anionic counterparts.
In the last five years, interest in biomedical applications of dendrimers has steadily grown, although the synthesis and particular aspects of their structure remain challenging. Classically, dendrimers are synthesized by sequential steps, by divergentCitation2 or convergentCitation6 techniques. However, beyond generation 5 (G5), the de Gennes dense-packing phenomenon reduces good monodispersity and precludes ideal dendritic construction.Citation7,Citation8 In this condition, the surface becomes crowded with terminal functional groups, and the addition of further generations often results in incomplete conjugation, leading to imperfect structures. Only a narrow window between G4 and G6 is available for drug hosting. Conversely, the inner pockets of larger PAMAM dendrimers become less accessible, or smaller dendrimers are widely open so as to retain guest molecules.
In this context, megamer or dendrimer clusters could be suitable alternatives to reduce the drawbacks associated with the synthesis and structure of dendrimers. These new types of polymers are synthesized by covalent cross-linking between dendritic units.Citation9 Randomly assembled polymers can be prepared by bi- or tridimensional self-association, or by heat-induced covalent linkage.Citation10 These highly polydisperse dendri-macrocycles, -catenanes or -clefts are nonuniform in size and shape, and are not of biomedical interest because of their structural irregularities. On the other hand, controlled-structure polymers,Citation9,Citation11,Citation12 known as core–shell tecto-dendrimers, consist of a dendrimer core surrounded by a shell of lower-radii dendrimers. Depending on the synthesis method, partially filled or saturated shell structures can be obtained. The latter result from the combination of an amine-terminated core dendrimer with an excess of carboxylic acid–terminated, shell reagent dendrimer.Citation11 The two charge-differentiated species are allowed to equilibrate and self-assemble into the electrostatically driven core–shell tecto-dendrimer architecture, followed by covalent fixing of these charge-neutralized dendrimer contacts with carbodiimide reagents.
Uppuluri et alCitation11 showed that starting from PAMAM G5 as a core and a PAMAM G3 carboxylic acid terminated as shell, a high yield (ie, 90%) of a new polymer with intermediate size between a G7 and a G8 dendrimer and 75%–83% saturation degree can be obtained in a single step. Noteworthy is that the addition of three generations to a G5 core by the divergent method would require six reaction steps. Additionally, the divergent synthesis of larger dendrimer requires excessive monomer loading and lengthy chromatographic separations. In this context, tecto-dendrimers could expand the portfolio of high molecular weight (MW) controlled structures without experiencing the de Gennes congestion, while at the same time retaining a suitable capacity for drug hosting.
In this work, using PAMAM G5 (MW: 28826, 128 amine surface groups) as core and PAMAM G2.5 (MW: 6265, 32 carboxylic surface groups) as shell, saturated shell core–shell G5G2.5 tecto-dendrimers were prepared () and their interaction with epithelial cells was surveyed. By considering that 15 is the maximum number of shell dendrimers that ideally park around the core,Citation13 the theoretical MW of these tecto-dendrimers would be 122,000 daltons (Da). Besides, 240 carboxylic groups would be at the surface if we assume that half of the surface groups of each PAMAM G2.5 are exposed. It is expected therefore that these tecto-dendrimers possess a structure similar to a PAMAM G6.5 (MW: 106196) of 7–8 nm diameter. In comparison, the densely packed surface of G6.5 exposes 512 surface carboxylic groups.
Figure 1 Schema of G5G2.5 tecto-dendrimer synthesis.
Abbreviation: PAMAM, polyamidoamine.
The structural characterization of G5G2.5 was performed by polyacrylamide gel electrophoresis (PAGE), matrix-assisted laser desorption time-of-flight mass spectrometry (MALDI-TOF-MS) and microscopic techniques (transmission electron microscopy [TEM] and atomic force microscopy [AFM]). Besides, hydrodynamic size and Zeta potential was determined. Then, its cellular uptake by human epidermal keratinocytes (HaCaT cells), epithelial colon adenocarcinoma cells (Caco-2 cells), and epidermal melanoma cells (SK-Mel-28 cells) was determined by flow cytometry. Finally, cytotoxicity was determined by measuring mitochondrial activity and lactate dehydrogenase release; additionally, glutathione depletion and apoptosis/necrosis were measured.
Materials and methods
Materials
Ethylendiamine core PAMAM G5, G2.5, G3.5, G4.5, and G6.5 dendrimers were purchased from Sigma-Aldrich (St Louis, MO). LiCl, 1-(3-dimethylaminopropyl)-3-ethylcarbodiimide hydrochloride (EDC), fluorescein isothiocyanate isomer I (FITC), 3-(4,5-dimethylthiazole-2-yl)-2,5-diphenyltetrazolium bromide) (MTT), high-retention cellulose dialysis tubing, 5,5′-dithio-bis(2-nitrobenzoic acid) (DTNB), glutathione reductase from baker’s yeast (Saccharomyces cerevisiae), β-nicotinamide adenine dinucleotide 2′-phosphate reduced tetrasodium salt hydrate (NADPH), glutathione (GSH), propidium iodide, and Sephadex G-100 and G-25 were also purchased from Sigma-Aldrich. YO-PRO®-1 was from Molecular Probes, Life Technologies (Eugene, OR). Modified Eagle’s medium (MEM), sodium piruvate and l-glutamine were from Gibco, Life Technologies (Eugene, OR). Fetal bovine serum (FBS), trypsin-EDTA solution and antibiotic/antimycotic solution were obtained from PAA Laboratories (Pasching, Austria). 4-(2-Hydroxyethyl)-1-piperazineethane-sulfonic acid) (HEPES), tris-(hydroxymethyl) aminomethane (Tris) and N,N′-methylene-bis-acrylamide were purchased from ICN Biomedicals (Aurora, OH). The other reagents were analytic grade from Anedra, Research AG (Buenos Aires, Argentina).
Synthesis and characterization of G5G2.5
Synthesis and purification
G5G2.5 tecto-dendrimers were synthesized as described by Uppuluri et al.Citation11 Briefly, G5 in 23 mg/mL LiCl solution and G2.5 in MilliQ water were mixed at a 1:30, G5:G2.5 molar ratio. The mixture was allowed to equilibrate for 20 hours at room temperature. Subsequently, the linking reagent EDC (34 mg) was added to the reaction mixture. After 6 hours, the mixture was exhaustively purified by dialysis using a 12,400-Da cutoff cellulose membrane against 500 mL of deionized water for 2 days, replaced five times with fresh water. After that, the sample was subjected to size-exclusion chromatography (Sephadex G-100), eluting with 10 mM Tris-HCl pH 7.4 as mobile phase. Eluted fractions were collected, and samples of each fraction were run in 15% PAGE using TBE buffer (0.089 M Tris, 0.089 M boric acid, 2 mM EDTA) pH 8.3 at a constant voltage of 200 V. Gels were stained with 0.1% Coomassie brillant blue R-250 in 20% (v/v) methanol and 10% (v/v) acetic acid and destained in the same solution (without the dye) to visualize bands. Fractions showing a band of lower electrophoretic mobility than G2.5 and similar to G6.5 were collected, lyophilized, and stored at −20°C.
Additionally, G5G2.5 was analyzed by gradient 8%–30% PAGE (0.375 M Tris-HCl pH 8.9 and 0.1% [w/v] SDS). Lyophilized G5G2.5 was solubilized with sample buffer (31.25 mM Tris-HCl [pH 6.8], 2% [w/v] SDS, 10% [v/v] glycerol, 5% [v/v] 2-mercaptoethanol, and 0.001% [w/v] bromophenol blue), and electrophoresis was performed using an electrode buffer of 0.025 M Tris/0.192 glycine pH 8.3 containing 0.1% (w/v) SDS at constant voltage of 120 V. After electrophoresis, gels were stained with Coomassie brillant blue R-250 as stated above.
Molecular weight
Molecular weight of G5G2.5 was estimated by MALDI-TOFMS according to Uppuluri et al.Citation11 Briefly, 1 μL of G5G2.5 (~20 pmol) was mixed with matrix solution (50:50 v/v acetronitrile/water, containing 0.1% v/v trifluoracetic acid) and was spotted on the spectrometer plate, and the solvent was allowed to evaporate under ambient conditions. Afterwards, 1 μL of matrix consisting of 10 mg/mL 2,5-dihydroxybenzoic acid in matrix solution was spotted over the dry sample. Analysis was performed with a 4800 plus MALDI TOF/TOF mass spectrometer analyzer (AB Sciex, Framingham, MA) done in LANAIS-PRO (Laboratorio Nacional de Investigación y Servicios en Péptidos y Proteínas) operating in the linear positive mode. The value of the laser power was set at 5800.
Quantification
The yield of each batch was determined by densitometry using G6.5 as standard. Increasing amounts of G6.5 ranging from 0.5 to 8 μg and aliquots of G5G2.5 were loaded into 15% PAGE, run, and stained as stated before. Images were obtained and band intensity was determined by ImageJ software, (National Institutes of Health, Bethesda, MD). A plot of G6.5 mass in micrograms versus band intensity was fitted by linear regression.
Transmission electron microscopy
Aliquots of G5G2.5 were dropped on a standard carbon-coated cooper TEM grid and then air-dried at room temperature overnight. TEM images were obtained with a JEM 1011 (Jeol, New York, NY) electron microscope at 80 kV. Images were processed with ImageJ software.
Atomic force microscopy
Aliquots of G5G2.5 were mixed with 1 M MgCl2, and dropped on freshly cleaved mica surfaces. After 5 minutes, the excess of sample was removed; the mica was washed and dried with N2. Samples were examined with a NanoScope III multimode AFM (Digital Instruments, Santa Barbara, CA) using tapping mode. Silicon probe with a spring constant of 40 N/m, resonant frequency of 300 kHz, and a tip radius smaller than 10 nm were used for tapping scans (MPP-11100; Bruker, Camarillo, CA). Image analysis was performed with WSxM (Nanotec, Madrid, Spain) software.
Size and zeta potential
Size and zeta potential of polymers (G2.5, G5, G6.5, and G5G2.5) in Hank’s balanced salt solution (HBSS) and culture medium were determined by dynamic light scattering and phase analysis light scattering, respectively, using a Nanosizer (ZEN 3600; Malvern Instruments, Malvern, UK). Lyophilized G5G2.5 and dry aliquots of dendrimers were solubilized with HBSS or MEM prefiltered across 0.02 μm by mechanical agitation.
Lithium determination
Lithium was determined by ion-selective electrodes using an EasyLyte Na/K/Cl/Li analyzer (Medica, Newtonville, MA) and by inductively coupled plasma mass spectroscopy (ICP-MS) using an ELAN DRC-e system (PerkinElmer, Waltham, MA) equipped with a dynamic reaction cell for interference corrections.
Cell cultures
SK-Mel-28 cells, human melanoma cells (ATCC, HTB-72), were obtained from Asociación Banco Argentino de Células. HaCaT cells, immortalized human nontumorigenic keratinocites, were kindly provided by Dr Edgardo Salvatierra, Instituto Leloir, Argentina. Caco-2 cells, human colonic adenocarcinoma cells, were kindly donated by Dr Osvaldo Zabal, INTA Castelar, Argentina.
Cells were routinely culture in MEM supplemented with 10% (v/v) FBS, 1% (v/v) antibiotic/antimycotic solution and 2 mM glutamine, at 37°C in 5% CO2 and 95% humidity. Caco-2 cells were cultured in the same conditions, except that the culture medium was also supplemented with 1 mM sodium piruvate.
Kinetics of cellular uptake
Kinetics of uptake of G2.5, G6.5, and G5G2.5 by HaCaT, Caco-2, and SK-Mel-28 cells were determined by flow cytometry. To that aim, polymers were labeled with FITC, as described by Kitchens et al.Citation14 Briefly, polymer solutions were treated with a threefold molar excess of EDC and incubated for 30 minutes. Then, three times molar excess of ethylene diamine was added to the mixture and incubated for 4 hours. FITC (5 mg/mL) was dissolved in acetone and slowly added to this solution at a 1:20 molar ratio, followed by incubation at room temperature for 24 hours in the dark. The FITC-labeled polymers were then separated from free FITC by size-exclusion chromatography on a Sephadex-G25 column. The presence of polymers in the void volume was confirmed by 15% PAGE, as stated before. The absence of free FITC in the conjugates was verified by thin-layer chromatography, using chloroform and methanol (1:1) as solvents.Citation15 The extent of FITC conjugation was determined by measuring the absorbance of labeled polymers at 492 nm using a UV-visible spectrophotometer (UV-1603; Shimadzu, Kyoto, Japan). Number of moles of FITC conjugated per polymer was calculated using FITC calibration curve in Tris-HCl buffer.
Cells were seeded at a density of 3.0 × 10⁵ cells/well in 6-well plates and grown to reach 70%–80% of confluence. Subsequently, the medium was replaced with 1.5 mL of fresh medium containing around 7 μM of each FITC-labeled polymer, and the cells were incubated for 0.5, 1, 3, and 5 hours at 37°C. After each incubation period, the medium was removed; the cells were washed with phosphate-buffered saline (PBS, pH 7.4), and harvested by trypsinization. The fluorescence of the noninternalized polymers attached to the plasma membrane was quenched by 10-minute incubation with 0.2% v/v trypan blue in PBS. After washing with PBS, a total of 10,000 cells were analyzed by flow cytometry (FACSCalibur; Becton Dickinson, San Jose, CA). Data were analyzed using WinMDI 2.9 (Microsoft, Redmond, WA) software.
Additionally, cells grown on 6-well plates as previously stated were preincubated for 1 hour at 4°C prior to addition of the FITC-labeled polymers. The cells were then incubated for 5 hours at 4°C and processed for flow cytometry.
Cytotoxicity
Cell viability upon treatment with polymers was measured by MTT assay and lactate dehydrogenase (LDH) leakage in culture supernatants. Cells were seeded at a density of 4 × 10⁴ cells/well in 96-well plates and allowed to attach overnight. The medium was then replaced with fresh medium with 5% FBS containing increasing concentrations from 15 to 150 μM of G2.5 G6.5 from 50 to 150 μM or from 5 to 50 μM of G5G2.5 and cells were incubated at 37°C in a 5% CO2 humidified incubator. After 24 hours, the supernatants were transferred to fresh tubes, centrifuged at 250 × g for 4 minutes, and the LDH content was measured using a CytoTox LDH kit (Promega, Madison, WI). Percent of LDH leakage was expressed relative to treatment with Triton X-100. Cells attached to plates were processed for MTT assay. A 0.45-mg/mL MTT solution was added and incubated for 3 hours. The solution was then removed, the insoluble formazan crystals were dissolved with dimethylsulfoxide, and absorbance was measured at 570 nm using a microplate reader. Cell viability was expressed as a percentage of the viability of cells grown in medium. The same was performed to assess toxicity of LiCl at 50 and 500 mM on Sk-Mel-28 cells.
Determination of intracellular glutathione
Determination of Sk-Mel-28 intracellular GSH upon polymer treatment was based on a modification of the Tietze recycling method,Citation16 where the amount of measured GSH represents the sum of reduced and oxidized glutathione in the sample.
Cells were seeded at a density of 2 × 10⁵ cells/well in 24-well plates and allowed to attach overnight. The medium was then replaced with fresh medium with 10% FBS containing increasing concentrations from 15 to 150 μM of G2.5 G6.5 from 50 to 150 μM or from 5 to 50 μM of G5G2.5 and cells were incubated at 37°C in a 5% CO2 humidified incubator. After 12 hours of exposure, the media were removed and cells were washed with PBS and collected into Eppendorf tubes by trypsin treatment. Then trypsin was inactivated, cells were washed twice with PBS by centrifugation (1000 × g for 5 minutes at 4°C) and suspended in 1 mL of ice-cold extraction buffer (0.1% Triton-X and 0.6% sulfosalicylic acid in 0.1 M potassium phosphate buffer with 5 mM EDTA disodium salt, pH 7.5 [KPE]). Cells were lysed by sonication in icy water for 2–3 minutes and vortexing every 30 seconds, followed by freeze at −80°C and defrosted on ice twice; finally, cellular debris was removed by centrifugation (3000 × g for 4 minutes at 4°C). Aliquots (20 μL) of supernatants were transferred to 96-well plates for GSH determination. Then 120 μL of reaction mixture (4.2 mM DTNB and 1.0 U/mL GSH reductase in KPE) was added to each well, and after 30 seconds for conversion of GSSG to GSH, 60 μL of 0.24-mM β-NADPH in KPE was added. The rate of 2-nitro-5-thiobenzoic acid (TNB) formation (ΔAbs/minute) was calculated by immediate readings of the absorbance at 412 nm taken every 30 seconds for 2 minutes in a microplate reader (tc MRX; Dynex Technologies, Chantilly, VA). The rate of TNB formation was linearly proportional to the total concentration of GSH in the sample. A regression curve was generated using GSH as standard from 50 to 0.8 μM. Total GSH concentration in the sample was expressed as nM GSH/μg protein, for which total proteins in each cellular pellet was measured by Bradford assayCitation17 using bovine serum albumin as standard.
Apoptosis/necrosis assay
Apoptotic and necrotic Sk-Mel-28 cells upon polymer treatment were identified by a double staining with YO-PRO®-1 and propidium iodide (PI) by flow cytometry. This assay detects changes in cell membrane permeability with YOPRO ®-1 dye, a green-fluorescent nucleic acid stain that is permeant to apoptotic cells but not to live cells. Necrotic cells are labeled with red fluorescent PI.
Cells were seeded at a density of 3 × 10⁵ cells/well in 6-well plates and allowed to grow for 24 hours. The medium was then replaced with fresh medium with 10% FBS containing 50 μM G6.5 or 5 and 10 μM G5G2.5, and cells were incubated at 37°C in a 5% CO2 humidified incubator. After 3 and 7 hours of exposure, the media were removed and cells were washed with PBS and collected into Eppendorf tubes by trypsin treatment. Then trypsin was inactivated, cells were washed twice with PBS by centrifugation (1000 × g for 5 minutes at 4°C), and cell density was adjusted to ~1 × 10⁶ cells/mL in PBS. The cells were incubated with 1 μL of YO-PRO®-1 100 μM for 15 minutes and 1 μL of PI 0.01 mg/mL for 2 minutes. The stained cells were analyzed within 1 hour by flow cytometry (FACSCalibur), using 488 nm excitation with green fluorescence emission for YO-PRO®-1 (530 nm FL1) and red fluorescence emission for PI (>575 nm, FL3). A total of 10,000 cells were analyzed, and data were analyzed using WinMDI 2.9 software.
Statistical analysis
Statistical analyses were performed by one-way ANOVA, followed by Dunnett test using Prisma 4.00 software (Graphpad Software, San Diego, CA). Significance levels are shown in figure legends.
Results and discussion
Synthesis and characterization of G5G2.5
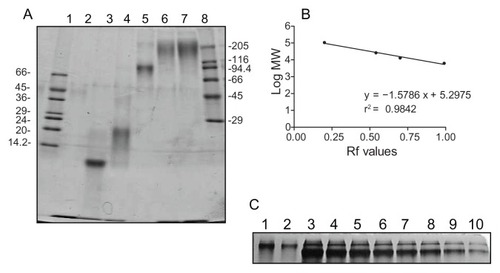
Gradient PAGE analysis performed at normal polarity of a sample representative of a minimum of nine batches showed that G5G2.5 run as a diffuse band of lower relative mobility than the band of G6.5 (MW 106196 Da) (). G5G2.5 was accompanied by residual free G2.5 shell dendrimers. A second PAGE performed at reversed polarity showed the absence of residual G5 core. The yield of each synthetic batch was determined by PAGE densitometry employing G6.5 as standard, resulting a mean mass of 3 ± 0.7 mg ().
Figure 2 (A) Gradient (8%–30%) PAGE analysis of G5G2.5 (lanes 6 and 7) compared with PAMAM G2.5, G3.5, G4.5 and G6.5, lanes 2 to 5, respectively. Low and high molecular mass markers are represented in lanes 1 and 8, respectively and indicated in kilodaltons (kDa). (B) Linear regression analysis of the log of MW of dendrimers used as markers (G2.5–G6.5) versus relative mobility (Rf) was used to determine G5G2.5 MW. (C) Mass of G5G2.5 (lanes 1 and 2) was determined by PAGE densitometry employing the mass of G6.5 (8–0.5 μg, lanes 3–10, respectively) as standard. Each G6.5 band contained a dimer band.
Abbreviations: PAGE, polyacrylamide gel electrophoresis; PAMAM, polyamidoamine; MW, molecular weight.
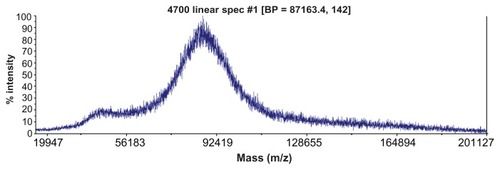
The MW of G5G2.5 was estimated by MALDI-TOF-MS. The spectra of at least three independent batches indicated a molecular weight peak at ~87,000 Da (), with an MW distribution between 75,000 and 96,000 Da. The peak at ~43000 Da can be assigned to a doubly charged ion of G5G2.5. Similar spectra were obtained by Uppuluri et alCitation11 employing PAMAM G5 as core and PAMAM G3-carboxylic acid terminated as shell.
Figure 3 Typical matrix-assisted laser desorption time-of-flight mass spectrum of G5G2.5 tecto-dendrimers.
Abbreviation: BP, base peak.
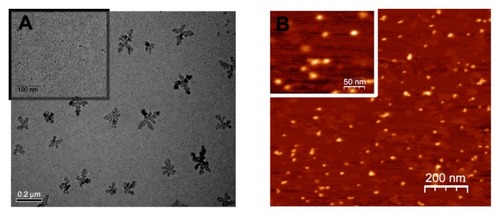
Typical TEM (A) and AFM (B) images of G5G2.5 are shown in . TEM images showed fractal structured aggregates and spherical structures with an average diameter of 7.20 ± 2.06 nm (calculated by measuring more than 80 particles in random TEM fields; inset). Previous studies revealed the existence of fractal structures similar to those found by us, when an excess of anionic PAMAM G3.5 is combined with cationic PAMAM G4 in the presence of LiCl.Citation18 AFM images, on the other hand, showed ellipsoidal structures of 17.9 ± 4.9 nm mean diameter and 1.1 ± 0.2 nm height (calculated by measuring nearly 20 molecules per field on five independent fields). It was previously observed that dendrimer diameters measured by AFM are much larger than those predicted by theoretical calculations, a fact that suggests that dendrimers “spread out” and flatten on the mica surface forming a semispherical dome.Citation19 The molecular volume (V) of G5G2.5 was therefore calculated employing the following equation: V = 1/6πh(h2 + ¾ d2),Citation12 where h is the measured height and d is the measured diameter of each G5G2.5. Assuming that G5G2.5 possesses the same density of 1.230 g/cm3 as a dendrimer of close MW,Citation20 the MW of G5G2.5 as estimated by this independent method was 106,000 Da with standard deviation of 36,000.
Figure 4 Transmission electron microscopy (A) and atomic force microscopy (B) of G5G2.5.
The hydrodynamic size and Z-potential of G5G2.5, G2.5, G5, and G6.5 in different media are shown in . Hydrodynamic diameter of G5G2.5 was around 11 nm both in HBSS and in culture media (MEM). This size was larger than that of its precursors G2.5 and G5 and in the order of that of G6.5. On the other hand, the Z-potential of G5G2.5, G2.5, and G6.5 in HBSS was slightly negative (−4 to −9 mV), while as expected that of G5 dendrimer was positive (5.4 mV). The Z-potential of G5G2.5 and G6.5 decreased in culture media to −16.6 and −13.5 mV, respectively, while that of G2.5 remained slightly negative (−3.3 mV).
Table 1 Size and Z-potential of G2.5, G5, G6.5, and G5G2.5 in different media
Gradient PAGE analysis was also used to estimate the MW of G5G2.5, by extrapolating the relative mobility of G5G2.5 in a plot of log MW dendrimers (G2.5–G6.5) versus relative mobility (). However, by this technique, the estimated MW of G5G2.5 was ~130000 Da, nearly 50% higher than the value determined by MALDI-TOF-MS. This can be attributed to the fact that PAGE is not an accurate technique for determining MW of polymers other than globular proteins. For instance, highly branched PAMAM dendrimers with nearly spherical shapes display more compact structures and migrate faster than globular protein standards with the same molecular mass.Citation21 In our gradient PAGE, the MW of dendrimers was underestimated (eg, 97,000, 20,600, and 11,000 Da, instead of 106,000, 26,258, and 12,900 Da for G6.5 G4.5, and G3.5, respectively). On the contrary, the open shell made of G2.5 ellipsoids around G5G2.5 would constitute a less compact structure of less congested surface than that of G6.5. This could be the reason for the low relative mobility of G5G2.5 as compared to G6.5, thus resulting in an overestimation of its MW. Although tecto-dendrimers are expected to be relatively monodisperse, less so than their dendrimers building blocks,Citation9 a factor contributing to their structural heterogeneity could arise from the different parking positions of the ellipsoidal G2.5 around the G5 core. Linkages along the long axis would lead to a maximum number of dendrimers in the shell than if the linkage is made along the short axis.
Taken together, these results showed that G5G2.5 had a negatively charged surface, the same as carboxylic half-generation dendrimers, an electrophoretic mobility lower than that of G6.5, a hydrodynamic size larger than that of its precursors and close to that of G6.5, as well as a mean MW of 87,000 Da. Considering that each G5G2.5 consists of a single G5 core dendrimer, a mean of 9–10 G2.5 dendrimer shell would be surrounding the central core, which corresponds to a saturation level of 60%–67%. On the bases of this information, we screened the effects caused by G5G2.5 at 5, 15, and 50 μM on different epithelial cells in comparison to those caused by G2.5 at 15, 50, and 150 μM and G6.5 at 15 and 50 μM.
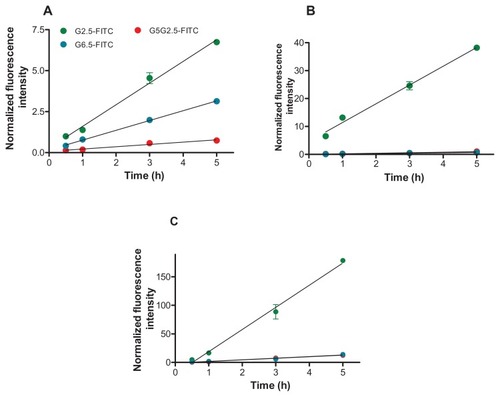
Cell uptake kinetics
First, the cellular uptake of FITC-labeled G2.5, G6.5, and G5G2.5 was followed for 5 hours. The quantification of the amount of FITC per polymer conjugate showed 0.4 FITC molecules per G2.5 molecule, 3.5 FITC molecules per G6.5 molecule, and 22 FITC molecules per G5G2.5 molecule. The amount of FITC per polymer was used to normalize its fluorescence intensity, in order to establish a comparison between the cell uptakes of conjugates.
As shown in , the uptake of polymers at 37°C by the three cell types followed a linear kinetics. A comparison of the curve slopes from normalized fluorescence intensity versus time plots showed that in general, polymers were taken up by Sk-Mel-28 cells at rates much faster than by HaCaT and Caco-2 cells (). The uptake extent was G2.5 >> G6.5 ~ G5G2.5 by the three cell types, except that the uptake of G6.5 by HaCaT cells was nearly fourfold higher than that of G5G2.5. The uptake extent at 4°C was reduced from 15% to 5% the value at 37°C in all cells, suggesting the involvement of an energy-dependent process.
Table 2 Linear-fit parameters of polymer-cell uptake versus time
Figure 5 Uptake of G2.5-fluorescein isothiocyanate (FITC), G6.5-FITC, and G5G2.5-FITC by HaCaT (A), Caco-2 (B), and SK-Mel-28 cells (C) at 37°C as a function of time.
Cytotoxicity
The effect of G2.5G5 on the viability of the three cell types was determined by measuring the mitochondrial activity by the MTT assay and the cell membrane damage by leakage of cytosolic LDH.
The absent or low cytotoxicity of carboxylic half-generation dendrimers has previously been reported by several authors.Citation3,Citation4,Citation22 PAMAM G2.5, G3.5, and G4.5 have been shown to be toxic only at high concentration of 10 mM on Caco-2 cells,Citation23–Citation25 whereas G6.5 was not cytotoxic up to 100 μM on human ovarian carcinoma cell line A2780.Citation26 Similarly, we found that the viability of HaCaT, Caco-2, and Sk-Mel-28 cells as determined by MTT () and by LDH () assays were not modified after 24 hours of incubation with G2.5 or G6.5 up to 150 and 50 μM, respectively. However, while the viability of Caco-2 and HaCaT cells was not affected by G2.5G5, that of Sk-Mel-28 cells was decreased in a dose-dependent fashion (). Indeed, doses of 5, 15, and 50 μM G2.5G5 reduced to 60%, 30%, and 20% the cell viability by MTT and released 50%, 90%, and 100% of the cell LDH into the extracellular fluid, respectively. A linear correlation was observed between the toxicity determined by MTT and LDH release. The inhibitory concentration (IC50) of G5G2.5 on Sk-Mel-28 cells derived from the dose-response curve was 7.5 μM. The lack of toxicity of G5G2.5 on Caco-2 and HaCaT cells was not a surprising result, but their selective toxicity on Sk-Mel-28 cells was.
Figure 6 Cytotoxicity of G2.5, G6.5, and G5G2.5 on HaCaT cells (A and B), Caco-2 cells (C and D), and SK-Mel-28 cells (E and F), determined by 3-(4,5-dimethylthiazole-2-yl)-2,5-diphenyltetrazolium bromide (A, C and E) and lactate dehydrogenase (LDH) leakage (B, D and E).
Notes: Bars represent means ± standard deviations (n = 6). *P < 0.01.
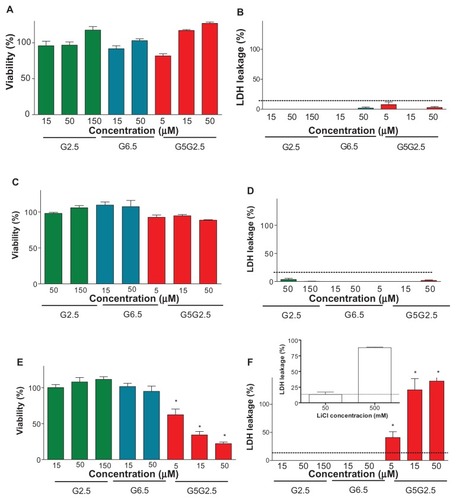
On the other hand, LiCl at 5–20 mM is known to inhibit the growth of human melanoma cells and also to induce a growth delay of inoculated melanoma tumours in syngeneic mice.Citation27 Moreover, it was recently shown that in different cell types (osteosarcoma, colon carcinoma, fibroblasts, HeLa, and HaCaT cells), LiCl induces the release of TNF-α to the extracellular space, where it binds to cells’ death receptors and induces apoptosis at an IC50 between 10 and 60 mM.Citation28 Here, the synthesis of G5G2.5 was carried out at 330 mM. The presence of LiCl was required in order to avoid bimodal or trimodal product mass distributions due to clustering of the amine-terminated core reagent into various domain sizes instead of monodispersed products.Citation11 With the aim of determining if the selective toxicity of G5G2.5 could be due to residual LiCl, the amount of lithium in purified G5G2.5 was quantified employing ion-selective electrode and also by ICP-MS. By the first method, the absence of lithum was recorded, meaning that the lithium amount was below the detection limits (0.5 mM) or that lithium was included within the polymer pockets, resulting in it being inaccessible to the electrode. The second method detected lithium at 8.5 μg/L (1.21 μM) after the sample was vaporized, broken down into atoms, and ionized by plasma at extreme temperature. Data extrapolated from a known mass amount of G5G2.5 revealed that nearly 1.13 μmol LiCl remained associated per 1 μmol G5G2.5. Finally, we determined that after 24-hour incubation with 500 and 50 mM LiCl, 90% and 12% of LDH was released from Sk-Mel-28 cells, respectively (, inset). Hence, while 50 mM LiCl was a nontoxic concentration, the amount of lithium associated with 50 μM G5G2.5 that was strongly cytotoxic was 56.5 μM, 1000-fold lower. We could speculate therefore that the toxicity of G5G2.5 on SK-Mel-28 cells was not due to the LiCl. However, it cannot be discounted that the uptake of G5G2.5 could increase the cytotoxicity of lithium traces that remained associated with the polymer structure if the intracellular pathway followed by lithium was modified.
Intracellular GSH determination
Reactive oxygen species (ROS), including hydrogen peroxide (H2O2), superoxide (O2−) and hydroxyl radical (HO) are short-lived molecules capable of causing oxidative damage to DNA, lipids, and proteins. Oxidative stress is a state of redox disequilibrium in which ROS production overwhelms the antioxidant defense capacity of the cell, thereby leading to adverse biological consequences. Among different ROS scavengers, GSH, GSH S-transferase, and glutathione GSH reductase, the GSH-dependent system is of great importance. Citation29 The depletion of intracellular levels of GSH as a consequence of ROS generation, proinflammatory effects and cell apoptosis are well-known mechanisms of cytotoxicity mediated by nanoparticles.Citation30,Citation31
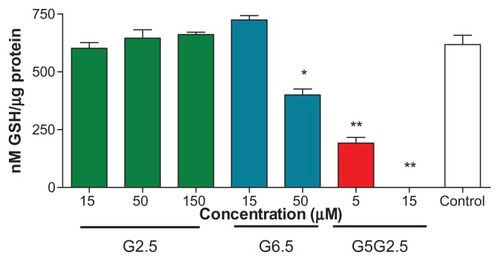
Recent studies have shown that PAMAM G4, G5, and G6 dendrimers induce oxidative stress by producing ROSCitation32 and therefore a cytotoxic response in HaCaT cells, primary adenocarcinoma cells (SW480 cells), and murine macrophages (J774 cells).Citation33,Citation34 The cationic surface amine groups play a direct role in the production of ROS. Cationic nanoparticles have been shown to localize in mitochondria, generating ROS and producing a cytotoxic response via the mitochondrial injury pathway.Citation32,Citation35,Citation36 However, anionic dendrimers have not been found as responsible for the generation of ROS. In view of the unexpected deleterious effects caused by G5G2.5 on Sk-Mel-28 cells, we investigated if such cytotoxicity could be related to a depletion of intracellular GSH. To that end, Sk-Mel-28 cells were incubated for 12 hours with G5G2.5 at 5 and 15 μM (two concentrations below and above the IC50, respectively). Controls with 15 μM G2.5 and G6.5 showed that the intracellular GSH level was not modified; a slight decrease of GSH level (25%) was produced by 50 μM G6.5. However, G5G2.5 at 5 and 15 μM caused a significant (75% and 100%, respectively) decrease of intracellular GSH (). These results led us to conclude that after 12 hours and even at concentrations below the IC50, the G5G2.5 was responsible for consuming the intracellular GSH. Melanoma cells have a poor ability to cope with the oxidative stress,Citation37–Citation39 a fact that may be attributed to constitutive abnormalities in their melanosomes. The natural intracellular GSH level of SK-Mel-28 cells is ~80–100 nmol/mg protein, whereas that of HaCaT cells is 7300 nmol/mg protein.Citation40 Therefore, probably the low basal level of intracellular GSH in SK-Mel-28 cells was a reason for their susceptibility to GSH depletion caused by G5G2.5.
Figure 7 Intracellular glutathione (GSH) measurement on Sk-Mel-28 cells 12 h after G2.5, G6.5, and G5G2.5 treatments.
Notes: Bars represent means ± standard deviations (n = 6). *P < 0.05; **P < 0.01.
Apoptosis assay
Mitochondria are both the source and target of ROS, and they are responsible for producing cellular energy. Apoptotic activation of mitochondria leads to a disturbance of the mitochondrial membrane potential (MMP), permeability transition, ROS generation, and the release of apoptotic proteins.Citation41 Therefore, we finally determined whether the depletion of intracellular GSH was related to the triggering of apoptosis. The results showed that 50 μM G6.5 did not induce significant cell death, either upon 3 or 7 hours of incubation (). On the other hand, after 3 and 7 hours of incubation with 15 μM G5G2.5, only 46% and 37% cells remained viable, respectively, whereas the remaining 51% and 57% were in late apoptosis or necrosis (). In these conditions, there were no cells observed in early apoptosis. When G5G2.5 concentration was reduced below IC50 (5 μM), nearly 83% of cells remained viable, 12% of cells were in late apoptosis or necrosis, and only 5% of cells were in early apoptosis (). The percentage of early apoptotic cells was similar to the obtained after irradiating Sk-Mel-28 cells for 30 minutes with UV light.
Figure 8 Density plot diagrams of apoptosis/necrosis assay on SK-Mel-28 cells. (A) Control cells; (B and C) cells incubated with 50 μM G6.5 for 3 and 7 hours, respectively; (D and E) cells incubated with 5 μM G5G2.5, for 3 and 7 hours, respectively; (F and G) cells incubated with 15 μM G5G2.5 for 3 and 7 hours, respectively.
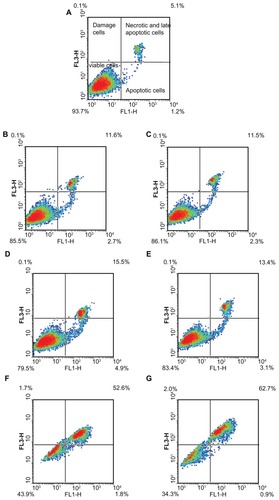
The cells were rapidly damaged, but the extent or nature of the damage did not progress between 3 and 7 hours. Moreover, even after 24 hours (MTT assay), the cell-death percentage was similar to that after 3 hours. At 5 μM G5G2.5, a small number of cells entered apoptosis, meanwhile 15 μM G5G2.5 induced substantial necrosis or late apoptosis that did not progress during 24 hours.
Therefore, the nature and extent of the damage induced by G5G2.5 at 5 μM on SK-Mel-28 cells was different to that caused at 15 μM. We observed that higher concentration but not longer incubations increased the percentage of nonviable cells, with a poor contribution of early apoptotic component (the current method impaired distinguishing between late apoptosis and necrosis).
Conclusion
Although the synthesis of tecto-dendrimers was reported more than 10 years ago, their effect on mammal cell has not been reported yet. The PAMAM G5 core and 60%–67% PAMAM G2.5 shell saturation tecto-dendrimers synthesized here behaved in a significantly different way to their building blocks, but also to their G6.5 counterpart. We found that G5G2.5 was avidly uptaken by SK-Mel-28 cells, a melanoma cell line that also showed a higher uptake of anionic dendrimers than the other epithelial (HaCaT) and enterocytic (Caco-2) cells. We also found that in spite of the purification process, small amounts of lithium remained associated within G5G2.5. Although the main finding of this work was that G5G2.5 caused a selective and concentration-dependent cytotoxicity on SK-Mel-28 cells, it cannot be discounted that such toxicity was related to changes in the intracellular pathway followed by lithium within G5G2.5, with respect to free lithium. Our data also showed that G5G2.5 cytotoxicity was related to a rapid depletion of intracellular levels of GSH. Although more detailed research is needed to reveal the role of structural architecture of tecto-dendrimers on its selective toxicity, these results suggest that G5G2.5 display an important antimelanoma activity.
Acknowledgments
This work was supported by the Secretaria de Investigaciones, Universidad Nacional de Quilmes, EULANEST project Nanoskin and CONICET. The authors are grateful to Dr T Creczynski-Pasa from Departamento de Ciências Farmacêuticas, Universidade Federal de Santa Catarina, Brazil, PROSUL project CNPq, for TEM and AFM analysis. PS has a fellowship from Consejo Nacional de Investigaciones Científicas y Técnicas, Argentina (CONICET). MJM, CMW, and ELR are members of the Carrera del Investigador Científico del CONICET.
Dislosure
The authors report no conflicts of interest in this work.
References
- BhuleierEWehnerWVögtleF“Cascade”- and “nonskid-chain-like” syntheses of molecular cavity topologiesSynthesis19782155158
- TomaliaDABakerHDewaldJA new class of polymers: starburst-dendritic macromoleculesPolym J198517117132
- RobertsJCBhalgatMKZeraRTPreliminary biological evaluation of polyamidoamine (PAMAM) Starburst dendrimersJ Biomed Mater Res199630153658788106
- MalikNWiwattanapatapeeRKlopschRDendrimers: relationship between structure and biocompatibility in vitro, and preliminary studies on the biodistribution of 125I-labelled polyamidoamine dendrimers in vivoJ Control Release2000651–213314810699277
- GreishKThiagarajanGHerdHSize and surface charge significantly influence the toxicity of silica and dendritic nanoparticlesNanotoxicology Epub July 28, 2011
- HawkerCJFréchetJMJPreparation of polymers with controlled molecular architecture. A new convergent approach to dendritic macromoleculesJ Am Chem Soc199011276387647
- Lothian-TomaliaMKHedstrandDMTomaliaDAPadiasABHallHKJrA contemporary survey of covalent connectivity and complexity. The divergent synthesis of poly(thioether) dendrimers. Amplified, genealogically directed synthesis leading to the de Gennes dense packed stateTetrahedron1997531549515513
- de GennesPGHervetHJStatistics of “starburst” polymersEurophys Lett198344351360
- TomaliaDAUppuluriSSwansonDRLiJDendrimers as reactive modules for the synthesis of new structure-controlled, higher-complexity megamersPure Appl Chem20007223432358
- TomaliaDAHedstrandDMWilsonLRDendritic polymersMarkHFBikalesNOverbergerCGMengesGEncylopedia of Polymer Science and EngineeringNew YorkWiley19904692
- UppuluriSPiehlerLTLiJSwansonDRHagnauerGLTomaliaDACore-shell tecto(dendrimers): I. Synthesis and characterization of saturated shell modelsAdv Mater200012796800
- LiJSwansonDRQinDCharacterizations of core−shell tecto-(dendrimer) molecules by tapping mode atomic force microscopyLangmuir19991573477350
- TomaliaDABrothersHM2ndPiehlerLTDurstHDSwansonDRPartial shell-filled core-shell tecto(dendrimers): a strategy to surface differentiated nano-clefts and cuspsProc Natl Acad Sci U S A20029985081508711943851
- KitchensKMKolhatkarRBSwaanPWEddingtonNWGhandehariHTransport of poly(amidoamine) dendrimers across caco-2 cell monolayers: influence of size, charge and fluorescent labelingPharm Res2006232818282617094034
- JevprasesphantRPennyJAttwoodDMcKeownNBD’EmanueleAEngineering of dendrimer surfaces to enhance transepithelial transport and reduce cytotoxicityPharm Res200320101543155014620505
- RahmanIKodeABiswasSKAssay for quantitative determination of glutathione and glutathione disulfide levels using enzymatic recycling methodNat Protoc2006163159316517406579
- BradfordMMA rapid and sensitive method for the quantitation of microgram quantities of protein utilizing the principle of protein-dye bindingAnal Biochem197672248254942051
- JasmineMAPrasadEFractal growth of PAMAM dendrimer aggregates and its impact on the intrinsic emission propertiesJ Phys Chem B20101147735774220496918
- LiJPiehlerLTQinDBakerJRJrTomaliaDAVisualization and characterization of poly(amidoamine) dendrimers by atomic force microscopyLangmuir20001656135616
- BetleyTABanaszak HollMMOrrBGSwansonDRTomaliaDABakerJJRTapping mode atomic force microscopy investigation of poly(amidoamine) dendrimers: effects of substrate and pH on dendrimer deformationLangmuir20011727682773
- ShiXPatriAKLesniakWAnalysis of poly(amidoamine)-succinamic acid dendrimers by slab-gel electrophoresis and capillary zone electrophoresisElectrophoresis2005262960296716007703
- BhadraDBhadraSJainSJainNKA PEGylated dendritic nanoparticulate carrier of fluorouracilInt J Pharm20032571–211112412711167
- JevprasesphantRPennyJJalalRAttwoodDMcKeownNBD’EmanueleAThe influence of surface modification on the cytotoxicity of PAMAM dendrimersInt J Pharm20032521–226326612550802
- El-SayedMGinskiMRhodesCGhandehariHTransepithelial transport of poly(amidoamine) dendrimers across Caco-2 cell monolayersJ Control Release200281335536512044574
- El-SayedMRhodesCAGinskiMGhandehariHTransport mechanism(s) of poly(amidoamine) dendrimers across Caco-2 cell monolayersInt J Pharm20032651–215115714522128
- KirkpatrickGJPlumbJASutcliffeOBFlintDJWheateNJEvaluation of anionic half generation 3.5–6.5 poly(amidoamine) dendrimers as delivery vehicles for the active component of the anticancer drug cisplatinJ Inorg Biochem201110591115112221704583
- NordenbergJPanetCWassermanLThe anti-proliferative effect of lithium chloride on melanoma cells and its reversion by myo-inositolBr J Cancer198755141463028460
- KaufmannLMarinescuGNazarenkoILiCl induces TNF-alpha and FasL production, thereby stimulating apoptosis in cancer cellsCell Commun Signal201191521609428
- MatesJMEffects of antioxidant enzymes in the molecular control of reactive oxygen species toxicologyToxicology20001531–38310411090949
- WangJZhouGChenCAcute toxicity and biodistribution of different sized titanium dioxide particles in mice after oral administrationToxicol Lett2007168217618517197136
- BrownDMDonaldsonKBormPJCalcium and ROS-mediated activation of transcription factors and TNF-alpha cytokine gene expression in macrophages exposed to ultrafine particlesAm J Physiol Lung Cell Mol Physiol20042862L34435314555462
- LeeJHChaKEKimMSNanosized polyamidoamine (PAMAM) dendrimer-induced apoptosis mediated by mitochondrial dysfunctionToxicol Lett2009190220220719643170
- NahaPCDavorenMLyngFMByrneHJReactive oxygen species (ROS) induced cytokine production and cytotoxicity of PAMAM dendrimers in J774 A.1 cellsToxicol Appl Pharmacol20102461–2919920420846
- MukherjeeSPLyngFMGarciaADavorenMByrneHJMechanistic studies of in vitro cytotoxicity of poly(amidoamine) dendrimers in mammalian cellsToxicol Appl Pharmacol2010248325926820736030
- XiaTKovochichMBrantJComparison of the abilities of ambient and manufactured nanoparticles to induce cellular toxicity according to an oxidative stress paradigmNano Lett2006681794180716895376
- XiaTKovochichMLiongMZinkJINelAECationic polystyrene nanosphere toxicity depends on cell-specific endocytic and mitochondrial injury pathwaysACS Nano200821859619206551
- MeyskensFLJrBuckmeierJAMcNultySETohidianNBActivation of nuclear factor-kappa B in human metastatic melanomacells and the effect of oxidative stressClin Cancer Res1999551197120210353757
- MeyskensFLJrFarmerPFruehaufJPRedox regulation in human melanocytes and melanomaPigment Cell Res200114314815411434561
- FarmerPJGidanianSShahandehBDi BilioAJTohidianNMeyskensFLJrMelanin as a target for melanoma chemotherapy: pro-oxidant effect of oxygen and metals on melanoma viabilityPigment Cell Res200316327327912753401
- SnowETSykoraPDurhamTRKleinCBArsenic, mode of action at biologically plausible low doses: what are the implications for low dose cancer risk?Toxicol Appl Pharmacol2005207Suppl 255756415996700
- SimonHUHaj-YehiaALevi-SchafferFRole of reactive oxygen species (ROS) in apoptosis inductionApoptosis2005541541811256882