
Abstract
Purpose
To evaluate the effects of anatase and rutile TiO2 nanoparticles (NPs) on the growth and development of bones in young rats and explore their possible mechanisms.
Methods
Three-week-old male rats were orally administered anatase TiO2 NPs and rutile TiO2 NPs for 28 days. The indicators of rat growth and development, liver function, bone metabolism, and insulin-like growth factor-1 (IGF-1) levels were evaluated. Micro-computed tomography (micro-CT) and immunohistochemistry were used to evaluate the tibia.
Results
No significant differences were observed among growth and development indicators in young rats. Significant differences were found in IGF-1 levels, phosphorus levels, and liver function. Micro-CT revealed osteoporosis in the bones. The micro-CT data supported the same result. Bone immunohistochemistry results showed that the expression of osteoprotegerin (OPG) was decreased and the expression of receptor activator of nuclear factor-κB ligand (RANKL) and cathepsin K (CTSK) was increased.
Conclusion
This study demonstrated that TiO2 NPs can damage bones via the IGF-1/OPG/RANKL/CTSK pathway in young rats. Furthermore, rutile TiO2 NPs damaged the bones more seriously than anatase TiO2 NPs.
Introduction
Titanium dioxide nanoparticles (referred to as TiO2 NPs hereafter) are widely used in various industries, such as food, medical products, white paint on toys, and personal care products.Citation1 In the food industry, TiO2 are used as a food additive to whiten the food, and 36% of them are TiO2 NPs (size<100 nm).Citation2 Thus, many foods were added TiO2 NPs, such as skimmed milk, candies, and powdered sugar toppings, all of which are consumed by children.Citation2,Citation3 With the continuous improvement in nanotechnology, the proportion of TiO2 NPs used in food industries and daily necessities will drastically increase.Citation4 A study estimated that children ingest approximately 1–2 mg/kg body weight of TiO2 NPs from various products every day.Citation3 Thus, children are the special population who consume the largest doses of TiO2 NPs daily.Citation3,Citation5
Researchers have previously believed that TiO2 NPs are inert and thus cannot be absorbed.Citation6 However, accumulating evidence shows that TiO2 NPs can be absorbed through different pathways.Citation7 As a colorant, TiO2 NPs have been classified as a category 2B carcinogen.Citation8 Moreover, the European Food Safety Authority (EFSA) argued that TiO2 NPs are unsafe for people.Citation9 Thus, the potential toxicity of TiO2 NPs to human health must be evaluated further. Previous studies found that TiO2 NPs can accumulate in liver, kidneys, and intestines, where they cause toxic damage.Citation10,Citation11 However, few studies have explored the effects of TiO2 NPs on bone tissue.
TiO2 NPs are divided into three crystal forms: brookite, anatase, and rutile. Hattori et alCitation12 argued that the crystal forms have a significant effect on the toxicity of TiO2 NPs. Anatase and rutile TiO2 NPs are the only commercially available crystal forms,Citation6 both of which have been approved for use in the food industry.Citation13 Anatase TiO2 NPs and rutile TiO2 NPs have different physical properties. Anatase TiO2 NPs are particles with high visible light reflection, low ultraviolet ray absorption capacity, and high photocatalytic activity, while rutile TiO2 NPs are particles with high hardness, density, dielectric constant, and refractive index.Citation14 Anatase TiO2 NPs are more widely used in food and other industries than rutile TiO2 NPs because the former are softer and less abrasive than the latter.Citation15 Anatase TiO2 NPs can cause more serious cell damage than rutile TiO2 NPs due to oxidative stress.Citation16 However, Numano et alCitation17 demonstrated that rutile TiO2 NPs are more toxic to the lungs of rats than anatase TiO2 NPs. Nevertheless, the issue of which TiO2 NPs are more toxic remains controversial. Additionally, only a few studies have explored the toxicity of anatase and rutile TiO2 NPs to bone tissue.
Bone growth is vital for children. Longitudinal bone growth is closely related to the children’s height. Bone mass is also an important factor in bone growth. Childhood is the most important period of bone accumulation, and the bone mass rapidly increases during the same.Citation18 Some studies have also demonstrated that environmental factors may affect bone mass and bone growth during childhood.Citation19 Xu et alCitation20 discovered that nanomaterials in the environment can damage the bone tissue of young rats. TiO2 NPs are more accessible to children than adults.Citation21 However, the toxicity of different crystal forms of TiO2 NPs, such as anatase and rutile, to bones, especially children, has not been evaluated yet.
In contrast to the past, people nowadays pay more attention to developmental delays and short stature. Children with short stature reportedly have low levels of insulin-like growth factor-1 (IGF-1).Citation22 IGF-1, which is secreted by the liver, is a vital growth factor that regulates the proliferation and differentiation of skeletal cells.Citation23 IGF-1 can affect bone mass and longitudinal growth in childhood.Citation24 Low IGF-1 levels cause shortened bone length and decreased bone mass, which in turn, causes shortened body length.Citation25 In the present study, we further explored whether different crystal forms of TiO2 NPs can influence IGF-1 levels and damage the bone growth of young rats. According to previous reports, the osteoprotegerin (OPG)/receptor activator of nuclear factor-κB ligand (RANKL)/cathepsin K (CTSK) pathway is closely related to bone damage.Citation26 Also, decreased IGF-1 levels can lead to a decline in OPG expression.Citation27 Thus, we inferred that bone growth may be related to the serum IGF-1 and the OPG/RANKL/CTSK pathway. Therefore, we focused on the effects of anatase and rutile TiO2 NPs on the bone growth of young rats and explored the possible mechanisms that may be related to the IGF-1/OPG/RANKL/CTSK pathway.
Materials and Methods
Preparation of TiO2 NPs
Anatase and rutile TiO2 NPs were purchased from the Aladdin Industrial Corporation (CAS 13463–67-7). TiO2 NPs were characterized by transmission electron microscopy (TEM, HT7800, HITACHI) and scanning electron microscopy (SEM, JSM6701F, US). The size distribution of the TiO2 NPs was determined using the Nano Measurer software (Version 1.2.0). Anatase and rutile TiO2 NPs were placed in ultra-pure water and then ultrasonicated for 30 min to prepare the suspensions.
Animal Studies
Pregnant Sprague–Dawley rats were purchased from the Experimental Animal Center of Nanchang University. All experimental procedures on animals were approved by the Animal Care Review Committee (approval number [2020] No. (A1001)), The Second Affiliated Hospital of Nanchang University, Jiangxi, China. The Guide for the Care and Use of Laboratory Animals published by the US National Institutes of Health, approved by the Animal Ethics Committee of Nanchang University, was followed in this study.
The offspring were breastfed after birth. Before weaning, 15 male young rats were randomly divided into three groups (n=5): control group, anatase TiO2 NP group, and rutile TiO2 NP group (groups exposed to anatase and rutile TiO2 NPs are collectively referred to as “exposure groups”). They were observed in a room at a constant temperature of 25 °C with a 12-hour light–dark cycle and access to sufficient water and food.
Experimental Design
Three-week-old rats were used as experimental subjects in this study. Weir et alCitation3 estimated that the maximum amount of TiO2 NPs that American children ingest every day is 2 mg/kg body weight. According to the human and laboratory animal drug dose exchange algorithm, the exposure dose of rats is 100 times that of humans.Citation28 Thus, 200 mg/kg was selected as the gavage dose for the rats in the exposure groups. The control group was treated with an equal volume of ultrapure water. After 28 days of exposure, young rats were anesthetized with diethyl ether. The eyeballs were quickly removed, and blood samples were collected from the eye vein. Serum samples were collected by centrifuging the blood, and the samples were stored at −80 °C. The tibia was fixed with a neutral tissue fixative.
Growth Evaluation
The growth and development of young rats was evaluated by measuring their weight every day. Body length (measured from the nose to the anus) was measured once every 2 weeks. On the 28th day of exposure, tibia length was measured after the rats were sacrificed. Body mass index (BMI) was calculated by dividing the rats’ body weight by the square of their body length (BMI = body weight/body length2).
Serum Biochemical Assay
Liver function was evaluated by detecting the levels of aspartate aminotransferase (AST), alanine aminotransferase (ALT), and alkaline phosphatase (ALP) in the serum using an automatic biochemical analyzer (Chemray 240). Bone turnover was analyzed by detecting serum calcium (Ca) and phosphorus (P) levels. The Ca/P ratios were also calculated.
Detection of IGF-1 Level in Serum
Serum IGF-1 levels were detected using an IGF-1 ELISA kit (Cusabio, CSB-E04582r) according to the manufacturer’s instructions.
Micro-Computed Tomography Evaluation of Bone Microstructure
Changes in the bone structure of young rats were evaluated using micro-computed tomography (Micro-CT). The tibias were scanned using a SkyScan 1076 device (SkyScan, Instrument SN 08E02048, Brooke, Belgium) at 40 kV and 250 μA. The original images obtained by scanning were rebuilt using the NRecon software (version 1.7.1.0). The reconstructed three-dimensional images were analyzed and processed using CT Analyzer software (version 1.17.7.2). Cortical and trabecular regions of interest (ROIs) were selected to analyze the morphological data of the tibias.
Morphological parameters of trabecular bone, including structure model index (SMI), bone surface area (BS, mm), bone volume fraction (BV/TV, %), bone surface area/bone volume (BS/BV, 1/mm), bone surface density (BS/TV, 1/mm), trabecular thickness (Tb.Th, mm), trabecular number (Tb.N, 1/mm), trabecular separation (Tb.Sp, mm), trabecular pattern factor (Tb.Pf, 1/mm), bone mineral density (BMD, g/cm3), and connectivity density (Conn.Dn, 1/mm3), were analyzed.
SMI and Tb.Pf are parameters that describe the ratio of plate-shaped to rod-shaped trabecular bone structures. When osteoporosis occurs, SMI and Tb.Pf increase, and the shape of the trabecular bone changes from plate to rod. BS and BV/TV are important indicators for evaluating changes in bone mass. A decrease in BS and BV/TV indicates that bone catabolism is greater than anabolism, and bone mass is reduced. Tb.Th, Tb.N, and Tb.Sp reflect the shape and structure of the trabecular bone. When bones have osteoporosis, Tb.Th and Tb.N decrease, whereas Tb.Sp increases. BS/BV represents the area of the bone tissue per unit volume. BS/TV can indirectly reflect the bone mass. Increased BS/BV or decreased BS/TV indicates bone mass reduction. BMD represents the bone strength of the ROI. When osteoporosis occurs, the BMD decreases. Conn.Dn is the number of connections between the trabecular meshwork structures per cubic millimeter volume. This decline means that the bone is destroyed.
Cortical bone morphology data included cross-sectional tissue area (T.Ar, mm2), cross-sectional bone area (B.Ar, mm2), cross-sectional tissue perimeter (T.Pm, mm), cross-sectional bone perimeter (B.Pm, mm), cross-sectional bone area/cross-sectional tissue area (B.Ar/T.Ar, %), and cortical thickness (Ct.Th, mm). These indicators can reflect the microstructural changes in the cortical bone structure. A decrease in cortical bone parameters indicates that the bone has been damaged.
Immunohistochemical Analysis of Bone Tissue
The tibia in the neutral fixative solution was removed and placed in 10% formic acid–formalin solution for decalcification. The decalcified tibia was longitudinally cut into two halves, embedded in paraffin, and sliced into thin slices. A ready-to-use pepsin repair solution was added to the tissues, and then the wet box containing the slides was placed in an oven at 37 °C for 20 min for antigen retrieval. Afterwards, the slides were placed in PBS solution (pH 7.4) and washed three times by shaking on a decolorizing shaker for 5 min each time. The slices were placed in a 3% hydrogen peroxide solution to block endogenous peroxidase, and then incubated for 25 min at room temperature in the dark. The decolorization process in the previous step was repeated. The slices were incubated with 3% BSA for 30 min at room temperature. Primary antibodies against OPG, RANKL, and CTSK were incubated with the slices overnight in a humid room at 4 °C. The slices were incubated with HRP-labeled secondary antibody at room temperature for 50 min and then stained with DAB. All slices were counterstained with hematoxylin for 3 min. Finally, the slices were dehydrated and sealed with neutral gum. Images of the slices were obtained using a light microscope (E100, Nikon). The percentage of positive staining in the entire field of view was quantified using the Image Pro Plus (version 6.0) software.
Statistical Analysis
Data were expressed as mean ± SD. One-way ANOVA was performed using the SPSS software (version 25.0). Differences were considered statistically significant at P<0.05.
Results
Characterization of TiO2 NPs
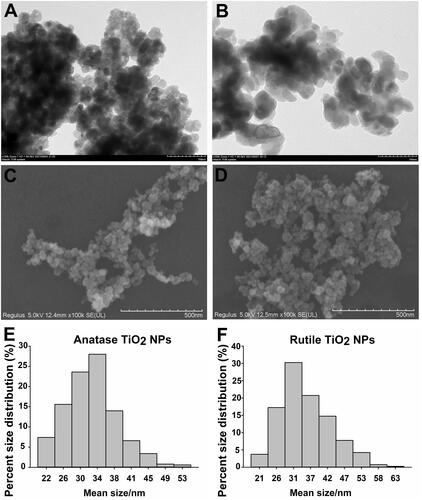
and show the anatase TiO2 NPs and rutile TiO2 NPs characterized by TEM, respectively. and show the anatase TiO2 NPs and rutile TiO2 NPs characterized by SEM, respectively. TEM indicated that anatase TiO2 NPs were composed of spherical particles, and rutile TiO2 NPs were composed of rod-shaped particles. The average diameter of anatase TiO2 NPs was 29.06 ± 5.43 nm (), whereas the average diameter of rutile TiO2 NPs was 32.00 ± 8.42 nm ().
Figure 1 Characterization of TiO2 NPs. (A) TEM image of anatase TiO2 NPs. (B) TEM image of rutile TiO2 NPs. (C) SEM image of anatase TiO2 NPs. (D) SEM image of rutile TiO2 NPs. (E) Percent size distribution of anatase TiO2 NPs. (F) Percent size distribution of rutile TiO2 NPs.
Analysis of Bone Growth and Development
No significant difference in the initial percent weight growth was observed among the groups (). During the exposure period, the difference in percent weight growth between the exposure and control groups was not statistically significant (P>0.05). The percent weight growth decreased in the exposure groups; the percent weight growth of the rats exposed to rutile TiO2 NPs was lower than that of rats exposed to anatase TiO2 NPs (P>0.05).
Figure 2 Growth characteristics. (A) Percent weight growth. (B) Body length. (C) BMI. (D) Tibia length.
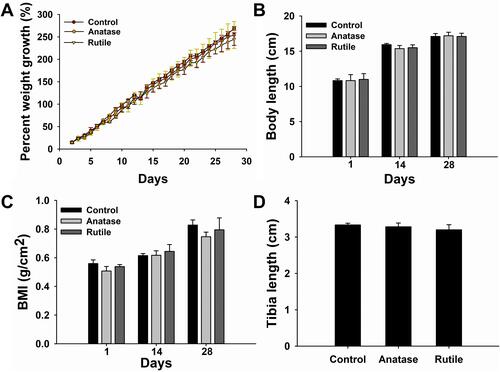
The difference in initial body length between the exposure and control groups was not statistically significant (P>0.05, ). On the 14th and 28th days of exposure, the body length decreased in the exposure groups, but the difference was not statistically significant (P>0.05). Moreover, the difference in BMI between the groups was not statistically significant (P>0.05, ). Tibia length in the exposure groups was shorter than that in the control group, but the difference was not statistically significant (P>0.05, ). Together, these results demonstrate that anatase and rutile TiO2 NPs did not influence the physical growth of young rats.
Biochemical Indicator in Serum
The levels of ALT, AST, and ALP were measured to evaluate liver function. The levels of ALT (P<0.05) and AST (P<0.01) increased in the group exposed to rutile TiO2 NPs compared to the control group (). Levels of ALT (P<0.05) and AST (P<0.01) were higher in the group exposed to rutile TiO2 NPs than in the anatase TiO2 NP group. The difference in ALP levels among the three groups was not statistically significant (P>0.05). These results indicated that TiO2 NPs can influence liver function. The toxicity of rutile TiO2 NPs is more serious than that of anatase TiO2 NPs.
Figure 3 Analysis of serum biochemical indicators. (A) Liver function. (B) Concentration of Ca and P. (C) Ratio of Ca/P in serum. (D) Concentration of IGF-1. *P<0.05, **P<0.01 compared with control.
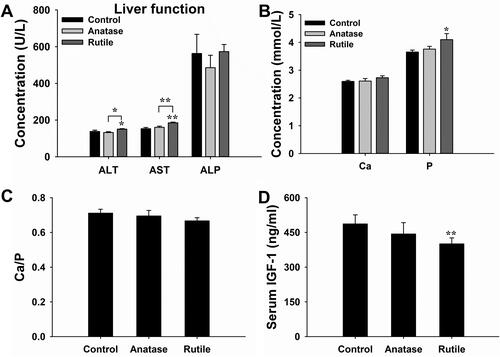
The effects of TiO2 NPs on bone metabolism were evaluated by measuring the levels of Ca and P in the serum. Ca levels increased in the exposure groups (P>0.05, ). The P levels were significantly higher in the group exposed to rutile TiO2 NPs than in the control group (P<0.05). Although P levels increased in the group exposed to anatase TiO2 NPs compared to the control group, there was no significant difference between them (P>0.05). The Ca/P ratio was not statistically significant in the exposure groups (P>0.05, ). These results do not suggest that TiO2 NPs can affect bone metabolism.
IGF-1 Levels in Serum
Serum IGF-1 levels were measured to explore whether anatase and rutile TiO2 NPs affect growth in young rats. IGF-1 levels significantly decreased in the rutile TiO2 NP group (P<0.01, ). However, the difference in IGF-1 levels between the group exposed to anatase TiO2 NPs and the control group was not significant (P>0.05). IGF-1 is an important indicator for evaluating bone growth.Citation25 Thus, these results demonstrate that rutile TiO2 NPs can affect the bone growth of young rats.
Observation of Bone Structure via Micro-CT
Micro-CT can be used to evaluate bone structure and morphology. Non-reconstructed images of the tibia are shown in . Three-dimensional images of the bones are shown in . , , , , and are the three-dimensional views of the tibia trabecula. , and show sagittal images of the tibia. , and show the cross sections of the tibia.
Figure 4 Non-reconstructed images of tibia. (A) Sagittal image of bone in the control group. (B) Sagittal image of bone in the anatase TiO2 NP group. (C) Sagittal image of bone in the rutile TiO2 NP group. (D) Cross-sectional image of bone in the control group. (E) Cross-sectional image of bone in the anatase TiO2 NP group. (F) Cross-sectional image of bone in the rutile TiO2 NP group.
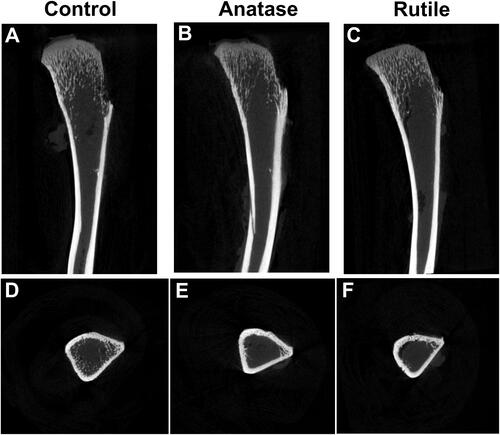
Figure 5 Three-dimensional images of tibia. (A) Cross-sectional image of trabecular bone in the control group. (B) Overall image of trabecular bone in the control group. (C) Sagittal image of bone in the control group. (D) Cross-sectional image of cortical bone in the control group. (E) Cross-sectional image of trabecular bone in the anatase TiO2 NP group. (F) Overall image of trabecular bone in the anatase TiO2 NP group. (G) Sagittal image of bone in the anatase TiO2 NP group. (H) Cross-sectional image of cortical bone in the anatase TiO2 NP group. (I) Cross-sectional image of trabecular bone in the rutile TiO2 NP group. (J) Overall image of trabecular bone in the rutile TiO2 NP group. (K) Sagittal image of bone in the rutile TiO2 NP group. (L) Cross-sectional image of cortical bone in the rutile TiO2 NP group.
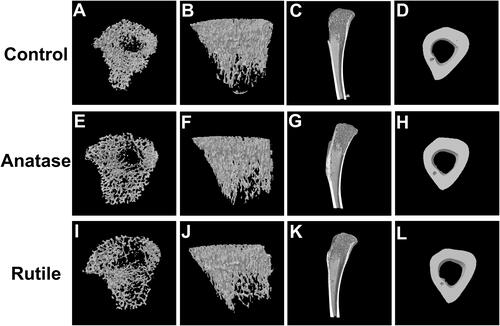
As shown in and , the trabecular bone was normal, and the cortical bone was continuous in the control group. Compared with the control, the trabecular bone retracted towards the proximal tibia in the anatase TiO2 NP group, whereas the cortical bone did not remarkably change ( and ). The trabecular bone was thinner in the rutile TiO2 NP group than in the other groups ( and ). Moreover, the trabecular bone distribution area in the groups of rutile TiO2 NPs was smaller than that in the anatase TiO2 NP group (, , and ). Furthermore, the arrangement of the trabecular bone was more disordered in the rutile TiO2 NP group than in the other groups ( and ).
As shown in –, the tibia exhibited normal trabecular bone structure and cortical bone structure in the control group. In the anatase TiO2 NP group, the trabecular bone was sparse, and the bone density was reduced (–). The trabecular bone was sparser in the rutile TiO2 NP group than in the ones exposed to anatase TiO2 NPs, and the number of trabecular bones decreased in the former (–). The difference in the cortical bone of the tibia in each group was not statistically significant (, and ). These results indicate that TiO2 NPs can damage bone tissue, and the toxicity of rutile TiO2 NPs to the bone seems to be more serious than that of anatase TiO2 NPs.
Data Obtained from Micro-CT
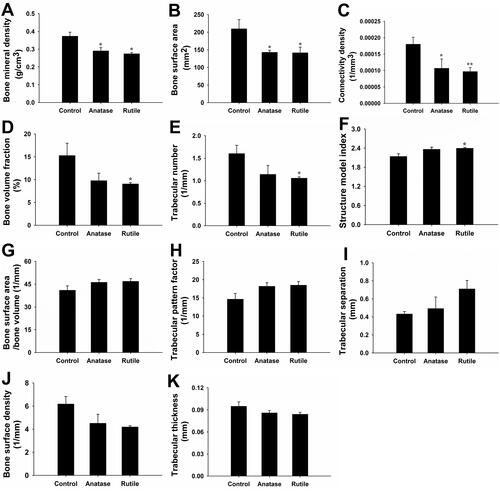
The morphological data of the trabecular bone obtained via micro-CT are shown in . Compared with those in the control group, BMD and BS were significantly lower in the exposure groups (P<0.05, and ). Notably, Conn.Dn decreased in the anatase TiO2 NP group (P<0.05, ). Moreover, Conn.Dn in the rutile TiO2 NPs group was significantly lower than that in the control group (P<0.01, ). Compared with those in the control group, BV/TV and Tb.N significantly decreased, whereas SMI significantly increased in the rutile TiO2 NP group (P<0.05, –). In the exposure groups, BS/BV, Tb.Pf, and Tb.Sp increased, whereas BS/TV and Tb.Th decreased, but the difference was not statistically significant (P>0.05, –). These results indicate that anatase and rutile TiO2 NPs can cause damage to the bone microstructure of young rats. However, the difference between the exposure groups was not statistically significant.
Figure 6 Morphological data of trabecular bone. (A) Bone mineral density (BMD, g/cm3). (B) Bone surface area (BS, mm2). (C) Connectivity density (Conn.Dn, 1/mm3). (D) Bone volume fraction (BV/TV, %). (E) Trabecular number (Tb.N, 1/mm). (F) Structure model index (SMI). (G) Bone surface area/bone volume (BS/BV, 1/mm). (H) Trabecular pattern factor (Tb.Pf, 1/mm). (I) Trabecular separation (Tb.Sp, mm). (J) Bone surface density (BS/TV, 1/mm). (K) Trabecular thickness (Tb.Th, mm).*P<0.05, **P<0.01 compared with control.
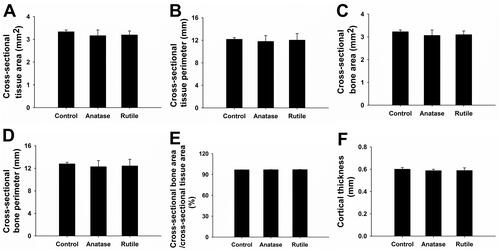
Compared with the control group, T.Ar, T.Pm, B.Ar, B.Pm, and Ct.Th decreased in the exposure groups, but the difference was not statistically significant (P>0.05, ). Although B.Ar/T.Ar increased in the exposure groups, there was no significant difference between them (P>0.05). These results indicate that TiO2 NPs may not cause damage to cortical bone.
Figure 7 Morphological data of cortical bone. (A) Cross-sectional tissue area (T.Ar, mm2). (B) Cross-sectional tissue perimeter (T.Pm, mm). (C) Cross-sectional bone area (B.Ar, mm2). (D) Cross-sectional bone perimeter (B.Pm, mm). (E) Cross-sectional bone area/cross-sectional tissue area (B.Ar/T.Ar, %). (F) Cortical thickness (Ct.Th, mm).
Immunohistochemical Analysis
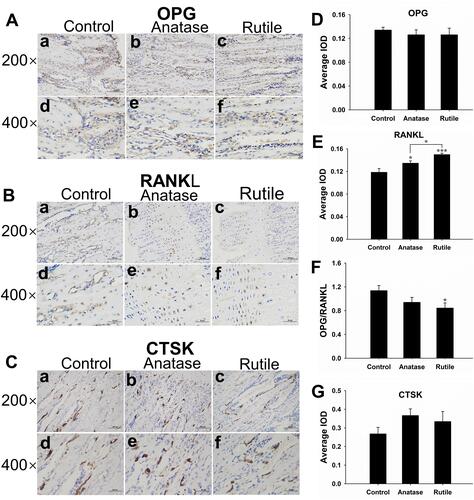
The protein expression of OPG, RANKL, and CTSK was detected by immunohistochemistry. OPG, RANKL, and CTSK were expressed in skeletal cells (brown-yellow in –). The expression of OPG was decreased in the exposure groups, but the difference between each group was not statistically significant (P>0.05, ). RANKL expression was significantly higher in the anatase TiO2 NP group than in the control group (P<0.05, ). Compared with the control group, RANKL expression was significantly increased in the rutile TiO2 NP group (P<0.001). Moreover, RANKL expression was significantly higher in the rutile TiO2 NP group than in the anatase TiO2 NP group (P<0.05). The OPG/RANKL ratio was significantly decreased in the rutile TiO2 NP group (P<0.05, ). Compared with the control group, the ratio of OPG/RANKL was decreased in the anatase TiO2 NP group, but the difference was not statistically significant (P>0.05). CTSK expression was higher in the exposure groups than in the control group (P>0.05, ). These results indicated that TiO2 NPs decreased OPG expression and increased RANKL and CTSK expression. The inhibition of the activity of osteoblasts by rutile TiO2 NPs was stronger than that of anatase TiO2 NPs.
Figure 8 Bone immunohistochemical staining results. (A) OPG expression is colored brown-yellow in osteoblasts (200×, 400×). (B) RANKL expression is colored brown-yellow in osteoblasts (200×, 400×). (C) CTSK expression is colored brown-yellow in osteoclasts (200×, 400×). (D) Average integrated optical density (IOD) value of OPG expression in each group of tibia specimens. (E) Average IOD value of RANKL expression in each group of tibia specimens. (F) OPG/RANKL ratio. (G) Average IOD value of CTSK expression in each group of tibia specimens. a) Control, b) Anatase TiO2 NPs, c) Rutile TiO2 NPs (200×), d) Control, e) Anatase TiO2 NPs, f) Rutile TiO2 NPs (400×). *P<0.05, ***P <0.0001 compared with control.
Discussion
EFSA argues that research on TiO2 NPs that are <30 nanometers in size has limited relevance to the safety assessment of TiO2 NPs, regardless if it pertains to anatase TiO2 NPs or rutile TiO2 NPs.Citation9 In this study, the anatase TiO2 NPs was 29.06 ± 5.43 nm and rutile TiO2 NPs was 32.00 ± 8.42 nm, which were chosen to assess the toxicity of TiO2 NPs to the bone growth and development of young rats. Both anatase and rutile TiO2 NPs are widely used in daily necessities related to children who are easily exposed to these particles. Previous studies have mainly focused on the effects of TiO2 NPs on the liver, kidneys, brain, and other organs in rats. However, few studies discussed the effects of TiO2 NPs on bone tissue. Thus, the present study primarily explored the effects of anatase and rutile TiO2 NPs on bone growth and development in young rats.
The most commonly used indicators for evaluating growth and development are the percent weight growth, body length, and tibia length. As shown in , the percent weight growth of each group, indicating that the different crystal forms of TiO2 NPs did not affect the percent weight growth. The body length and tibia length were also evaluated. On the 14th day of exposure, the body length of the rats in the exposure groups was lower than that of the rats in the control group. No statistically significant differences were observed between exposure groups. On the 28th day of exposure, no statistically significant difference was observed between each group, likely because the young rats were at the puberty stage during the exposure period. Puberty is a critical period for bone growth and development.Citation18 Therefore, the influence of anatase and rutile TiO2 NPs on body length was not significant over time. Moreover, the effects of anatase and rutile TiO2 NPs on tibia length and BMI were not statistically significant. Thus, the different crystal forms of TiO2 NPs did not cause obvious toxicity to the macroscopic growth of young rats. Our results were different from the conclusion of Yao et al.Citation29 They used TiO2 NPs to gavage maternal rats and found that the body length and body weight of offspring were decreased. This may be because the rats they raised were different from the rats we raised.
The effects of TiO2 NPs on bone metabolism were evaluated by detecting levels of Ca and P. P levels substantially increased in the groups exposed to rutile TiO2 NPs, similar to that observed in a previous study in patients with osteoporosis who showed high P levels.Citation30 However, Ca levels did not notably change (). Similarly, the Ca/P ratio did not change significantly (). Therefore, anatase and rutile TiO2 NPs did not cause a notable disorder in bone metabolism. However, the change in P levels in the rutile TiO2 NP group has aroused our attention. This result must be explored further to ascertain whether anatase and rutile TiO2 NPs can damage bone metabolism.
Morphological changes in the tibia were detected by micro-CT. Wang et alCitation31 found that TiO2 NPs can damage the articular cartilage of rats. However, they did not explore the effects of TiO2 NPs on bones. In this study, we observed that the bone tissue was damaged by the TiO2 NPs. Both anatase and rutile TiO2 NPs caused osteoporosis, as indicated by the sparse trabecular bone number, decreased bone density, and disorganized trabecular bone structure ( and ). Furthermore, osteoporosis was more obvious in the rutile TiO2 NP group than in the anatase TiO2 NP group. Micro-CT data were also calculated to further confirm the injuries to the bone tissue. BMD, BS, and Conn.Dn decreased in the exposure groups (–). BV/TV and Tb.N were lower in the group exposed to rutile TiO2 NPs than in the control group ( and ). Moreover, SMI was higher in the group exposed to rutile TiO2 NPs than in the other groups (). These results indicate that rutile TiO2 NPs damaged the bones more seriously than anatase TiO2 NPs. Therefore, TiO2 NPs can damage the microstructure of bones and cause osteoporosis. Furthermore, the damage caused by rutile TiO2 NPs to the trabecular bone was more obvious and more serious than that caused by anatase TiO2 NPs. However, the cortical bone was not damaged by TiO2 NPs (). This result was consistent with the osteoporosis model created by Hsu et al.Citation32 They observed that the trabecular bone of rats with osteoporosis was damaged, but the cortical bone structure was normal. This may be because the trabecular bone is more susceptible to the load generated by the rat’s own activities, while the cortical bone needs a higher load to be damaged.Citation33
The results demonstrated that anatase and rutile TiO2 NPs can directly damage bone tissue but do not influence bone metabolism. Previous studies reported that liver disease can affect bone growth and cause osteoporosis.Citation34 In the present study, indicators of liver function were evaluated to explore whether TiO2 NPs can damage bone tissue. The results showed that rutile TiO2 NPs influenced liver function (). These results were consistent with the findings of Cao et al.Citation15 A study that explored the toxicity of exposure to anatase and rutile TiO2 NPs to the lungs of rabbits also found that rutile TiO2 NPs are more toxic than anatase TiO2 NPs.Citation35 Thus, rutile TiO2 NPs are more toxic to liver function than anatase TiO2 NPs and may influence their secretory function further.
A previous study demonstrated that liver damage can influence serum IGF-1 levels as it is secreted by the liver itself.Citation36 In the present study, serum IGF-1 levels substantially decreased in the rutile TiO2 NP group (). Combined with the damage to liver function in the rutile TiO2 NP group, we believe that rutile TiO2 NPs affect IGF-1 levels because of their toxicity to the liver. Some studies have shown that a low IGF-1 level can cause decreased peak bone mass and negatively influence bone growth.Citation25,Citation37 However, this study observed that low IGF-1 levels did not exert a remarkable effect on longitudinal bone growth. For example, no significant differences in body length and tibia length were observed, although the bone structure was changed. Thus, we believe that the different crystal forms of TiO2 NPs can influence IGF-1 levels and cause damage to bone structure, especially rutile TiO2 NPs.
Although this study confirmed that IGF-1 can affect bone tissue, the underlying mechanism remains unclear. Osteoclasts and osteoblasts are the two most important bone cells. Many molecules can act on these cells to regulate bone growth. OPG is secreted by osteoblasts and can inhibit the physiological effects of RANKL and increase bone formation. RANKL is also secreted by the osteoblasts. It can bind to its receptor, RANK, to promote osteoclast production. An increase in the OPG/RANKL ratio can increase osteoclast activity and promote bone resorption.Citation38 CTSK is highly expressed in osteoclasts. RANKL can stimulate CTSK expression, which further enhances osteoclast activity and aggravates osteoporosis.Citation39,Citation40 Moreover, elevated CTSK expression promotes osteoclast proliferation, leading to bone loss and trabecular bone damage.Citation41 In this study, OPG expression decreased, and RANKL and CTSK expression levels increased in the exposure groups (–). A previous study demonstrated that TiO2 NPs can induce RANKL expression and inhibit the activity of osteoblasts.Citation42 Our results further confirmed this view. TiO2 NPs can disrupt the homeostasis between osteoblasts and osteoclasts and increase RANKL expression. This may further lead to a decline in OPG expression and an increase in CTSK expression. IGF-1 is an essential factor for bone growth that can bind to IGF-1 receptors on bone cells to promote osteogenic activity.Citation37 Guerra-Menéndez et alCitation27 found that OPG expression is decreased and RANKL expression is increased in mice with defective IGF-1. Thus, the decrease in OPG and the increase in RANKL and CTSK were accompanied by a decrease in IGF-1 levels, suggesting that anatase and rutile TiO2 NPs can destroy the balance of osteoblasts and osteoclasts via the OPG/RANKL/CTSK pathway because of the decreased IGF-1 levels.
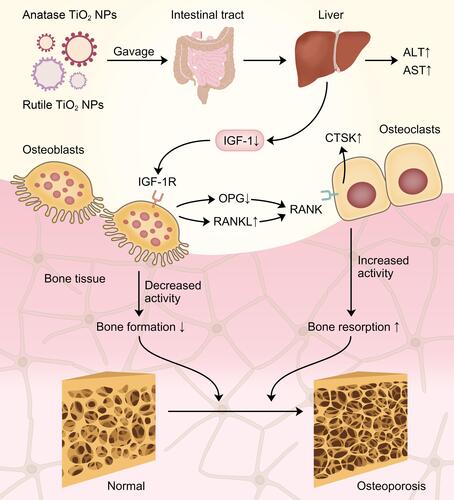
Based on the results of this study, it was demonstrated that rutile TiO2 NPs caused more bone damage than anatase TiO2 NPs. Exposure to these TiO2 NPs can result in changes in OPG, RANKL and CTSK expression. Therefore, the different crystal forms of TiO2 NPs can cause different degrees of damage to bones, with rutile TiO2 NPs being more toxic to bones than anatase TiO2 NPs. Furthermore, we contended that low serum IGF-1 levels may inhibit osteoblast activity via the OPG/RANKL/CTSK pathway and promote osteoclast activity, leading to osteoporosis. Therefore, anatase and rutile TiO2 NPs, especially rutile TiO2 NPs, can decrease IGF-1 levels and influence bone growth via the IGF-1/OPG/RANKL/CTSK pathway ().
Figure 9 The schematic diagram for anatase and rutile TiO2 NPs damage bone structure in young rats via the IGF-1/OPG/RANKL/CTSK pathway. Data from these studies. Citation43,Citation44
Conclusions
This study explored the effects of anatase and rutile TiO2 NPs on bone growth and development in young rats. In this study, we first demonstrated that anatase and rutile TiO2 NPs can damage the bone structure of young rats via the IGF-1/OPG/RANKL/CTSK pathway. We also found that rutile TiO2 NPs were more toxic than anatase TiO2 NPs in young rat bones.
Acknowledgments
This work was supported by the National Natural Science Foundation of China (82060162).
Disclosure
The authors report no conflicts of interest in this work.
References
- Anu Mary Ealia S, Saravanakumar MP. A review on the classification, characterisation, synthesis of nanoparticles and their application. IOP Conference Series: Materials Science and Engineering: IOP Publishing. 2017; 263.
- Yan J, Wang D, Li K, et al. Toxic effects of the food additives titanium dioxide and silica on the murine intestinal tract: mechanisms related to intestinal barrier dysfunction involved by gut microbiota. Environ Toxicol Pharmacol. 2020;80:103485. doi:10.1016/j.etap.2020.103485
- Weir A, Westerhoff P, Fabricius L, Hristovski K, von Goetz N. Titanium dioxide nanoparticles in food and personal care products. Environ Sci Technol. 2012;46(4):2242–2250. doi:10.1021/es204168d
- Chen Z, Han S, Zhou S, Feng H, Liu Y, Jia G. Review of health safety aspects of titanium dioxide nanoparticles in food application. NanoImpact. 2020;1:18.
- Heringa MB, Geraets L, van Eijkeren JC, Vandebriel RJ, de Jong WH, Oomen AG. Risk assessment of titanium dioxide nanoparticles via oral exposure, including toxicokinetic considerations. Nanotoxicology. 2016;10(10):1515–1525.
- Jovanovic B. Critical review of public health regulations of titanium dioxide, a human food additive. Integr Environ Assess Manag. 2015;11(1):10–20. doi:10.1002/ieam.1571
- Pele LC, Thoree V, Bruggraber SF, et al. Pharmaceutical/food grade titanium dioxide particles are absorbed into the bloodstream of human volunteers. Part Fibre Toxicol. 2015;12:26. doi:10.1186/s12989-015-0101-9
- IARC. Monographs on the Evaluation of Carcinogenic Risks to Humans Carbon Black, Titanium Dioxide, and Talc. France: World Health Organization, International Agency for Research on Cancer Lyon; 2010:93.
- Younes M, Aquilina G, Castle L. Safety assessment of titanium dioxide (E171) as a food additive. EFSA J. 2021;19(5):e06585.
- Geraets L, Oomen AG, Krystek P, et al. Tissue distribution and elimination after oral and intravenous administration of different titanium dioxide nanoparticles in rats. Part Fibre Toxicol. 2014;11:30.
- Yao L, Tang Y, Chen B, et al. Oral exposure of titanium oxide nanoparticles induce ileum physical barrier dysfunction via Th1/Th2 imbalance. Environ Toxicol. 2020;35(9):982–990. doi:10.1002/tox.22934
- Hattori K, Nakadate K, Morii A, Noguchi T, Ogasawara Y, Ishii K. Exposure to nano-size titanium dioxide causes oxidative damages in human mesothelial cells: the crystal form rather than size of particle contributes to cytotoxicity. Biochem Biophys Res Commun. 2017;492(2):218–223. doi:10.1016/j.bbrc.2017.08.054
- Grasso A, Ferrante M, Zuccarello P, et al. Chemical Characterization and Quantification of Titanium Dioxide Nanoparticles (TiO2-NPs) in Seafood by Single-Particle ICP-MS: assessment of Dietary Exposure. Int J Environ Res Public Health. 2020;17:24. doi:10.3390/ijerph17249547
- Sanders K, Degn LL, Mundy WR, et al. In vitro phototoxicity and hazard identification of nano-scale titanium dioxide. Toxicol Appl Pharmacol. 2012;258(2):226–236. doi:10.1016/j.taap.2011.10.023
- Cao X, Han Y, Gu M, et al. Foodborne Titanium Dioxide Nanoparticles Induce Stronger Adverse Effects in Obese Mice than Non-Obese Mice: gut Microbiota Dysbiosis, Colonic Inflammation, and Proteome Alterations. Small. 2020;16(36):e2001858. doi:10.1002/smll.202001858
- Jin C, Tang Y, Yang FG, et al. Cellular toxicity of TiO2 nanoparticles in anatase and rutile crystal phase. Biol Trace Elem Res. 2011;141(1–3):3–15. doi:10.1007/s12011-010-8707-0
- Numano T, Xu J, Futakuchi M, et al. Comparative study of toxic effects of anatase and rutile type nanosized titanium dioxide particles in vivo and in vitro. Asian Pac J Cancer Prev. 2014;15(2):929–935. doi:10.7314/APJCP.2014.15.2.929
- Davies JH, Evans BA, Gregory JW. Bone mass acquisition in healthy children. Arch Dis Child. 2005;90(4):373–378. doi:10.1136/adc.2004.053553
- Clark EM, Ness A, Tobias JH, Team AS. Social position affects bone mass in childhood through opposing actions on height and weight. J Bone Miner Res. 2005;20(12):2082–2089. doi:10.1359/JBMR.050808
- Xu X, Tang Y, Lang Y, et al. Oral Exposure to ZnO Nanoparticles Disrupt the Structure of Bone in Young Rats via the OPG/RANK/RANKL/IGF-1 Pathway. Int J Nanomedicine. 2020;15:9657–9668. doi:10.2147/IJN.S275553
- Hu H, Zhang B, Li L, et al. The toxic effects of titanium dioxide nanoparticles on plasma glucose metabolism are more severe in developing mice than in adult mice. Environ Toxicol. 2020;35(4):443–456. doi:10.1002/tox.22880
- Rosenfeld RG. The molecular basis of idiopathic short stature. Growth Horm IGF Res. 2005;15(Suppl):A:S3–5. doi:10.1016/j.ghir.2005.06.014
- Guntur AR, Rosen CJ. IGF-1 regulation of key signaling pathways in bone. Bonekey Rep. 2013;2:437. doi:10.1038/bonekey.2013.171
- Matar M, Al-Shaar L, Maalouf J, et al. The Relationship Between Calciotropic Hormones, IGF-1, and Bone Mass Across Pubertal Stages. J Clin Endocrinol Metab. 2016;101(12):4860–4870. doi:10.1210/jc.2016-3071
- Bachagol D, Joseph GS, Ellur G, et al. Stimulation of liver IGF-1 expression promotes peak bone mass achievement in growing rats: a study with pomegranate seed oil. J Nutr Biochem. 2018;52:18–26. doi:10.1016/j.jnutbio.2017.09.023
- Liu H, Zhu R, Wang L, et al. Radix Salviae miltiorrhizae improves bone microstructure and strength through Wnt/beta-catenin and osteoprotegerin/receptor activator for nuclear factor-kappaB ligand/cathepsin K signaling in ovariectomized rats. Phytother Res. 2018;32(12):2487–2500. doi:10.1002/ptr.6188
- Guerra-Menendez L, Sadaba MC, Puche JE, et al. IGF-I increases markers of osteoblastic activity and reduces bone resorption via osteoprotegerin and RANK-ligand. J Transl Med. 2013;11:271. doi:10.1186/1479-5876-11-271
- Wang Y, Chen Z, Ba T, et al. Susceptibility of young and adult rats to the oral toxicity of titanium dioxide nanoparticles. Small. 2013;9(9–10):1742–1752. doi:10.1002/smll.201201185
- Yao L, Chen L, Chen B, et al. Toxic effects of TiO2 NPs in the blood-milk barrier of the maternal dams and growth of offspring. Ecotoxicol Environ Saf. 2021;208:111762. doi:10.1016/j.ecoenv.2020.111762
- Pardhe BD, Pathak S, Bhetwal A, et al. Effect of age and estrogen on biochemical markers of bone turnover in postmenopausal women: a population-based study from Nepal. Int J Womens Health. 2017;9:781–788. doi:10.2147/IJWH.S145191
- Wang J, Gao Y, Hou Y, et al. Evaluation on Cartilage Morphology after Intra-Articular Injection of Titanium Dioxide Nanoparticles in Rats. J Nanomater. 2012;2012:1–11. doi:10.1155/2012/909473
- Hsu PY, Tsai MT, Wang SP, Chen YJ, Wu J, Hsu JT. Cortical Bone Morphological and Trabecular Bone Microarchitectural Changes in the Mandible and Femoral Neck of Ovariectomized Rats. PLoS One. 2016;11(4):e0154367. doi:10.1371/journal.pone.0154367
- De Souza RL, Matsuura M, Eckstein F, Rawlinson SC, Lanyon LE, Pitsillides AA. Non-invasive axial loading of mouse tibiae increases cortical bone formation and modifies trabecular organization: a new model to study cortical and cancellous compartments in a single loaded element. Bone. 2005;37(6):810–818. doi:10.1016/j.bone.2005.07.022
- Yang YJ, Kim DJ. An Overview of the molecular mechanisms contributing to musculoskeletal disorders in chronic liver disease: osteoporosis, sarcopenia, and osteoporotic sarcopenia. Int J Mol Sci. 2021;22(5):254.
- An H. Comparison of the Effects of Nanometer Titanium Dioxide with Two Crystal Forms on Rabbits Blood Routine Index and Organ Coefficient in the Instillation of Non-exposure Bronchus Toxic Contamination. Int J Bioautomation. 2014;18(1):15–22.
- Yakar S, Rosen CJ, Beamer WG, et al. Circulating levels of IGF-1 directly regulate bone growth and density. J Clin Invest. 2002;110(6):771–781. doi:10.1172/JCI0215463
- Kawai M, Rosen CJ. The insulin-like growth factor system in bone: basic and clinical implications. Endocrinol Metab Clin North Am. 2012;41(2):323–333. doi:10.1016/j.ecl.2012.04.013
- Martin TJ, Sims NA. RANKL/OPG; Critical role in bone physiology. Rev Endocr Metab Disord. 2015;16(2):131–139. doi:10.1007/s11154-014-9308-6
- Zhao Q, Jia Y, Xiao Y. Cathepsin K: a therapeutic target for bone diseases. Biochem Biophys Res Commun. 2009;380(4):721–723. doi:10.1016/j.bbrc.2009.01.139
- Ma W, Wang F, You Y, et al. Ortho-silicic Acid Inhibits RANKL-Induced Osteoclastogenesis and Reverses Ovariectomy-Induced Bone Loss In Vivo. Biol Trace Elem Res. 2021;199(5):1864–1876. doi:10.1007/s12011-020-02286-6
- Lotinun S, Ishihara Y, Nagano K, et al. Cathepsin K–deficient osteocytes prevent lactation-induced bone loss and parathyroid hormone suppression. J Clin Invest. 2019;129(8):3058–3071. doi:10.1172/JCI122936
- Cai K, Hou Y, Hu Y, et al. Correlation of the cytotoxicity of TiO2 nanoparticles with different particle sizes on a sub-200-nm scale. Small. 2011;7(21):3026–3031. doi:10.1002/smll.201101170
- Udagawa N, Koide M, Nakamura M, et al. Osteoclast differentiation by RANKL and OPG signaling pathways. J Bone Miner Metab. 2021;39(1):19–26. doi:10.1007/s00774-020-01162-6
- Ranke MB, Wit JM. Growth hormone - past, present and future. Nat Rev Endocrinol. 2018;14(5):285–300. doi:10.1038/nrendo.2018.22