Abstract
Purpose
Magnetic resonance imaging (MRI) using contrast agents like superparamagnetic iron oxide (SPIO) is an extremely versatile technique to diagnose diseases and to monitor treatment. This study tested the relative importance of particle size and surface coating for the optimization of MRI contrast and labeling efficiency of macrophages migrating to remote inflammation sites.
Materials and methods
We tested four SPIO and ultrasmall superparamagnetic iron oxide (USPIO), alkali-treated dextran magnetite (ATDM) with particle sizes of 28 and 74 nm, and carboxymethyl dextran magnetite (CMDM) with particle sizes of 28 and 72 nm. Mouse macrophage RAW264 cells were incubated with SPIOs and USPIOs, and the labeling efficiency of the cells was determined by the percentage of Berlin blue-stained cells and by measuring T2 relaxation times with 11.7-T MRI. We used trypan blue staining to measure cell viability.
Results
Analysis of the properties of the nanoparticles revealed that ATDM-coated 74 nm particles have a lower T2 relaxation time than the others, translating into a higher ability of MRI negative contrast agent. Among the other three candidates, CMDM-coated particles showed the highest T2 relaxation time once internalized by macrophages. Regarding labeling efficiency, ATDM coating resulted in a cellular uptake higher than CMDM coating, independent of nanoparticle size. None of these particle formulations affected macrophage viability.
Conclusion
This study suggests that coating is more critical than size to optimize the SPIO labeling of macrophages. Among the formulations tested in this study, the best MRI contrast and labeling efficiency are expected with ATDM-coated 74 nm nanoparticles.
Introduction
The use of nanoparticles for cellular imaging is among the most important clinical breakthrough of the past decade. In particular, superparamagnetic iron oxide (SPIO) nanoparticles enhance contrast in magnetic resonance imaging (MRI), which allows clinicians to monitor anatomical, physiological, and molecular changes during the evolution of a disease or treatment. Following intravenous injection, these nanoparticles accumulate in macrophages residing in the liver, bone marrow, and spleen, as well as tumors and sites of inflammation. Accordingly, applications include the detection of inflammatory diseases, in vivo stem cell tracking,Citation1 hyperthermia therapy,Citation2 lymph node detection,Citation3 and anticancer drug delivery.Citation4
The current applications for SPIO nanoparticles are limited because these relatively large particles, with an average diameter of 80 nm, are rapidly internalized by the mononuclear phagocytic system of the liver and the spleen. This problem is currently addressed by the development of ultrasmall superparamagnetic iron oxide (USPIO) nanoparticles (<50 nm).Citation5 In vivo studies recently showed that USPIO nanoparticles of 35 nm in diameter have a longer half-life in the circulation system, allowing the labeling of macrophages migrating to remote areas.Citation6,Citation7 These studies opened the door to a number of new applications for molecular imaging because macrophages migrate and accumulate at sites of inflammation,Citation8 autoimmune neuritis,Citation9 renal ischemia,Citation10 and solid organ transplant rejection.Citation11 The use of USPIO agents has allowed for the direct visualization of macrophage infiltration of carotid atheroma in clinical study.Citation12,Citation13 The surface coating of USPIO nanoparticles also influences their stability and cellular uptake by macrophages.Citation6 Dextran-based coatings are preferred because of their low toxicity and they are biodegradable.Citation14 For instance, dextran-coated SPIO nanoparticles and ferucarbotran are approved for liver MRI. Moreover, carboxydextran-coated SPIO nanoparticles have undergone clinical trials for MRI evaluation of lymph node metastasis;Citation15,Citation16 however, the impact of USPIO nanoparticles size and dextran coating composition on the uptake by macrophages has not been determined.
The aim of the present study is to determine the impact of particle size and surface coating on the cellular uptake and relaxing time of SPIO nanoparticles in mouse macrophages by MRI and microscopy. The USPIO (28 nm) and SPIO (72 and 74 nm) nanoparticles were coated with alkali-treated dextran (ATDM) or carboxymethyl dextran (CMDM).
Material and methods
Ultrasmall superparamagnetic iron oxides
We tested four types of SPIO and USPIO contrast agents. ATDM (surface voltage potential: −15 mV) was tested with particle sizes of 28 and 74 nm. CMDM (surface voltage potential: −24 mV) was tested with particle sizes of 28 and 72 nm. All SPIO and USPIO compounds were purchased from the Meito Sangyo Company, Ltd (Aichi, Japan).Citation17
Cell culture of mouse macrophage RAW264 cells
The mouse macrophage cell line RAW264 was provided by the RIKEN BioResource Center (RIKEN Tsukuba Institute, Tsukuba, Ibaraki, Japan). RAW264 cells (1 × 10⁶) were cultured in minimum essential medium (Sigma-Aldrich, Tokyo, Japan), 10% fetal calf serum (Nichirei Corporation, Tokyo, Japan), and 0.1 mM nonessential amino acids (Sigma-Aldrich) in 93 mm × 21 mm Petri dishes (IWAKI, Tokyo, Japan) with 18 mm square cover glasses (Matusnami Glass Ind, Ltd, Osaka, Japan). All cultures were incubated with 5% CO2 at 37°C.
Measurement of SPIO and USPIO T2 relaxation times
The contrast of proton MRI images depends on the relaxation times of the nuclear magnetization (T1, longitudinal; T2, transverse). Iron oxide nanoparticles primarily affect T2 and work as negative contrast agents. A high intracellular concentration of SPIO and USPIO nanoparticles results in the reduction of T2 relaxation time. Prior to the MRI experiment, the concentrations of USPIO particles were adjusted to 0.005 mg Fe/mL and prepared in five sample tubes with water samples serving as controls. MRI experiments for the three times measurements of the T2 relaxation times were performed on an 11.7-T MRI scanner (Bruker BioSpin, Ettlingen, Germany) and used a volume RF coil with a 25 mm inner diameter for transmission and reception (m2m Imaging Corp, Cleveland, OH). T2 mapping was performed using a multislice, multiecho spin-echo sequence (repetition time = 3000 ms; slice thickness = 1 mm; field of view = 25.6 × 25.6 mm; matrix = 128 × 128; slice orientation = transaxial; number of repetitions = 1) with echo times ranging from 10 to 100 ms in steps of 10 ms. T2 maps were calculated from a single exponential fitting of MRI signal intensities at each echo time point.
Measurement of USPIO-labeling efficiency
The experiments were conducted to measure the T2 relaxation times of the macrophages labeled with SPIO or USPIO nanoparticles. All USPIO particles were dissolved in the cell growth medium at a concentration of 0.3 mg Fe/mL, which is similar to the concentration used in another published report.Citation18 Cells (2 × 10⁶) were incubated with medium containing USPIO particles for 1, 2, or 4 h (same time points noted in a previous report)Citation19 at 37°C under 5% CO2. After incubation, the medium was removed by two washes with phosphate-buffered saline (PBS) followed by fixation of the cells for 30 min with 7.5% formalin. The presence of iron oxides in the RAW264 cells was detected by staining with Berlin blue (KFe(3)Fe(2)(CN)Citation6) (Wako Pure Chemical Industries, Ltd, Osaka, Japan)Citation20 for 20 min. After washing away the Berlin blue with PBS, the cell nuclei were counter-stained with nuclear fast red for 5 min. The nuclear fast red was removed by washing with PBS three times, and the cell specimens were fixed to the cover glass. For each experiment, the labeling efficiency of each type of USPIO nanoparticle was assessed visually by three observers using a BZ-9000 microscope (Keyence Corporation, Osaka, Japan). The labeling efficiencies (percentages of SPIO/USPIO uptake) were qualitatively assessed from the microscope images in three independent experiments by estimating the number of iron-positive cells within five randomly selected 200 μm2 fields.
Viability of USPIO-labeled cells
We used trypan blue (Sigma-Aldrich) staining to measure cell viability. Viable cells are not stained by trypan blue, while dead and lysed cells are stained. All USPIO particles were dissolved in cell growth medium at a concentration of 0.3 mg Fe/mL, which is a lower concentration when compared to a sample test because the concentrations of SPIO and USPIO in macrophage cells were lower than sample SPIO and USPIO concentrations. Cells (2 × 10⁶) were incubated in a medium containing USPIO particles for 1, 2, or 4 h at 37°C under 5% CO2. After incubation, the medium was removed with two washes of PBS and the cells were fixed with formalin. Cells were stained with trypan blue for 10 min and the viable and dead cells were counted under a microscope. The percentages of viable cells were qualitatively assessed by counting the number of trypan blue-positive cells within five randomly selected 200 μm2 fields. The cell viability was calculated at least thrice and an average was taken.
Measurement of labeled cells using 11.7-T MRI
All USPIO nanoparticles were dissolved in cell growth medium at a concentration of 0.3 mg/mL. RAW264 cells (2 × 10⁶) were incubated with medium containing USPIO particles for 30 min at 37°C under 5% CO2. After incubation, the medium was removed by two washes with PBS and the cells were fixed with formalin. The concentration of RAW264 cells was adjusted to 4 × 10⁶ cells/mL and the cells (0.5 mL) were dissolved in 0.1% agarose gel (0.5 mL) to give a final concentration of 2.0 × 10⁶ cells/mL. The sample temperature was maintained at approximately 23°C and the cells were imaged after settling into a pellet by gravity. For measurement of T2 relaxation time, T2 mapping was performed using a multislice multiecho spin-echo sequence (repetition time = 3000 ms; slice thickness = 1 mm; field of view = 25.6 × 25.6 mm; matrix = 128 × 128; slice orientation = transaxial; number of repetitions = 1) with echo times ranging from 10 to 100 ms in steps of 10 ms. T2 maps were calculated from a single exponential fitting of MRI signal intensities at each echo time point. The measurements of labeled cells using 11.7-T MRI was repeated thrice.
Statistical analysis
All statistical analysis was performed using Prism (version 5; GraphPad Software Inc, La Jolla, CA). One-way analysis of variance with the Bonferroni correction was applied in order to compare changes in percentages of SPIO and USPIO uptake, cell viability, and T2 relaxation times for all SPIO/USPIO nanoparticles and labeled cells. P < 0.05 was considered significant.
Results
T2 relaxation time measurements of USPIO nanoparticles
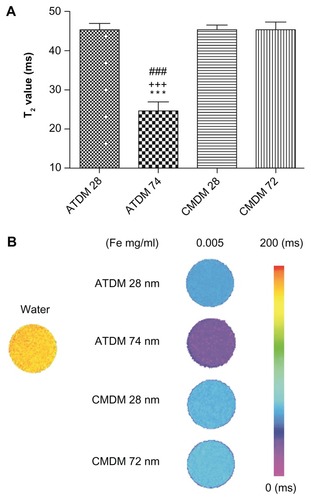
The MRI contrast provided by each type of nanoparticle formulation was compared by measuring the T2 relaxation time. At 0.005 mg Fe/mL, T2 relaxation time of the 74 nm ATDM-coated nanoparticles was lower than for the other three formulations (). Since a low T2 relaxation time translates into a high MRI negative contrast, these data suggest that ATDM-coated SPIO nanoparticles would provide the best MRI images among these formulations ().
Figure 1 Relaxation time of two SPIO/USPIOs. (A) T2 maps of control sample (127.5 ± 0.5 ms) for ATDM and CMDM, 28, 72, and 74 nm, at 0.005 and 0.01 mg/mL. The color scale represents T2 values from 0 ms to 200 ms. (B) Graphical representation of T2 relaxation time of each of the nanoparticles.
Notes: ***P < 0.001, significant difference vs ATDM 28 nm. +++P < 0.001, significant difference vs CMDM 28 nm. ###P < 0.001, significant difference vs CMDM 72 nm.
Abbreviations: SPIO, superparamagnetic iron oxide; USPIO, ultrasmall superparamagnetic iron oxide; ATDM, alkali-treated dextran magnetite; CMDM, carboxymethyl dextran magnetite.
Evaluation of in vitro USPIO labeling efficiency by microscopy
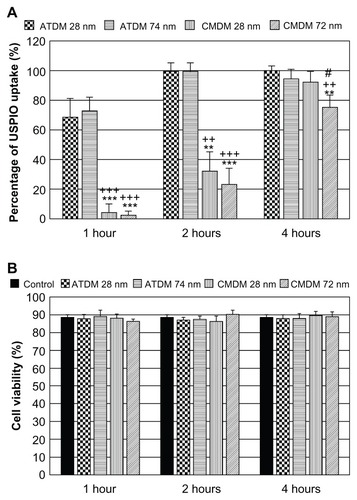
Microscopy analysis was used to compare the labeling efficiency of each nanoparticle formulation in terms of the percentage of macrophages labeled within 200-mm2 fields, and the rate of culture saturation over time. Overall, the ATDM-coated nanoparticles provided a more efficient labeling of the macrophages than the CMDM-coated nanoparticles (). Quantitative analysis revealed that more than 60% of the macrophages were labeled by ATDM-coated nanoparticles after 1 h, compared to <10% with CMDM-coated nanoparticles, regardless of the particle size (). This profile was maintained after 2 h. However, the efficiency of ATDM-coated nanoparticle labeling had reached 100%, and CMDM-coated nanoparticles were detected only in 20%–30% of macrophages. After 4 h, all nanoparticle formulations had a labeling efficiency superior to 95%, except for 20%–30% for CMDM-coated 28 and 72 nm nanoparticles. shows that none of the nanoparticle formulations affected the viability of the macrophages. Altogether, these data suggest that the use of USPIO nanoparticles (28 nm), instead of SPIO nanoparticles (72 and 74 nm), does not improve the labeling efficiency of macrophages. In contrast, ATDM coating provides a more rapid and efficient labeling of most cells for at least 4 h, which is an asset for MRI imaging.
Figure 2 SPIO/USPIO labeled macrophage cells. Microscopy images of labeled cells by ATDM and CMDM. Iron particles are stained blue, and RAW264 macrophage cell are stained red. (A) Unlabeled control cells; (B) ATDM 28 nm labeled cells at 1 h administration; (C) ATDM 28 nm labeled cells at 2 h administration; (D) ATDM 28 nm labeled cells at 4 h administration; (E) ATDM 74 nm labeled cells at 1 h administration; (F) ATDM 74 nm labeled cells at 2 h administration; (G) ATDM 74 nm labeled cells at 4 h administration; (H) CMDM 28 nm labeled cells at 1 h administration; (I) CMDM 28 nm labeled cells at 2 h administration; (J) CMDM 28 nm labeled cells at 4 h administration; (K) CMDM 72 nm labeled cells at 1 h administration; (L) CMDM 72 nm labeled cells at 2 h administration; (M) CMDM 72 nm labeled cells at 4 h administration.
Abbreviations: SPIO, superparamagnetic iron oxide; USPIO, ultrasmall superparamagnetic iron oxide; ATDM, alkali-treated dextran magnetite; CMDM, carboxymethyl dextran magnetite.
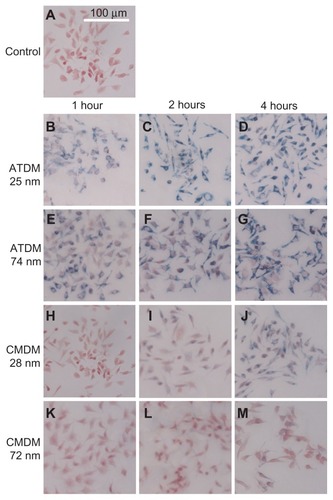
Figure 3 Labeling efficiency and viability in macrophage cells after SPIO/USPIO administrations. (A) Percentage of SPIO/USPIO uptake after SPIO/USPIO administration at 1 to 4 h. (B) Cell viability after each SPIO/USPIO culture.
Notes: **P < 0.01, significant difference vs ATDM 28 nm. ***P < 0.001, significant difference vs ATDM 28 nm. ++P < 0.01, significant difference vs ATDM 74 nm. +++P < 0.001, significant difference vs ATDM 74 nm. #P < 0.05, significant difference vs CMDM 28 nm.
Abbreviations: SPIO, superparamagnetic iron oxide; USPIO, ultrasmall superparamagnetic iron oxide; ATDM, alkali-treated dextran magnetite; CMDM, carboxymethyl dextran magnetite.
Magnetic resonance imaging of labeled mouse macrophage cells
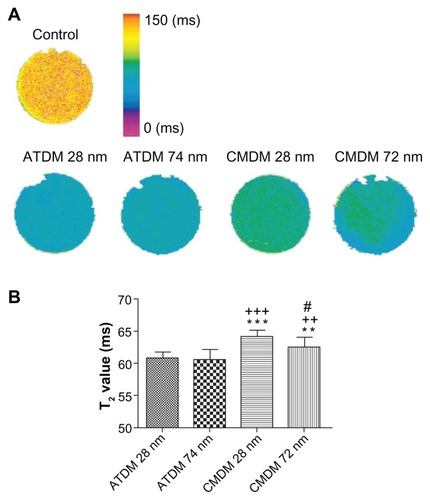
The T2 relaxation time of each nanoparticle formulation was measured following a 30-min labeling period of the macrophages to determine the impact of cellular uptake. shows the different MRI signal intensities obtained for the four types of nanoparticles. Quantitative analysis revealed significantly higher T2 values for the CMDM-coated particles than the ATDM-coated particles (). Among the ATDM-coated particles, USPIO particles generated an even brighter signal change than the SPIO particles. These data suggest that ATDM-coated USPIO particles would offer the best MRI image contrast than all four formulations.
Figure 4 T2 relaxation times of labeled cells evaluated by MRI. (A) T2 map of control and SPIO/USPIO labeled cell pellets at 30 min cell culture. The color scale represents T2 values from 0 ms to 150 ms. (B) T2 values of cells labeled by the four SPIO/USPIO.
Notes: **P < 0.01, significant difference vs ATDM 28 nm. ***P < 0.001, significant difference vs ATDM 28 nm. ++P < 0.01, significant difference vs ATDM 74 nm. +++P < 0.001, significant difference vs ATDM 74 nm. #P < 0.05, significant difference vs CMDM 28 nm
Abbreviations: MRI, magnetic resonance imaging; ATDM, alkali-treated dextran magnetite; CMDM, carboxymethyl dextran magnetite; SPIO, superparamagnetic iron oxide; USPIO, ultrasmall superparamagnetic iron oxide.
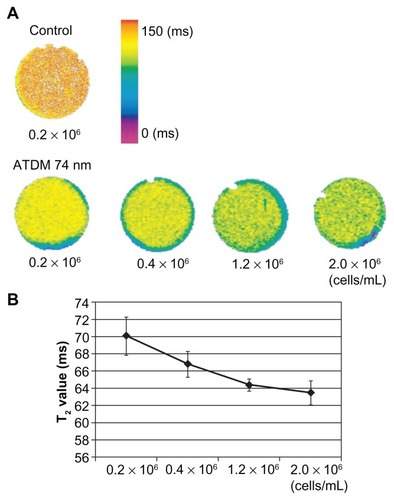
Finally, the impact of cell density on the contrast quality of MRI images was tested by measuring the T2 relaxation time of macrophages labeled with ATDM-coated 74 nm nanoparticles for 30 min. shows that the T2 relaxation time decreases with increasing cell density. A linear relationship between relaxation time and cell density was observed for <0.4 × 10⁶ macrophages per mL (). These data suggest that the ability of MRI negative contrast agent is increased at high cell density.
Figure 5 T2 relaxation times of different labeled cell density using ATDM-74 nm. (A) T2 map of control and ATDM 74 nm labeled cell pellets at 30 min; cell culture at different cell density. The color scale represents T2 values from 0 ms to 150 ms. (B) T2 values of labeled cells at different cell density.
Abbreviation: ATDM, alkali-treated dextran magnetite.
Discussion
The present study suggests that SPIO/USPIO labeling efficiency in cultured mouse macrophages was influenced by the particle size and surface coating. The labeling efficiencies of four SPIO/USPIOs in mouse macrophage cells could be visualized by microscopy and 11.7-T MRI.
Oude Engberink et al reported that SPIO particles with a diameter of 150 nm were more efficiently incorporated into mononuclear cells than USPIO particles with a diameter of 30 nm.Citation19 Particles with larger diameters were more efficiently incorporated into macrophages.Citation21,Citation22 After 1 to 4 h of administration, there were no differences in labeling efficiencies between ATDM at 28 nm and at 74 nm (). In addition, there was no difference in labeling efficiencies by CMDM 1 h after administration. The diameter of SPIO used in previous studies was over 150 nm.Citation21,Citation22 The diameter of USPIO used as a control was below 30 nm.Citation23,Citation24 The culture time varied from 30 minCitation21 to 6 h.Citation8 In our experiment, the diameters of USPIO and SPIO particles that were compared were only about 30 and 70 nm and we show that particle size is not an important factor in the uptake of 28 and 74 nm iron nanoparticles irons.
Using an efficient labeling contrast agent is critical for cell imaging. The most commonly used cell-labeling method is to culture cells with a contrast agent. This method employs surface modification with cations,Citation25 virus transfection,Citation26 lipofectamine,Citation27 and poly-L-lysineCitation28 to increase the labeling efficiency. These positively-charged reagents are cocultured with negatively-charged USPIO to alter the USPIO into a positively-charged compound. Such a charge alteration increases the affinity of USPIO to negatively-charged cell membranes, thereby facilitating the intracellular uptake of the USPIO contrast agent. The mechanism through which the positively-charged contrast agent passes through the cell membrane remains unclear, however, it may include cell wall destruction, adhesion, and internalization. The ATDM-coated particles are more positively-charged compared to the CMDM-coated particles. Our experiment demonstrated a more efficient uptake of iron particles during approximately 0.5–4 h culture for more positively-charged ATDM (−15 mV) than for CMDM (−24 mV). Furthermore, in vitro 11.7-T MRI of labeled cells also demonstrated a shorter T2 relaxation time for ATDM-labeled than for CMDM-labeled cells, although CMDM and ATDM had the same diameter (). The different charge and coating states of the surface potential may have influenced the uptake by cultured macrophages.
Surface coating can influence the cytotoxic nature of the nanoparticle. In a previous study, it has been shown that aminosilane-and dextran-coated nanoparticles did not affect the cell viability of mouse macrophage cells.Citation29 However, silane-coated SPIO nanoparticles negatively affected mouse macrophage cell viability in a dose-dependent manner.Citation29 Moreover, silica-coated SPIO nanoparticles, rather than dextran-coated nanoparticles, displayed dose-dependent cytotoxicity.Citation30 In our study, none of the nanoparticle formulations affected the viability of the macrophages (). Our dextran-coated nanoparticles are safer than nanoparticles coated with aminosiline and silica.Citation29,Citation30 The different charge and coating states of the surface potential did not influence the cell viability of cultured macrophages in the four types of SPIO and USPIO contrast agents that we used.
In the in vivo imaging of labeled macrophages, a longer half-life of blood is critical for increasing accessibility to target organs and tissues.Citation7,Citation8,Citation28,Citation29 SPIO particles with a diameter of about 50 nm are rapidly incorporated into Kupffer cells in the liver and reticuloendothelial system in the spleen. Hence, the half-life of SPIO in the blood is as short as approximately 4–8 min.Citation13,Citation28 On the other hand, USPIO particles with a diameter below 30 nm are barely recognized by the reticuloendothelial system. The half-life of USPIO in blood is as long as approximately 24–36 h in humans and a few hours in rats.Citation6,Citation7,Citation31 The current study shows that CMDM-coated nanoparticles label macrophages at a significantly lower rate than ATDM-coated nanoparticles, suggesting that they should remain soluble in blood circulation for a longer period of time. There are no differences in T2 relaxation time of labeled cells between ATDM at 28 and 74 nm (); however, the T2 relaxation time of contrast agent differs between ATDM at 28 and 74 nm (). Hence, the shortened T2 relaxation time of labeled cells cannot simply be explained by the difference in the labeling efficiency of cells. Also, no difference was noted in the T2 relaxation time of contrast agent between ATDM at 28 and CMDM 28 nm (), even though the T2 relaxation times of ATDM labeled cells were shorter than that of CMDM labeled cells (). Thus, ATDM USPIO with a smaller diameter was more efficiently incorporated into cells than CMDM USPIO, thereby providing a more effective in vivo contrast agent for macrophages.
Conclusion
We conclude that the best contrast agent would be ATDM-coated 74 nm SPIO nanoparticles. Despite recent interest in smaller particles (USPIO), this study shows that coating plays a more important role than size to optimize MRI contrast, while increasing the nanoparticle labeling time.
Disclosure
The authors report no conflicts of interest in this work.
References
- Daldrup-LinkHERudeliusMPiontekGMigration of iron oxide-labeled human hematopoietic progenitor cells in a mouse model: in vivo monitoring with 1.5-T MR imaging equipmentRadiology2005234119720515618382
- MuraseKOonokiJTakataHSimulation and experimental studies on magnetic hyperthermia with use of superparamagnetic iron oxide nanoparticlesRadiol Phys Technol20114219420221667079
- MoriYUmedaMFukunagaMOgasawaraKYoshiokaYMR contrast in mouse lymph nodes with subcutaneous administration of iron oxide particles: size dependencyMagn Reson Med Sci201110421922722214906
- McBainSCYiuHHDobsonJMagnetic nanoparticles for gene and drug deliveryInt J Nanomedicine20083216918018686777
- BenderbousSCorotCJacobsPBonnemainBSuperparamagnetic agents: physicochemical characteristics and preclinical imaging evaluationAcad Radiol19963Suppl 2S292S2948796583
- Di MarcoMSadunCPortMGuilbertICouvreurPDubernetCPhysicochemical characterization of ultrasmall superparamagnetic iron oxide particles (USPIO) for biomedical application as MRI contrast agentsInt J Nanomedicine20072460962218203428
- DoussetVDelalandeCBallarinoLIn vivo macrophage activity imaging in the central nervous system detected by magnetic resonanceMagn Reson Med199941232933310080281
- JosephonLTungCHMooreAWeisslederRHigh-efficiency intracellular magnetic labeling with novel superparamagnetic-Tat peptide conjugatesBioconjug Chem199910218619110077466
- StollGWesemeierCGoldRSolymosiLToykaKVBendszusMIn vivo monitoring of macrophage infiltration in experimental autoimmune neuritis by magnetic resonance imagingJ Neuroimmunol20041491–214214615020074
- JoSKHuXKobayashiHDetection of inflammation following renal ischemia by magnetic resonance imagingKidney Int2003641435112787394
- KannoSLeePCDoddSJWilliamsMGriffithBPHoCA novel approach with magnetic resonance imaging used for the detection of lung allograft rejectionJ Thorac Cardiovasc Surg2000120592393411044319
- TangTHowarthSPMillerSRAssessment of inflammatory burden contralateral to the symptomatic carotid stenosis using high-resolution ultrasmall, superparamagnetic iron oxide-enhanced MRIStroke20063792266227016917091
- TrivediRAMallawarachiCU-King-ImJMIdentifying inflamed carotid plaques using in vivo USPIO-enhanced MR imaging to label plaque macrophagesArterioscler Thromb Vasc Biol20062671601160616627809
- WeisslederRStarkDDEngelstadBLSuperparamagnetic iron oxide: pharmacokinetics and toxicityAJR Am J Roentgenol198915211671732783272
- CorotCRobertPIdeeJMPortMRecent advances in iron oxide nanocrystal technology for medical imagingAdv Drug Deliv Rev200658141471150417116343
- WangYXHussainSMKrestinGPSuperparamagnetic iron oxide contrast agents: physicochemical characteristics and applications in MR imagingEur Radiol200111112319233111702180
- OishiKNoguchiHSaitoHCell labeling with a novel contrast agent of magnetic resonance imagingCell Transplant201019688789220587147
- BowenCVZhangXSaabGGareauPJRuttBKApplication of the static dephasing regime theory to superparamagnetic iron-oxide loaded cellsMagn Reson Med2002481526112111931
- Oude EngberinkRDvan der PolSMDoppEAde VriesHEBlezerELComparison of SPIO and USPIO for in vitro labeling of human monocytes: MR detection and cell functionRadiology2007243246747417456871
- MatsushitaTKusakabeYFujiiHMuraseKYamazakiYInflammatory imaging with ultrasmall superparamagnetic iron oxideMagn Reson Imaging201129217317820850245
- Daldrup-LinkHERudeliusMOostendorpRATargeting of hematopoietic progenitor cells with MR contrast agentsRadiology2003228376076712881578
- MatuszewskiLPersigehlTWallACell tagging with clinically approved iron oxides: feasibility and effect of lipofection, particle size, and surface coating on labeling efficiencyRadiology2005235115516115749976
- WeisslederRChengHCBogdanovaABogdanovAJrMagnetically labeled cells can be detected by MR imagingJ Magn Reson Imaging1997712582639039625
- SchoepfUMarecosEMMelderRJJainRKWeisslederRIntracellular magnetic labeling of lymphocytes for in vivo trafficking studiesBiotechniques19982446426466486519564539
- FrankJAMillerBRArbabASClinically applicable labeling of mammalian and stem cells by combining superparamagnetic iron oxides and transfection agentsRadiology2003228248048712819345
- WunderbaldingerPJosephonLWeisslederRTat peptide directs enhanced clearance and hepatic permeability of magnetic nanoparticlesBioconjug Chem200213226426811906263
- BulteJWKraitchmanDLIron oxide MR contrast agents for molecular and cellular imagingNMR Biomed200417748449915526347
- BulteJWVymazalJBrooksRAPierpaoliCFrankJAFrequency dependence of MR relaxation times. II. Iron oxidesJ Magn Reson Imaging1993346416488347958
- ZhuXMWangYXLeungKCEnhanced cellular uptake of aminosilane-coated superparamagnetic iron oxide nanoparticles in mammalian cell linesInt J Nanomedicine2012795396422393292
- KunzmannAAnderssonBVogtCEfficient internalization of silica-coated iron oxide nanoparticles of different sizes by primary human macrophages and dendritic cellsToxicol Appl Pharmacol20112532819321435349
- MajumdarSZoghbiSSGoreJCPharmacokinetics of superparamagnetic iron-oxide MR contrast agents in the ratInvest Radiol19902577717772391194