 ?Mathematical formulae have been encoded as MathML and are displayed in this HTML version using MathJax in order to improve their display. Uncheck the box to turn MathJax off. This feature requires Javascript. Click on a formula to zoom.
Abstract
Purpose
To evaluate the diagnostic performance of gold nanorod (GNR)-enhanced optoacoustic imaging employing a conventional echographic device and to determine the most effective operative configuration in order to assure optoacoustic effectiveness, nanoparticle stability, and imaging procedure safety.
Methods
The most suitable laser parameters were experimentally determined in order to assure nanoparticle stability during the optoacoustic imaging procedures. The selected configuration was then applied to a novel tissue-mimicking phantom, in which GNR solutions covering a wide range of low concentrations (25–200 pM) and different sample volumes (50–200 μL) were exposed to pulsed laser irradiation. GNR-emitted optoacoustic signals were acquired either by a couple of single-element ultrasound probes or by an echographic transducer. Off-line analysis included: (a) quantitative evaluation of the relationships between GNR concentration, sample volume, phantom geometry, and amplitude of optoacoustic signals propagating along different directions; (b) echographic detection of “optoacoustic spots,” analyzing their intensity, spatial distribution, and clinical exploitability. MTT measurements performed on two different cell lines were also used to quantify biocompatibility of the synthesized GNRs in the adopted doses.
Results
Laser irradiation at 30 mJ/cm2 for 20 seconds resulted in the best compromise among the requirements of effectiveness, safety, and nanoparticle stability. Amplitude of GNR-emitted optoacoustic pulses was proportional to both sample volume and concentration along each considered propagation direction for all the tested boundary conditions, providing an experimental confirmation of isotropic optoacoustic emission. Average intensity of echographically detected spots showed similar behavior, emphasizing the presence of an “ideal” GNR concentration (100 pM) that optimized optoacoustic effectiveness. The tested GNRs also exhibited high biocompatibility over the entire considered concentration range.
Conclusion
An optimal configuration for GNR-enhanced optoacoustic imaging was experimentally determined, demonstrating in particular its feasibility with a conventional echographic device. The proposed approach can be easily extended to quantitative performance evaluation of different contrast agents for optoacoustic imaging.
Introduction
Optoacoustic imaging, also known as photoacoustic imaging, is an emerging noninvasive and nonionizing imaging modality that combines high sensitivity and elevated contrast of optical imaging with spatial resolutions and penetration depths typical of ultrasound-based techniques.Citation1–Citation3 In fact, the penetration depth achievable with high-resolution optical imaging techniques is limited to a few millimeters, while optical techniques using incoherent light extend the penetration depth to several centimeters but severely sacrifice spatial resolution.Citation4–Citation6 Optoacoustic imaging reaches a much more suitable compromise by exploiting the photoacoustic effect,Citation7 achieving increased penetration depths with respect to pure optical methods and improved tissue differentiation with respect to conventional acoustic techniques.Citation8
Thanks to the significant optical absorption of hemoglobin, optoacoustic imaging has already been applied to in vivo visualization of human vessel networks (eg, breast tumor microvasculature,Citation9,Citation10 forearm vasculatureCitation11). However, in order to extend the potential of this new technique to molecular imaging applications, several research groups are currently working to exploit the unique optical properties of noble metal nanoparticles (NPs), whose surface plasmon resonance results in a strong absorption of the incident laser energy, with the subsequent generation of detectable ultrasound (US) waves.Citation8,Citation12
Numerous plasmonic NPs have been recently developed and tested as potential contrast agents (CAs) for optoacoustic imaging.Citation3,Citation13–Citation16 In most cases gold is the metal of choice, due to its high stability, facile chemistry, and easy bioconjugation,Citation12,Citation17 as well as its generally benign toxicity profile.Citation15,Citation18–Citation21 Therefore, various types of gold NPs have been experimentally tested as optoacoustic CAs, such as nanospheres,Citation4 nanoshells,Citation22 hollow nanospheres,Citation14 nanobeacons,Citation3 and nanocages,Citation23 but the class of NPs most significantly explored for optoacoustic imaging applications is represented by gold nanorods (GNRs),Citation8,Citation15,Citation24–Citation28 which are also attracting increasing interest because of their exceptional ability to accumulate in tumorsCitation29 and their potential for simultaneous photothermal therapy.Citation30,Citation31
Nevertheless, important issues related to the application of GNR-enhanced optoacoustic imaging still hinder its translation into clinical routine. Major concerns are related to: (1) laser-induced degradation of GNRs during the imaging procedure, which is accompanied by drastic changes in both the toxicity profile and the optical-absorption spectrum of irradiated NPs,Citation32–Citation34 thus potentially affecting both imaging safety and effectiveness; (2) potential pitfalls due to anisotropic propagation of optoacoustic signals, which makes the investigation of possible preferential directions in GNR-emitted signals a crucial issue for determining the optimal relative placement of laser and US devices during diagnostic procedures; and (3) lack of experimental data quantifying the sensitivity of commercial echographic devices to small-volume variations of low-concentration GNRs, whose determination represents a sine qua non condition for future applications of this method for therapeutic treatment monitoring and patient follow-up.Citation24 On the contrary, most recent papers on optoacoustic imaging developmentCitation10,Citation15,Citation24,Citation26,Citation28 are still based on the employment of dedicated US systems requiring time-consuming scanning procedures and image reconstruction algorithms, which actually constitute a further obstacle for a successful clinical translation.
In this study, we investigated all these aspects in a novel experimental setup containing a custom-designed tissue-mimicking phantom that allowed us to study the effects of all the main parameters influencing the optoacoustic performance of GNRs. The following specific aims were addressed: (1) determination of GNR degradation during the imaging procedure as a function of both laser fluence and exposure duration; (2) assessment of possible anisotropies in optoacoustic signal propagation for different sets of experimental conditions; and (3) quantification of the optoacoustic contrast enhancement produced by GNRs in low concentrations and variable sample volumes on images acquired with a conventional echographic device.
Finally, since recent literature has documented that cytotoxicity of gold NPs can follow complex size-dependent patterns,Citation35–Citation38 being also variable between different cell types,Citation36,Citation39–Citation41 we quantified the biocompatibility of our employed GNRs through MTT (3-[4,5-dimethythiazol-2-yl]-2,5-diphenyl tetrazolium bromide) assays performed on two different cell lines.
Materials and methods
Materials
Hexadecyltrimethylammoniumbromide (CTAB), benzyldimethylammoniumchloride hydrate (BDAC), gold(III) chloride trihydrate (HAuCl4), sodium borohydride (NaBH4), silver nitrate (AgNO3), l-ascorbic acid, and MTT were purchased from Sigma-Aldrich (Milan, Italy). HS-PEG3000-OH was purchased from Rapp Polymere (Tuebingen, Germany). Fetal bovine serum, Dulbecco’s modified Eagle’s medium, l-glutamine, penicillin-streptomycin, phosphate-buffered saline, trypsin, and dimethyl sulfoxide were purchased from Euroclone (Milan, Italy). All chemicals were used as received. Ultrapure-grade water with a conductivity of 18.2 MΩ was used in all the experiments.
Synthesis of GNRs
GNRs were synthesized through a procedure based on the seeded-growth method.Citation42 Spherical Au seeds were prepared first by chemical reduction of HAuCl4, followed by their anisotropic growth by using a binary surfactant mixture composed of BDAC and CTAB, which allows for obtaining NRs with an aspect ratio higher than 4.5Citation42 (where the “aspect ratio” represents the ratio of the major axis length to that of the minor axis). By controlling the relative concentrations of the gold seeds and of the growth solution, it was possible to obtain GNRs absorbing in the near-infrared (NIR) spectral region.
In detail, 0.5 mL of an aqueous solution of 0.2 M of CTAB was added to 0.5 mL of a 0.5-mM aqueous solution of HAuCl4, obtaining a light-yellow solution. Then, 60 μL of a 0.01-M NaBH4 solution, prepared using ice-cold water, was added. The solution was mixed and kept in a water bath at 30°C for 1 hour before use. A binary surfactant mixture of BDAC and CTAB was then used to grow NRs with a maximum plasmon band around 1100 nm. The mixture was prepared by sonicating 0.05 g (1.3 × 10⁻⁴ mol) of CTAB in 5 mL of 0.15 M BDAC for 20 minutes at 40°C. At this point, the Au precursor solution (5 mL of a 1-mM aqueous HAuCl4 solution) was added, and after gentle mixing, 200 μL of 4 mM AgNO3 was added. Finally, ascorbic acid (70 μL of 0.0778 M ascorbic acid in water) was used as reducing agent. The growth was carried out for 2 hours after addition of 12 μL of the seed solution prepared, as described before. The NRs were purified through controlled precipitation by centrifugation (8600 g, 30 minutes), removal of the solvent, and redispersion in freshwater. This purification step was repeated three times.
In order to increase the biocompatibility of the nanorods, a ligand-exchange procedure was carried out. An excess of thiolated polyethylene glycol (PEG) ligand (HS-PEG3000-OH, 200 mg) was added to a solution of GNRs in water (1.5 mL, 5 nM), and the mixture left to react overnight. The NRs were purified through controlled precipitation by centrifugation (8600 g, 30 minutes), removal of the solvent, and redispersion in freshwater. This purification step was repeated three times, yielding the final PEG-coated GNRs used in the following experiments.
It is important to observe that the PEG molecule employed binds to the surface of the nanocrystals by forming a stable covalent bond between the thiol group and the gold atoms, while exposing the terminal hydroxyl groups (–OH) to the environment. These highly biocompatible ligands replace the CTAB molecules originally covering the surface of the as-synthesized NRs, which instead are known to be highly toxic.Citation43,Citation44 Successful PEGylation of GNRs was verified through zeta-potential measurements of the GNRs in water before and after the ligand-exchange procedure, as described in the next section.
Physicochemical characterization of GNRs
Transmission electron microscopy and absorption spectroscopy
Size and morphology of the PEG-coated GNRs were evaluated by transmission electron microscopy (TEM) using a Jeol Jem 1011 microscope operated at 100 kV. The sample was prepared by placing a few drops of colloidal gold solution of nanocrystals onto carbon-coated copper grids and evaporating it at room temperature in a fume hood.
Optical-absorption measurements of the samples were carried out using a Cary 5000 ultraviolet visible (UV-vis) NIR spectrophotometer (Varian, Palo Alto, CA). All measurements were performed at room temperature on solutions of GNRs dispersed in water in quartz cuvettes with a 1-cm path length.
Dynamic light-scattering and zeta-potential measurements
A Zetasizer Nano ZS90 (Malvern, PA, USA) equipped with a 4.0-mW He–Ne laser operating at 633 nm and an avalanche photodiode detector was used to measure the size distribution of the GNRs obtained and to verify the effectiveness of the PEGylation procedure. Measurements were made at 25°C in aqueous solutions (pH 7) of the particles. The values were determined using the Smoluchowsky approximation (f[ka] = 1.5), and they were estimated as the average of 20 repeated measurements.
In particular, during size-distribution measurements, the He–Ne laser was used to provide a light source to illuminate the sample particles in solution within the instrument cell, while the avalanche photodiode detector was used to measure the intensity of the corresponding scattered light. Once the detector measured the scattered light, this was converted to the size of the particles. Finally, the computer elaborated a graph representing the size distribution of the particles in solution.
Elemental analysis
The concentration of the GNR stock solution was determined by elemental analysis, carried out by inductively coupled plasma atomic emission spectroscopy (ICP-AES) with a Varian Vista AX spectrometer by measuring the Au content of the purified samples. Samples were dissolved overnight in 1 mL of concentrated HCl/HNO3 (3:1, volume/volume), diluted to 5 mL with ultrapure water, and the resulting solution was analyzed directly.
Preliminary degradation tests on gold nanorods
Before testing the optoacoustic behavior of the GNRs, we investigated their stability under laser irradiation, in order to determine the most suitable parameter configuration to be adopted in the subsequent optoacoustic experiments.
Preliminary irradiation tests with an Nd:YAG pulsed laser (Spectra-Physics Quanta-Ray GCR-190-10; Newport, Mountain View, CA) emitting at a wavelength of 1064 nm were performed by directing 10-ns pulses from the top into an open vial containing 250 μL of a 40-pM GNR solution. The laser-beam area was expanded using a homebuilt beam expander and was carefully aligned to the center of the vial, in order to illuminate the solution uniformly and at the same time to avoid irradiation of the wall. The energy levels of laser pulses were adjusted by directly varying the flashlamp-discharge voltage.
GNR stability was studied as a function of both laser fluence and exposure duration. Seven samples were tested at a repetition rate of 10 Hz: the laser beam irradiated the sample for either 20 seconds (samples 1–3) or 40 seconds (samples 4–6) employing a constant laser fluence (30 mJ/cm2 for samples 1 and 4, 60 mJ/cm2 for samples 2 and 5, 90 mJ/cm2 for samples 3 and 6), then the laser beam was interrupted through a shutter. Furthermore, GNR degradation after consecutive exposure to three different and progressively increasing laser fluences (30, 60, and 90 mJ/cm2; 20-second exposure for each fluence) was also checked (sample 7). Each sample was analyzed in triplicate.
Taking into account the fact that the employed laser-beam area was about 0.5 cm2, the energy delivered by single laser pulses to the GNR solution at each of three considered laser fluences was 15 mJ, 30 mJ, and 45 mJ, respectively. Therefore, given the constant pulse-repetition rate (10 Hz), each second of pulsed irradion on GNRs was equivalent to 1 second of continuous wave irradiation at a power of 150 mW, 300 mW, and 450 mW, respectively. GNR changes in optical properties and morphology were monitored by UV-vis-NIR spectroscopy and TEM analysis, respectively.
Optoacoustic experiments
Phantom construction
The phantom employed for the optoacoustic experiments of this study consisted of a tissue-mimicking hydrogel blockCitation45–Citation47 equipped with shaped housings for GNR sample solutions and contained in a polymeric box, specifically designed to allow the acquisition of GNR-emitted photoacoustic waves through different US probes in various configurations.
The box (8 × 7 × 4 cm) was fabricated by means of stereolithography,Citation48–Citation52 a technique that has also been recently used by our research group for highly accurate phantom reproductions of human organs.Citation53 Details of the phantom box adopted in this study are illustrated in .
Figure 1 Computer-aided design model of the phantom box (A and B) and corresponding pictures of the employed tissue-mimicking phantom (C–E). (A) Global 3-D view of the box; (B) main cross section of the box; (C) phantom top view; (D) phantom lateral view; (E) phantom bottom view.
Note: Main phantom parts are indicated in the figure (see the text for further details).
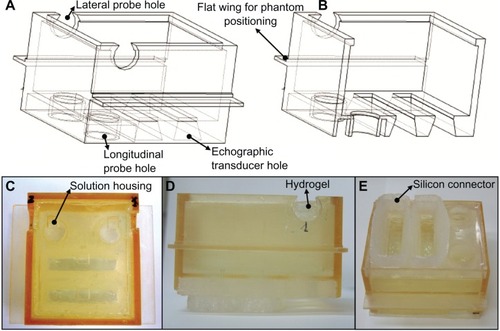
The holes at the bottom of the box fitted the dimensions of either a single-element US probe (circular holes, 16 mm in diameter) or a linear echographic transducer (rectangular holes, 55 × 12 mm) and each of them was aligned with a corresponding solution housing in the hydrogel, in order to receive the photoacoustic waves generated in the “longitudinal” direction. The additional circular holes placed in the lateral walls of the box, and in turn aligned with two solution housings, allowed the use of further single-element probes to acquire the signals emitted in the “lateral” direction. The two flat wings on the box’s lateral walls were designed to facilitate the stable phantom positioning on a specific supporting device.
The tissue-mimicking hydrogel was synthesized by cross-linking a water solution of carboxymethyl cellulose sodium salt and hydroxyethyl cellulose, using divinylsulfone as a cross-linking agent.Citation45–Citation47 After the mixing stage, an alkaline water solution of potassium hydroxide was added as a catalyst, and the resulting solution was poured into the phantom box, according to the following procedure. Before filling, the top of the box was sealed by means of a silicon layer, fabricated using a proper resin mold in turn realized by means of stereolithography, which presented four precisely positioned and shaped “bumps” (aimed at creating the corresponding solution housings directly into the hydrogel mass) and two circular stoppers (to close the lateral holes of the box). The box was then placed upside down on a flat surface and the hydrogel solution was poured through one of the bottom holes, being careful to avoid bubble formation. After 12 hours at room temperature, a complete hydrogel cross-link occurred: it was possible to remove the silicon layer, and the phantom was ready for use.
shows the finally obtained phantom, also equipped with a custom-designed silicon connector sealed on the bottom in order to ensure the proper alignment of echographic transducers with the corresponding holes. Two different versions of the phantom were prepared, differing in the shape of the 6-mm-deep solution housings, which were manufactured with either a square base (7 × 7 mm, which is the case shown in ) or a circular one (6 mm in radius).
Experimental acquisitions with single-element ultrasound probes
schematically illustrates the experimental setup realized for the acquisition of GNR-emitted photoacoustic waves through single-element US probes.
Figure 2 Scheme of the experimental setup adopted for studying the optoacoustic behavior of gold nanorods (GNRs).
Note: Main setup characteristics are indicated in the figure (see the text for further details).
Abbreviation: US, ultrasound.
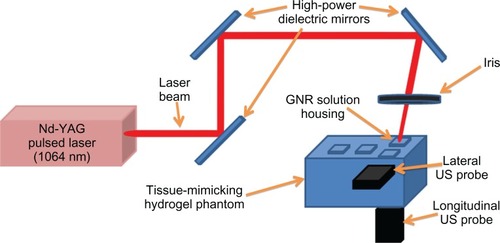
Laser irradiation of GNR solutions was obtained through the Nd:YAG laser, lasing 1064-nm 10-ns pulses at a pulse-repetition rate of 10 Hz. By employing apposite high-power dielectric mirrors and an iris, the laser beam was directed to illuminate just the phantom housing containing the GNR solution under testing. Two single-element unfocused US probes, both having a center frequency of 1 MHz and a diameter of 16 mm (V-303-SU; Panametrics, Waltham, MA), were inserted in the corresponding phantom box holes (coupled to the tissue-mimicking hydrogel by means of US coupling gel), in order to receive the photoacoustic signals along both the “longitudinal” and the “lateral” directions. Laser fluence was ∼30 mJ/cm2 (ie, about 30% of the maximum permissible exposure for the skin at a laser wavelength in the NIR spectral rangeCitation54), and incidence angle of the laser beam was about 70°, in order to avoid direct interaction between the laser beam and the US probe surface. The acoustic waveforms received were 10-dB amplified by two US receivers (5077PR and 5073PR; Panametrics), then recorded at a sampling rate of 100 MHz (14 bits) by a data-acquisition board (PCI-5122; National Instruments, Austin, TX) synchronized to the laser and stored on a computer for off-line analysis. Signal acquisition and data transfer were controlled using LabVIEW (National Instruments).
Effectiveness of aqueous solutions of GNRs in generating detectable photoacoustic signals was evaluated by irradiating for 20 seconds either samples of constant volume (100 μL) containing variable GNR concentrations (from 25 to 200 pM, corresponding to the range 1.5 × 10¹⁰–1.2 × 10¹¹ GNRs/mL) or samples of different volumes (range 50–200 μL) at a fixed concentration (100 pM, 6 × 10¹⁰ GNRs/mL). Pure water was also irradiated in the same conditions and considered as a control for confirming that US signals detected when irradiating the samples were caused by GNRs and not by the pure solvent. For each considered combination of sample volume and concentration, three different solutions were prepared and separately irradiated within the described setup (results reported in the next section represent the corresponding average values).
Experimental acquisitions with echographic transducer
In order to assess the potential exploitability of GNR-emitted photoacoustic signals in a clinical context, the experiments described in the previous paragraph were repeated employing the same phantom (in the version with squared solution housings) and the same laser settings combined with a different US acquisition system.
The GNR solutions to be tested were deposited in the phantom housings aligned with the box’s rectangular holes, in which a linear echographic transducer (LA532; Esaote, Florence, Italy) was inserted and coupled to the phantom matrix by means of coupling gel. The transducer was linked to a conventional clinically available digital echograph (Megas GPX; Esaote Spa), in turn connected via optic fiber to a prototype platform for acquisition of unprocessed radio-frequency (RF) data (Femmina, ElEn, Florence, Italy).
The transducer was employed in “receiving-only” mode (ie, it did not emit any US signal), and 200 frames of RF data were acquired during each 20-second solution irradiation and stored in the Femmina hard disk for off-line analysis. A conventional echographic image was also acquired before each laser irradiation, in order to verify the proper transducer positioning and its reproducibility.
Optoacoustic data analysis
Off-line analysis of acquired signals and images was conducted employing different software tools and custom-implemented algorithms, depending on the specific experimental setup employed for the corresponding acquisition, as detailed in the following sections.
Single-element probe data
US signals received by single-element probes were processed through LabVIEW algorithms specifically implemented for the purposes of this study.
For each irradiated solution, a sequence of 200 signals was acquired by each employed probe. In the first step of offline analysis, all the signals were band-pass–filtered in order to cancel noise contribution external to the probe frequency band (0.3–1.8 MHz). Taking into account the sound-propagation velocity in the employed tissue-mimicking material (1560 m/secondCitation46), the phantom geometry and the time instants of synchronized laser pulse emission, a 6-μs rectangular window was then used to select on each signal the portion containing the waveform to be analyzed (corresponding to the photoacoustic pulse emitted by the considered solution as a consequence of laser irradiation). In the next analysis step, the absolute value |V(t)| was computed for each windowed signal V(t) and the corresponding mean value |V(t)|m was calculated using the following formula:
The same analysis was conducted on the signals acquired during pure-water irradiation, and the resulting average value was subtracted from the <|V(t)|m> value of each considered sequence, identifying the finally obtained value <|V(t)|m>eff as the “optoacoustic signal amplitude” associated with the corresponding combination of GNR concentration, sample volume and acquisition direction:
The values of photoacoustic signal amplitude were separately plotted as a function of GNR concentration and sample volume for both the considered acquisition directions.
In order to further emphasize the specific variation of photoacoustic signal amplitude produced by each adopted increment in GNR concentration, for each considered concentration level, we also computed the rate of enhancement (RoE) with respect to the preceding lower concentration level, according to the following formula:
Echographic transducer data
Each RF data frame acquired by the echographic transducer was composed of 178 echographic tracks with 4600 points/track. The occurrence of optoacoustic pulses could be detected as the appearance of hyperintense clusters of pixels, called “spots,” over a completely black background.
A custom-developed algorithm was implemented using the Fortezza software in order to detect automatically the presence of spots in each acquired image frame and to measure the corresponding intensity (that was identified as the maximum value among the intensities of single pixels belonging to the considered spot). The intensity of the optoacoustic signal associated with each tested combination of GNR concentration, and sample volume was calculated as the average intensity of the spots detected in the corresponding frame sequence divided by the average of the maximum intensities measured in each frame of a sequence acquired during pure-water irradiation.
We also studied the spatial distribution of spot intensity within the solution housing: in each frame acquired at a given GNR concentration, the area corresponding to the solution housing was divided into seven 1-mm-wide regions of interest, and the average intensity of the spots occurring in each region of interest was plotted as a function of lateral distance from the solution housing center.
Biocompatibility tests
The actual biocompatibility of our GNRs was directly and specifically quantified through MTT assays performed on two different cell lines, as detailed in the following sections.
Cell culture and treatment with GNRs
Human epithelial adenocarcinoma cell line (HeLa) and human breast cancer cell line MCF-7 were maintained in Dulbecco’s modified Eagle’s medium supplemented with 10% fetal bovine serum, 2 mM L-glutamine and penicillin-streptomycin (5 mg/mL). Cells were grown at 37°C in a 95% humidified, 5% CO2 atmosphere.
HeLa and MCF-7 cells were plated into 96-well plates at a density of 2.0 × 10⁴ cells/mL in 100 μL of culture medium. After a 12-hour incubation, the medium was removed from each well and replaced with 100 μL of fresh GNR suspension at variable concentration (50, 100, and 200 pM) prepared in complete medium. Cells were further incubated for 24, 48, and 72 hours with GNRs before the MTT viability assay was performed. In each experiment, H2O2 (20 mM) was used as a cell death–positive control, while cells not exposed to particles served as negative controls.
MTT assay
The MTT viability assay was performed to estimate the cytotoxicity of the GNRs to the two considered cell lines. At least three independent experiments were conducted for each cell line, and six replicate wells were employed for each tested GNR concentration in each independent experiment.
After 24, 48, and 72 hours of GNR exposure, the medium was removed, the cells were washed with phosphate-buffered saline, and a solution containing 0.5 mg/mL of MTT dissolved in culture medium was added to each well. After 3 hours’ incubation at 37°C, the MTT, reduced by the mitochondrial reductase of vital cells, formed a dark insoluble product – formazan. At this point, the medium was removed and the dark pellet was dissolved in dimethyl sulfoxide, leading to a violet solution whose absorbance at 570 nm was measured with Epoch Multi-Volume Spectrophotometer System (BioTek, Winooski, VT). The viability percentage was expressed as the relative growth rate (RGR) by the equation:
All the described cytotoxicity assays were performed according to the protocol described in the ISO 10993-5 international guide.Citation55
Statistical analysis was carried out using Student’s t-test; differences were considered statistically significant when P-value was less than 0.01.
Results
GNR physicochemical characterization
The synthesized GNRs presented a length of 55 ± 5 nm and a diameter of 8 ± 1 nm, with a resulting aspect ratio of about 6.9, as observed by TEM microscopy (). UV-vis-NIR spectroscopic analysis showed that as expected, the nanocrystals presented two peaks in their absorption spectrum, corresponding to the transverse and the longitudinal plasmon resonance bands, centered at 525 nm and 1057 nm, respectively ().
Figure 3 (A and B) Characterization of the polyethylene glycol–coated gold nanorods. (A) Transmission electron microscopy image (scale bar is 100 nm); (B) ultraviolet-visible near-infrared absorption spectrum.
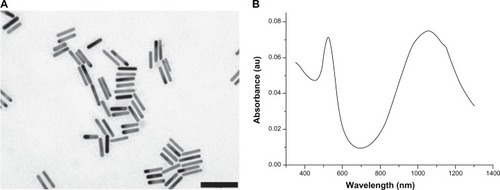
Successful PEGylation of the GNRs was confirmed by zeta-potential measurements of the NPs in water before and after the ligand-exchange procedure. As expected, the as-synthesized GNRs showed a positive zeta-potential value (+38.0 ± 0.8 mV) because of the quaternary amine of the CTAB surfactants; on the other hand, PEG-coated GNRs showed an almost neutral surface charge (−2.0 ± 0.4 mV), in accordance with results available in the literature.Citation35,Citation56
Dynamic light-scattering analysis showed that the GNRs were highly monodispersed, with an average hydrodynamic diameter in water of 62 ± 6 nm.
The concentration of atomic gold in the stock solution was determined to be 4 nM by ICP-AES. The average volume of a single GNR calculated through TEM analysis yielded a GNR density of approximately 2.4 × 10¹² GNRs/mL.
Laser irradiation effects and parameter selection
Stability under laser irradiation was evaluated as a function of either laser fluence and exposure duration through UV-vis-NIR spectroscopy and TEM analysis. summarizes the average normalized data derived from the UV-vis-NIR spectra of aqueous solutions of GNRs acquired after each irradiation performed.
Figure 4 Normalized optical densities of gold nanorods (GNRs) at 1064 nm after exposure to laser fluences of 30, 60, and 90 mJ/cm2 for 20 seconds (black triangles) and 40 seconds (white triangles), and consecutively to the three different laser fluences for 20 seconds each time (white circle).
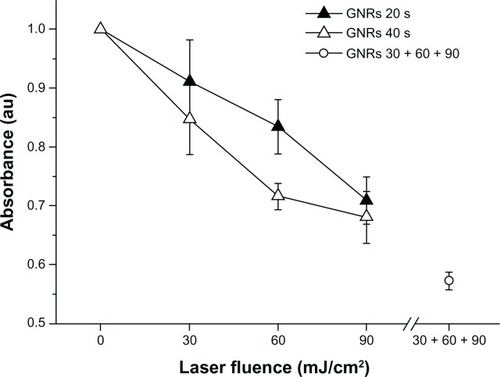
Exposure of the nanocrystals to the laser for 20 seconds decreased their longitudinal absorption peak almost linearly with increasing laser fluences (see , full triangles), with the minimum tested value (30 mJ/cm2) providing a normalized optical density very close to that of the starting GNR (reduction < 10%). A similar degradation trend, although slightly more pronounced, was observed when the samples were exposed to each laser fluence for 40 seconds (see , empty triangles), while the consecutive irradiation of the same sample with the three increasing laser fluences led to a marked reduction in the longitudinal absorption peak to less than 60% of its initial value (see , empty circle).
The corresponding morphological changes were investigated by TEM analysis: shows TEM images of the GNRs irradiated with different combinations of laser fluence and exposure duration. The harshest adopted laser parameters led to the transformation of most GNRs into nearly spherical particles with diameters ranging from 10 to 20 nm, although smaller and bigger particles could be also found, while the progressively milder conditions showed an increasing percentage of GNRs that were not modified by laser irradiation.
Figure 5 Transmission electron microscopy images of the gold nanorods after different laser exposures: (A) 30 mJ/cm2 for 20 seconds; (B) 60 mJ/cm2 for 40 seconds; (C) 90 mJ/cm2 for 40 seconds; (D) 30, 60, and 90 mJ/cm2 consecutively, for 20 seconds each time.
Note: Scale bars are 200 nm.
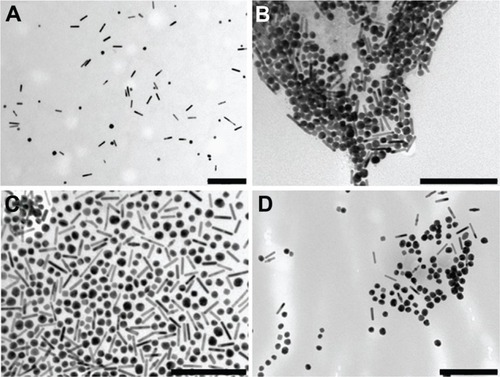
In summary, the GNRs showed an almost linear degradation pattern with increasing laser fluence. However, the smoothest conditions used in these experiments (30 mJ/cm2 irradiation for 20 seconds) caused only a negligible GNR degradation, yielding an absorption spectrum very similar to the starting one. This laser configuration was selected for the subsequent optoacoustic experiments.
Optoacoustic behavior of GNRs
The selected laser-exposure configuration was employed in combination with the experimental setup shown in to determine the effect of GNR concentration and sample volume on the amplitude of the corresponding optoacoustic signals.
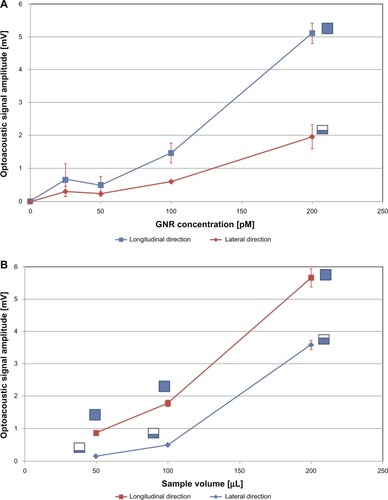
Laser irradiation of a constant volume of GNR solution (100 μL) produced optoacoustic amplitudes that increased proportionally with GNR concentration along both the considered propagation directions, and for each tested concentration (range 25–200 pM, 1.5 × 10¹⁰−1.2 × 10¹¹ GNRs/mL), the higher signal amplitude was found in the longitudinal direction (). Similar trends were also observed when GNR concentration was kept constant to a fixed value (100 pM, 6 × 10¹⁰ GNRs/mL) and samples of variable volume (50–200 μL) were exposed to the laser ().
Figure 6 (A and B) Optoacoustic signal amplitude as a function of acquisition direction. (A) Effect of gold nanorod (GNR) concentration (fixed sample volume: 100 μL); (B) effect of GNR sample volume (fixed sample concentration: 100 pM = 6 × 10¹⁰ part/mL).
Notes: The schematic sketches beside each curve represent the solution housing “seen” by the corresponding ultrasound probe in the considered experimental conditions (see Discussion for details). Error bars represent standard deviations.
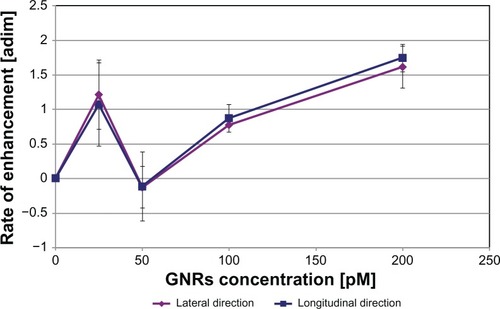
In order to better characterize the effect of GNR concentration on the amplitude of optoacoustic signals emitted along both the considered directions, we used EquationEquation 3(3) to calculate the RoE produced in optoacoustic signal amplitude by each specific increment in GNR concentration with respect to the preceding lower concentration level.
Two important aspects can be evidenced from the obtained results, reported in : (1) in the whole GNR concentration interval studied, the optoacoustic enhancements on the two considered directions followed very similar patterns: this represents a confirmation of the isotropic generation of photoacoustic signals by GNRs, because the same concentration increment simultaneously produces two analogous RoE values along two orthogonal directions; and (2) in the range 50–200 pM (3 × 10¹⁰−1.2 × 10¹¹ GNRs/mL), a significant enhancement of the optoacoustic amplitude occurs each time the concentration is doubled (enhancement is in the order of 80% for a doubling from 50 to 100 pM and in the order of 170% for a doubling from 100 to 200 pM).
Figure 7 Rate of enhancement (RoE) produced in optoacoustic signal amplitude by each increment in gold nanorod (GNR) concentration with respect to the preceding lower concentration level, for both the considered acquisition directions.
Note: RoE was calculated according to EquationEquation 3(3) (see the text for details).
Notes: Sample volume = 100 μL; error bars represent standard deviations.
The implications of the observed trends of optoacoustic signal amplitude for clinical employment of photoacoustic imaging will be discussed in detail in the Discussion section.
Detection of GNR-emitted optoacoustic signals with a conventional echographic device
Results presented in the previous paragraph were derived from the employment of experimental single-element US probes combined with data-analysis algorithms based on the application of EquationEquations 1(1) , Equation2
(2) , and Equation3
(3) . These techniques facilitate gaining insight into the intrinsic properties of acquired signals and in the underlying physical phenomena; however, in order to effectively discuss a potentially rapid translation of the developed methods into clinical practice, it is mandatory to verify their actual exploitability in the presence of clinically available imaging devices based on more conventional algorithms.
Therefore, the most interesting experiments performed with single-element US probes (ie, 20-second laser irradiations at 30 mJ/cm2 of GNR solutions of variable concentration and volume) were repeated employing a conventional clinically available echographic device.
Results reported in showed that normalized intensity of echographically detected optoacoustic spots confirmed the proportionality to GNR concentration in the considered range, also highlighting the presence of a sort of “optimal concentration” at about 100 pM (6 × 10¹⁰ GNRs/mL): concentrations in the range 0–50 pM produced spots whose average intensity was less than 10% higher than maximum intensities registered during pure-water irradiation, while a 100-pM GNR solution produced an enhancement of more than 60% with respect to maximum water intensity, and this value was only slightly increased by a further concentration increment to 200 pM (1.2 × 10¹¹ GNRs/mL).
Table 1 Normalized spot intensity as a function of gold nanorod (GNR) concentration (sample volume = 100 μL)
Nevertheless, as shown in , the average spot-intensity enhancement produced by laser irradiation of 100 μL of a 100-pM GNR solution was mostly saved even when sample volume was reduced to 50 μL (average spot intensity decreased by only 14%), while it was significantly amplified in the case of a doubling in sample volume (200 μL of 100 pM GNR solution produced an average spot intensity almost double with respect to the 100-μL case).
Table 2 Normalized spot intensity as a function of gold nanorod (GNR) sample volume (GNR concentration = 100 pM)
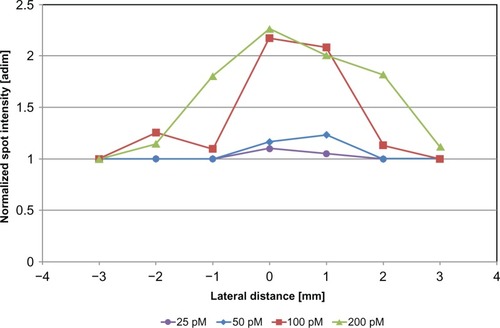
In order to characterize further the potential of GNRs as contrast agents for optoacoustic imaging, for each considered concentration level, we studied the spatial distribution of spot intensities within the solution housing by plotting the average spot intensity as a function of lateral distance from the housing center. The graph is shown in , visually confirming the presence of the previously identified “optimal concentration” and showing that for all the considered GNR concentrations, spot-intensity distribution presented a characteristic bell-like shape whose subtended area was proportional to the GNR concentration level.
Figure 8 Normalized average spot intensity as a function of lateral distance from the solution housing center for each considered gold nanorod concentration.
Biocompatibility of GNRs
summarizes the results obtained on cytotoxicity of our synthesized GNRs studied with human cell models (HeLa and MCF-7) through MTT tests performed at different time intervals (24, 48, and 72 hours) for the previously considered concentrations (50, 100, and 200 pM), according to protocols described in ISO 10993–5.Citation55
Figure 9 Viability of HeLa cells and MCF-7 cells determined by MTT test after 24 hours’ (A), 48 hours’ (B), and 72 hours’ (C) exposure to gold nanorods (GNRs) in different concentrations (50 pM, 100 pM, and 200 pM).
Notes: The dashed lines indicate a 70% cell viability; error bars represent standard deviations of three independent experiments. *Statistically significant difference with respect to the unexposed control (P < 0.01).
Abbreviation: MTT, (3-[4,5-dimethythiazol-2-yl]-2,5-diphenyl tetrazolium bromide).
![Figure 9 Viability of HeLa cells and MCF-7 cells determined by MTT test after 24 hours’ (A), 48 hours’ (B), and 72 hours’ (C) exposure to gold nanorods (GNRs) in different concentrations (50 pM, 100 pM, and 200 pM).Notes: The dashed lines indicate a 70% cell viability; error bars represent standard deviations of three independent experiments. *Statistically significant difference with respect to the unexposed control (P < 0.01).Abbreviation: MTT, (3-[4,5-dimethythiazol-2-yl]-2,5-diphenyl tetrazolium bromide).](/cms/asset/e2b5bcc7-0fc0-402e-8005-d3a23ede1bb2/dijn_a_33908_f0009_c.jpg)
After 24-hour incubation (), cell viability as a function of GNR concentration was almost constant for MCF-7 and showed a slight (not statistically significant) decrement for HeLa. After 48 hours (), the cell-viability pattern did not change for MCF-7, while HeLa showed a 25% reduction in cell viability in correspondence with 200 pM GNR concentration (P < 0.01). After 72-hour incubation (), MCF-7 also showed a cell-viability reduction (9%) at the highest considered GNR concentration, while the behavior of HeLa cells was the same as that shown at 48 hours.
Therefore, exposure to GNRs in concentrations up to 200 pM for 72 hours never caused significant decrements in MCF-7 cell viability; in the case of HeLa cells, a statistically significant viability reduction was observed only after a 72-hour incubation with a 200-pM GNR solution, indicating that HeLa cells are more sensitive to GNR exposure than MCF-7. However, in all the considered cases, cell viability was maintained well above 70% (minimum observed values were 91% for MCF-7 and 75% for HeLa, and these values rose to 99% and 93% respectively, when the suggested optimal concentration of 100 pM was employed). Consequently, according to the ISO 10993-5 international guide,Citation55 which classifies as a cytotoxic effect a reduction in cell viability by more than 30%, we can state that our synthesized GNRs, at least in the dosages adopted, have high biocompatibility since they did not cause cytotoxic effects in the cell lines studied.
Discussion
Stability of GNRs under laser irradiation
Experimental results reported in the previous section confirmed and extended the previously reported evidence on laser-induced shape changes of GNR solutions;Citation32–Citation34,Citation57 pulsed-laser irradiation of GNRs can lead to a rapid increase in electron temperature, causing an NP heating that can vary from a raise in temperature by only a few tens of degrees up to complete nanocrystal melting. The actual degree of NP heating is determined by several factors, including laser pump power, excitation wavelength, exposure duration, type, dimension, and surface coverage of the nanocrystals, medium in which the experiment is carried out, etc.Citation57 In general, femtosecond laser pulses can induce a shape transformation of the nanocrystal, eg, from rod to sphere, while nanosecond laser pulses are more likely to cause fragmentation into smaller particles.Citation57 However, the structural conversion of GNRs when exposed to intense laser pulses has already been studied in detail elsewhereCitation34,Citation57–Citation59 and is beyond the scope of this paper.
In this study, an optimal laser configuration was determined for obtaining effective GNR-enhanced optoacoustic imaging and only a minimal, negligible transformation of GNRs into nanospheres (see ). In fact, as expected, the morphological transformation rate of the GNRs into nanospheres resulted proportional to both laser fluence and exposure time. However, a limited number of gold nanospheres was observed by TEM imaging after irradiation at the mildest conditions used (laser fluence of 30 mJ/cm2 for 20 seconds), consistent with a corresponding absorption spectrum that was degraded by less than 10% (see ). These results are also in qualitative agreement with those of a previous paperCitation30 that reported a limited fragmentation and conversion to spherical shape for GNRs with an aspect ratio of 3.6 that underwent a 20-second irradiation employing 800-nm laser pulses at a fluence of 30 mJ/cm2.
The identification of such a configuration could significantly facilitate the clinical employment of GNR contrast agents for optoacoustic imaging, allowing the fruitful exploitation of GNR advantages over other possible NPs (mainly in terms of a stronger optical absorption at resonanceCitation8,Citation60 and of the possibility of being manufactured in a smaller size with respect to competitors with spherical symmetryCitation32,Citation60), combined with the retention of these properties for the entire duration of the diagnostic imaging procedure.
In order to verify further the latter concept in our experimental conditions, we also performed an additional 20-second laser irradiation on GNR samples that had been already irradiated. Optoacoustic signals were acquired along both the longitudinal and the lateral direction through single-element US probes and were analyzed as previously described. The behavior of re-irradiated samples was almost identical to that shown during the first series of optoacoustic experiments, confirming that, at least regarding effectiveness in optoacoustic emission, the first 20-second irradiation of GNRs did not appreciably affect their optical properties.
Effects of GNR concentration and sample volume on optoacoustic signal amplitude
Optoacoustic signal generation along a specific direction occurred proportional to both GNR concentration and sample volume ().
An explanation of the predominance of longitudinal optoacoustic amplitude over the lateral one can be sought in the sample area that is “seen” by each US probe (schematically illustrated by the sketches in ). In fact, referring for instance to the case of and taking into account the parallelepiped-like shape of the solution housings (having a base of 7 × 7 mm), a 100-μL sample filled the cavity up to a level of about 2 mm, implying that the optoacoustic emitting volume had its base (49 mm2) facing the longitudinal probe (whose piezoelectric surface is about 200 mm2) and only one of the lateral surfaces (about 14 mm2) facing the lateral probe, which is identical to the longitudinal one. Therefore, for each considered direction, we can define an “exposure factor” as the ratio between the optoacoustic emitting surface and the corresponding piezoelectric receiving surface (eg, in the mentioned case of a 100-μL sample, we obtain: “longitudinal exposure factor” = 49/200 = 0.245 and “lateral exposure factor” = 14/200 = 0.070).
In this context, taking into account the reasonable phantom homogeneity, the isotropic emission of photoacoustic signals by the GNRs, and the fact that the longitudinal path of the photoacoustic signals is longer than the corresponding lateral one, the sole attenuation phenomena would have caused a longitudinal signal weaker than the lateral one. Nevertheless, photoacoustic signal generation along a specific direction occurred proportional to the sample area in front of the corresponding US probe, and this phenomenon was shown to dominate acoustic attenuation, at least in our experimental conditions.
These considerations were quantitatively confirmed by the results reported in , showing the comparison between the ratio of longitudinal to lateral exposure factor and the ratio of longitudinal to lateral optoacoustic amplitude as a function of GNR sample volume. In fact, low volumes of GNR solution correspond to low filling levels in the solution housing, and consequently to small lateral areas emitting photoacoustic signals along the corresponding direction: this is the case of a 50-μL sample volume, which corresponds to a base area of 49 mm2 (longitudinal exposure factor = 0.245) and to a filling level of about 1 mm in the solution housing, giving a sample lateral area of about 7 mm2 (lateral exposure factor = 0.035). Therefore, the ratio of the exposure factors of the two transducers is 7, and this value is in good agreement with the optoacoustic amplitude ratio (). On the other hand, the progressive increment of sample volume caused a corresponding increment of the lateral exposure factor with respect to the constant longitudinal value: the ratio of optoacoustic amplitudes closely resembled the trend of exposure factor ratio ().
Table 3 Comparison between the ratio of longitudinal (long) to lateral (lat) exposure factor and the ratio of longitudinal to lateral optoacoustic amplitude as a function of gold nanorod (GNR) sample volume
A further confirmation of these findings was obtained by irradiating GNR solutions contained in the phantom with cylindrical solution housings (6 mm in radius). Actually, cylindrical housings had a significantly wider base area with respect to squared housings (113 mm2, corresponding to a longitudinal exposure factor of 0.565) and the measured optoacoustic amplitudes reflected this difference, especially in the higher part of the tested GNR concentration range (see squares and empty circles in ).
Figure 10 Optoacoustic signal amplitude measured in the longitudinal direction as a function of gold nanorod (GNR) concentration for differently shaped solution housings.
Notes: Cylindrical solution housings had a base area bigger than the square ones, and for this reason the measured optoacoustic amplitude was higher (uncorrected values). After multiplication for a correction factor taking into account the difference in base area, the trend of the optoacoustic amplitude measured in cylindrical solution housings became very similar to that measured in square housings (corrected values). Sample volume = 100 μL; error bars represent standard deviations.
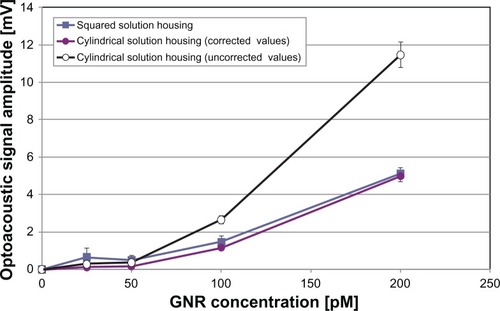
However, the multiplication of each optoacoustic amplitude measured in cylindrical housings by a correction factor that took into account the exposure factor ratio (0.43 = 0.245/0.565) was sufficient to reach an optimal agreement between the trends of optoacoustic signal amplitude measured in the differently shaped solution housings (see full circles and squares in ). On the other hand, signals received by the lateral probe were very weak, and this phenomenon was attributed to the curvature of the lateral surface of cylindrical housings, which was likely to cause a significant refraction-related dispersion of the photoacoustic pulses propagating toward the lateral probe, thus not allowing any quantitative analysis on such signals.
Further comments are required regarding the behavior of optoacoustic signal amplitude as a function of GNR concentration. Actually, the employment of single-element US probes allowed us to divide the studied concentration range into two intervals: 50–200 pM (1.5 × 10¹⁰−1.2 × 10¹¹ GNRs/mL), in which the optoacoustic signal amplitude was almost linearly proportional to GNR concentration (see , , and ), and 0–50 pM, which showed a quite irregular trend, sometimes characterized by a sort of peak in correspondence of 25-pM concentration (this is particularly evident in , in which RoE was plotted instead of optoacoustic amplitude). Taking into account that the lowest tested GNR concentrations were obtained by repeated dilutions from highly concentrated solutions, the observed behavior is probably attributable to some inefficiencies in the dilution procedure, in which the uncertainty of each dilution step is added to the previous one, leading to a final solution whose concentration level is affected by an elevated uncertainty. This observation finds confirmation in the relatively high standard deviation values typically observed in correspondence with 25-pM solutions.
On the other hand, a more regular behavior was found by analyzing the data acquired through the echographic transducer (see ). In this case, transducer sensibility is probably a bit too low to fully appreciate all the fluctuations of samples labeled as “25 pM,” whose detected spot intensity is located almost at the same level as water maximum intensity. This produces an optoacoustic intensity trend that slowly increases with GNR concentration up to 50 pM and then presents a marked jump passing from 50 to 100 pM, followed by a final modest increment when GNR concentration reaches a value of 200 pM.
Potential application of GNRs for clinical imaging tasks
Recent papers have underlined the need for accurate experimental studies of the optoacoustic signals emitted by low concentrations of GNRs, possibly including the employment of conventional clinically available echographic devices, since the most interesting results reported in the literatureCitation10,Citation15,Citation24,Citation26,Citation28 have been obtained employing dedicated US systems with time-consuming imaging procedures. They have also underlined that photoacoustic molecular imaging using GNRs as CAs in combination with a commercial echographic platform would have direct clinical potential (eg, for very early detection and monitoring of inflammatory responses).Citation24
The approach of the present study combined the adoption of a GNR concentration range (25–200 pM, corresponding to about 1.5 × 10¹⁰−1.2 × 10¹¹ GNRs/mL) that is lower than those employed in the majority of recent papersCitation15,Citation24–Citation26,Citation28 with the experimental determination of the most suitable laser irradiation parameters and the employment of a conventional echographic machine, in order to assure several simultaneous benefits.
In fact, maximum optoacoustic effectiveness was achieved thanks to the full exploitation of the intrinsic GNR properties and to the optimized operative parameters. A facilitated transferability into clinical contexts was also guaranteed due to the demonstrated effectiveness of the method employing clinically available US devices. Safety was preserved as well by both modest laser fluence (30 mJ/cm2, corresponding to 30% of the maximum permissible exposure for the skin at a laser in the NIR spectral range)Citation54 and documented absence of appreciable GNR degradation during the imaging procedure. A high biocompatibility was further guaranteed by the PEG coating and by the demonstrated absence of cytotoxic effects on different human cell lines (). Finally, it must be mentioned that there is enormous potential for future molecular imaging applications as a consequence of both the aforementioned advantageous small size of GNRs and their easy bioconjugation due to the strong binding affinity of gold with several antibodies and biomolecules.Citation12
Moreover, the relationships between GNR concentration or volume and the characteristics of corresponding optoacoustic signals were quantitatively investigated using either single-element US probes (see , , and and ) and a conventional echographic transducer (, , and ), not only contributing to novel quantitative insights in optoacoustic signal features but also leading to the following important clinical implications: (1) the substantial isotropy of GNR photoacoustic emission was experimentally confirmed, implying that the relative placement of laser and US devices does not affect signal-detection accuracy, and thus each time can be directly chosen by the clinician on the basis of specific patient characteristics and diagnostic investigation requirements; (2) the amplitude of GNR-emitted optoacoustic signals showed clear proportionalities to both GNR concentration and sample volume, thus being particularly suited for monitoring the temporal evolution of a targeted pathological tissue (eg, the growth of a tumor mass or its reduction as a consequence of a therapeutic treatment, since the signal proportionality to GNR concentration can be useful for diagnosing a variation in the spatial density of targeted diseased cells, while the proportionality to GNR sample volume at constant concentration can help in monitoring possible volumetric changes of a targeted object).
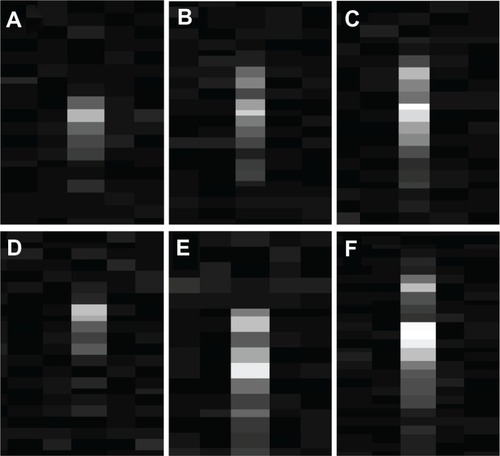
In order to provide a more concrete idea of the exploitability of the detected signals on a conventional echographic device, sample echographic images of “optoacoustic spots” acquired during laser irradiation of different GNR solutions are reported in .
Figure 11 (A–F) Sample echographic images of “optoacoustic spots” detected during laser irradiation at 30 mJ/cm2 of gold nanorod (GNR) solutions of variable volume and concentration. (A) GNR concentration = 25 pM, sample volume = 100 μL; (B) GNR concentration = 50 pM, sample volume = 100 μL; (C) GNR concentration = 200 pM, sample volume = 100 μL; (D) GNR concentration = 100 pM, sample volume = 50 μL; (E) GNR concentration = 100 pM, sample volume = 100 μL; (F) GNR concentration = 100 pM, sample volume = 200 μL.
Obviously, in order to actually extend our experimental results to clinical application, further in vivo verifications on animal models are necessary, especially to evaluate directly the possible effects of the GNR distribution in the target tissue. However, concerning this issue, reported studiesCitation15,Citation31 have documented feasible extensions to small animal models of previously in vitro–tested approaches for photoacoustic imaging, employing dedicated complex devices and time-consuming procedures for target scanning and image reconstruction. Therefore, these data lead us to hypothesize that the in vivo translation of our simpler imaging protocol would also be feasible, and the adopted method is expected to maintain its effectiveness in the in vivo case as well, at least for superficial pathological targets.
A further exciting perspective in this research field is the possibility of carrying out both diagnostic investigation and subsequent therapeutic treatment through a single GNR injection, so introducing a newer example of a “theranostic” approach. This could be especially feasible for cancer pathologies, since GNR-assisted photothermal therapy has recently emerged as a viable method for selective killing of cancer cells and shows promise for effective clinical translation.Citation31 In particular, it has been shown that the entity of the photothermal effect produced by GNRs following pulsed-laser irradiation is proportional to laser-exposure duration,Citation30 which should last for some minutes in order to achieve clinically useful therapeutic results.Citation30,Citation31 In this context, this study has added a direct demonstration of GNR diagnostic effectiveness for photoacoustic imaging investigations performed with conventional echographic devices, employing very low GNR concentrations and a safe laser-energy level. Since a few seconds of laser irradiation are enough for the photoacoustic investigation of a specific clinical target, we can conclude that once the target has been reached by an injected dose of GNRs, the following steps will in principle be feasible: (1) acquisition of photoacoustic diagnostic images thanks to a first short laser irradiation, without causing any appreciable perturbation of GNR structure; and (2) if a tumor is detected, a second prolonged laser irradiation could be used for selective photothermal ablation, the effectiveness of which could in turn be real-time monitored through simultaneous acquisition of photoacoustic images, also in order to tailor the most suitable duration of laser irradiation.
Conclusion
The diagnostic performance of GNRs for optoacoustic imaging was experimentally optimized in a novel tissue-mimicking phantom, employing both single-element US probes and a conventional clinically available echograph.
The most suitable values of laser parameters (30 mJ/cm2 fluence for 20 seconds of exposure) were determined in order to assure optoacoustic effectiveness, NP stability and safety of the imaging procedure in the presence of PEG-coated GNRs. The effects of GNR concentration and sample volume on GNR-emitted optoacoustic signals were separately investigated in very low ranges, showing the potential for the development of novel molecular imaging protocols and theranostic approaches.
An experimental confirmation for the isotropic emission assumption of GNR photoacoustic signals was also provided, introducing the definition of an “exposure factor” that takes into account the geometrical characteristics of both the GNR target volume and the receiving probe. This will enable a constraint-free relative positioning of laser and US devices during clinical diagnostic investigations, so extending the variety of accessible targets.
Clinical translation of reported results will actually be facilitated by the demonstrated detectability of “optoacoustic spots” through a conventional echographic device and by the absence of GNR-related cytotoxic effects, documented on two different human cell lines. Based on our obtained results, an “optimal” GNR concentration can be indicated in a 100-pM solution (corresponding to 6 × 10¹⁰ GNRs/mL).
Finally, this work presented a new experimental setup for the quantitative assessment of all the main parameters that influence the performance of CAs for optoacoustic imaging (laser settings, relative placement of laser source, and US transducer, concentration, and volume of CA solution, shape of CA volume, US probe features), therefore introducing a novel approach for a global performance evaluation of possible newer CAs for optoacoustic imaging.
Future studies will involve the determination of the most suitable parameter configuration for experimental investigation of innovative diagnostic and therapeutic paradigms on specific animal models, with the final goal of exploiting the enormous potential of the illustrated approach for future applications of optoacoustic molecular imaging and personalized medicine.
Acknowledgements
The authors thank Paolo Cazzato and Marco Esposito for their technical support in the use of the Nd:YAG laser. They also thank Rosanna Mastria for her kind assistance during GNR synthesis. These studies were partially supported by grant no DM18604 – Bando Laboratori – DD MIUR 14.5.2005 n.602/ Ric/2005 of the Italian Ministry of Instruction and Research.
Disclosure
The authors report no conflicts of interest in this work.
References
- WangLVMultiscale photoacoustic microscopy and computed tomographyNat Photonics2009350350920161535
- XuMHWangLHVPhotoacoustic imaging in biomedicineRev Sci Instrum200677122
- PanDPramanikMSenpanANear infrared photoacoustic detection of sentinel lymph nodes with gold nanobeaconsBiomaterials2010314088409320172607
- MallidiSLarsonTTamJMultiwavelength photoacoustic imaging and plasmon resonance coupling of gold nanoparticles for selective detection of cancerNano Lett200992825283119572747
- LaabsEBéhéMKossatzSOptical imaging of CCK2/gastrin receptor-positive tumors with a minigastrin near-infrared probeInvest Radiol20114619620121139504
- PoellingerAPersigehlTMahlerMNear-infrared imaging of the breast using omocianine as a fluorescent dye: results of a placebo-controlled, clinical, multicenter trialInvest Radiol20114669770421788905
- OraevskyAAKarabutovAAOptoacoustic tomographyVo-DinhTBiomedical Photonics HandbookBoca RatonCRC Press / Francis and Taylor Group2003
- EghtedariMOraevskyACoplandJAHigh sensitivity of in vivo detection of gold nanorods using a laser optoacoustic imaging systemNano Lett200771914191817570730
- ErmilovSAKhamapiradTConjusteauALaser optoacoustic imaging system for detection of breast cancerJ Biomed Opt20091402400719405737
- ManoharSVaartjesSEvan HespenJCGInitial results of in vivo non-invasive cancer imaging in the human breast using near-infrared photoacousticsOpt Express200715122771228519547596
- FronheiserMPErmilovSABrechtH-PReal-time optoacoustic monitoring and three-dimensional mapping of a human arm vasculatureJ Biomed Opt20101502130520459227
- JainPKEl-SayedIHEl-SayedMAAu nanoparticles target cancerNano Today200721829
- JainPKLeeKSEl-SayedIHCalculated absorption and scattering properties of gold nanoparticles of different size, shape, and composition: applications in biological imaging and biomedicineJ Phys Chem B20061107238724816599493
- LuWHuangQKuGPhotoacoustic imaging of living mouse brain vasculature using hollow gold nanospheresBiomaterials2010312617262620036000
- SongKHKimCMaslovKNoninvasive in vivo spectroscopic nanorod-contrast photoacoustic mapping of sentinel lymph nodesEur J Rad200970227231
- YangXSkrabalakSELiZYPhotoacoustic tomography of a rat cerebral cortex in vivo with Au nanocages as an optical contrast agentNano Lett200773798380218020475
- PanDPramanikMSenpanAA facile synthesis of novel self-assembled gold nanorods designed for near-infrared imagingJ Nanosci Nanotechnol2010108118812321121304
- BoisselierEAstrucDGold nanoparticles in nanomedicine: preparations, imaging, diagnostics, therapies and toxicityChem Soc Rev2009381759178219587967
- ConnorEEMwamukaJGoleAGold nanoparticles are taken up by human cells but do not cause acute cytotoxicitySmall2005132532717193451
- CaiQYKimSHChoiKSColloidal gold nanoparticles as a blood-pool contrast agent for X-ray computed tomography in miceInvest Radiol20074279780618007151
- ChenYSHungYCLiauIAssessment of the in vivo toxicity of gold nanoparticlesNanoscale Res Lett2009485886420596373
- LiMLWangJCSchwartzJAIn-vivo photoacoustic microscopy of nanoshell extravasation from solid tumor vasculatureJ Biomed Opt20091401050719256687
- KimCChoECChenJIn vivo molecular photoacoustic tomography of melanomas targeted by bio-conjugated gold nanocagesACS Nano201044559456420731439
- HaSCarsonAAgarwalADetection and monitoring of the multiple inflammatory responses by photoacoustic molecular imaging using selectively targeted gold nanorodsBiomed Opt Express2011264565721412469
- AgarwalAHuangSWO’DonnelMTargeted gold nanorod contrast agent for prostate cancer detection by photoacoustic imagingJ Appl Phys2007102064701
- LiPCWeiCWLiaoCKPhotoacoustic imaging of multiple targets using gold nanorodsIEEE Trans Ultrason Ferroelectr Freq Control2007541642164717703668
- KimKHuangSWAshkenaziSPhotoacoustic imaging of early inflammatory response using gold nanorodsAppl Phys Lett200790223901223903
- LiPCWangCRCShiehDBIn vivo photoacoustic molecular imaging with simultaneous multiple selective targeting using antibody-conjugated gold nanorodsOpt Express200816186051861519581946
- PuvanakrishnanPParkJChatterjeeDIn vivo tumor targeting of gold nanoparticles: effect of particle type and dosing strategyInt J Nanomed2012712511258
- DidychukCLEphratPChamson-ReigADepth of phototermal conversion of gold nanorods embedded in a tissue-like phantomNanotechnology20092019510219510919420630
- SamimMPrashantCKDindaAKSynthesis and characterization of gold nanorods and their application for phototermal cell damageInt J Nanomed2011618251831
- LinkSEl-SayedMAOptical properties and ultrafast dynamics of metallic nanocrystalsAnn Rev Phys Chem20035433136612626731
- LinkSEl-SayedMASpectroscopic determination of the melting energy of a gold nanorodJ Chem Phys200111423622368
- LinkSBurdaCMohamedMBLaser photothermal melting and fragmentation of gold nanorods: energy and laser pulse-width dependenceJ Phys Chem A199910311651170
- ZhangXDWuDShenXSize-dependent in vivo toxicity of PEG-coated gold nanoparticlesInt J Nanomed2011620712081
- PanYNeussSLeifertASize-dependent cytotoxicity of gold nanoparticlesSmall200731941194917963284
- YenHJHsuSHTsaiCLCytotoxicity and immunological response of gold and silver nanoparticles of different sizesSmall200951553156119326357
- JiangWKimBYRutkaJTNanoparticle-mediated cellular response is size-dependentNat Nanotechnol2008314515018654486
- KhlebtsovNDykmanLBiodistribution and toxicity of engineered gold nanoparticles: a review of in vitro and in vivo studiesChem Soc Rev2011401647167121082078
- MurphyCJGoleAMStoneJWGold nanoparticles in biology: beyond toxicity to cellular imagingAcc Chem Res2008411721173018712884
- PatraHKBanerjeeSChaudhuriUCell selective response to gold nanoparticlesNanomedicine2007311111917572353
- NikoobakhtBEl-SayedMAPreparation and growth mechanism of gold nanorods (NRs) using seed-mediated growth methodChem Mater20031519571962
- LeonovAPZhengJClogstonJDDetoxification of gold nanorods by treatment with polystyrenesulfonateACS Nano200822481248819206282
- NiidomeTYamagataMOkamotoYPEG-modified gold nano-rods with a stealth character for in vivo applicationsJ Control Release200611434334716876898
- CasciaroSConversanoFMusioSFull experimental modelling of a liver tissue mimicking phantom for medical ultrasound studies employing different hydrogelsJ Mater Sci Mater Med20092098398919052848
- CasciaroSDemitriCConversanoFExperimental investigation and theoretical modelling of the nonlinear acoustical behaviour of a liver tissue and comparison with a tissue mimicking hydrogelJ Mater Sci Mater Med20081989990617665125
- DemitriCSanninoAConversanoFHydrogel based tissue mimicking phantom for in-vitro ultrasound contrast agents studiesJ Biomed Mater Res B Appl Biomater.200887B33834518536040
- GrecoAEsposito CorcioneCMaffezzoliATemperature evolution during stereolithography building with a commercial epoxy resinPolym Eng Sci200646493502
- GrecoALicciulliAMaffezzoliAStereolithography of ceramic suspensionsJ Mater Sci20013699105
- CorcioneCGrecoAMontagnaFSilica moulds built by stereolithographyJ Mater Sci20054048994904
- LicciulliACorcioneCGrecoALaser stereolithography of ZrO2 toughened Al2O3J Eur Ceram Soc20052515811589
- CorcioneCMontagnaFGrecoAFree form fabrication of silica moulds for aluminum casting by stereolithographyJ Rapid Prototyp200612184188
- ConversanoFFranchiniRDemitriCHepatic vessel segmentation for 3D planning of liver surgery: experimental evaluation of a new fully automatic algorithmAcad Radiol20111846147021216631
- American National Standards InstituteAmerican National Standard for the Safe Use of Lasers in the Health Care Environment, ANSI Z-136.3OrlandoLaser Institute of America1996
- International Organization for Standardization (ISO)ISO 10993-5Biological Evaluation of Medical Devices Part 5: Tests for in Vitro Cytotoxicity3rd edGenevaISO2009
- AnkriRPeretzVMotieiMA new method for cancer detection based on diffusion reflection measurements of targeted gold nanorodsInt J Nanomed20127449455
- LinkSBurdaCNikoobakhtBLaser-induced shape changes of colloidal gold nanorods using femtosecond and nanosecond laser pulsesJ Phys Chem B200010461526163
- ChangSSShihCWChenCDThe shape transition of gold nanorodsLangmuir199915701709
- LinkSWangZLEl-SayedMAHow does a gold nanorod melt?J Phys Chem B200010478677870
- HuMChenJLiZYGold nanostructures: engineering their plasmonic properties for biomedical applicationsChem Soc Rev2006351084109417057837