
Abstract
Purpose
This study aimed to formulate citicoline-loaded chitosan-coated liposomes (CT-CS-LPs) for topical administration and evaluated for wound healing in a diabetic animal model.
Methods
CT-LPs were formulated via a thin-film hydration approach and coated with chitosan (CS). Box-Behnken statistical design investigated the effects of lipid amount, chitosan concentration, and cholesterol amount on vesicle diameter, surface charge, and entrapment efficiency. The potential of the optimized CT-CS-LPs gel for wound healing was further evaluated in streptozocin-induced diabetic rats. The different healing stages were evaluated by several techniques, including general and special staining techniques, in addition to antibody immunohistochemistry.
Results
The optimized CT-CS-LPs obtained had a mean size of 211.6 nm, a 50.7% entrapment efficiency, and a positive surface charge of 32.1 mV. In addition, the optimized CT-CS-LPs exhibited in vitro sustained release behavior. The in vivo experiments revealed that treatment with the optimized CT-CS-LPs boosts the healing process of the skin wound in diabetic rats by reducing inflammation, accelerating re-epithelization, angiogenesis, fibroblast proliferation, and connective tissue remodeling, leading to rapid wound closure.
Conclusion
Chitosan-coated liposomes containing citicoline have emerged as a potential approach for promoting the healing process in diabetic rats. However, the therapeutic effectiveness of the suggested approach in diabetic patients needs to be investigated.
Introduction
Diabetes mellitus has emerged as a significant worldwide health problem, with a high prevalence in developing countries. According to research published in Diabetes Research and Clinical Practice, diabetic patients worldwide will reach at least 592 million by 2035.Citation1
Foot ulcers occur in around a quarter of diabetic patients due to peripheral neuropathy and poor wound healing (characterized by impaired angiogenesis, chronic inflammation, and decreased collagen production). Diabetic foot ulcers result in frequent hospitalization and, in the worst-case scenario, amputations, which result in higher medical costs and a worse quality of life for these patients.Citation2 There are many medications and treatments available to treat diabetic foot ulcers. Calcium alginate dressings, platelet-derived growth factors, hydrocolloid dressings, and sulfa drugs are just a few examples.Citation3 However, wound healing remains a problem in diabetic patients,Citation4 especially when the wounds grow exudative and deep.Citation3
The pursuit of novel therapeutic alternatives, coupled with advancements in nanotechnology, has resulted in novel therapeutic options. Various substances have been blended with biomaterials to construct structures to speed up the healing process, such as nanoparticles,Citation5 nanocomposites,Citation6 and nanofibers.Citation7 Several characteristics should be present in an ideal wound-healing substance, including cost-effectiveness, non-toxicity, low skin adherence, biocompatibility, protection of the wound from microorganisms, ability to maintain a moist wound environment, permit gas diffusion, and antibacterial activity.Citation8 Further, the process of selecting a wound-healing substance for diabetics is very subjective owing to the fact that they are predisposed to a variety of complications.
Nanocarriers may protect the drug from degradation, provide prolonged release of the medication, increase intracellular absorption, and optimize the position of the drug at the application site through a targeting mechanism. Liposomes (LPs) are an excellent option for transporting hydrophilic molecules such as small and charged compounds.Citation9 LPs are composed mainly of phospholipids, so they have an amphipathic nature. When LPs are dispersed in aqueous solutions, they form a lipid bilayer surrounding the aqueous core.
Chitosan (CS), produced via partial deacetylation of chitin, is a class of linear, cationic amino polysaccharides obtained from squid pens, fungi, and crustacean exoskeletons. In recent years, CS has gained significant interest due to its unique characteristics, such as polycationic character, in vivo biodegradability, solubility in aqueous medium at low pH,Citation10 mucoadhesiveness, antibacterial activity, and wound healingCitation11–Citation13 In addition, CS coats the surface of LPs due to the electrostatic interaction between the negative phospholipid charge of LPs and the amino acid positive group of CS.Citation14,Citation15 The surface coating of LPs by CS has various advantages, such as boosting stability, preventing drug leakage, prolonging its release, and increasing cellular absorption of the LPs.Citation14 Besides, CS has antibacterial (gram-negative and gram-positive bacteria) activity, which is critical for wound healing.Citation13,Citation16,Citation17
Citicoline (CT) is a choline donor used as an intermediary in phosphatidylcholine biosynthesis, a major component of the neuronal membrane. In experimental and clinical studies, CT is beneficial for various etiologies of cerebrovascular disorder, cognitive impairment, glaucoma, brain trauma, amblyopia, and Parkinson’s disease.Citation18–Citation21
Interestingly, Vascular Endothelial Growth Factor (VEGF), a heparin-binding glycoprotein, enhances the regeneration and migration of endothelial cells, thus essential for the induction and regulation of angiogenesis and collagen deposition, and controlling the inflammatory reaction.Citation22 Moreover, it is crucial for regeneration, cell survival, and tissue repair.Citation23 According to the study performed by Feng et al, CT upregulates VEGF expression, improves the blood supply, and stimulates angiogenesis.Citation24 Moreover, CT reduces tissue inflammation, inhibits flap ischemia-reperfusion injury, and antagonizes tissue lipid peroxidation. Therefore, we believe that liposomal formulations coated with CS are a potential vehicle for associating and delivering CT for improved wound healing in the diabetic patient.
Thus, in the present study, we formulated chitosan-coated liposomes containing citicoline (CT-CS-LPs) to be assessed as a possible therapy for boosting the healing process in a streptozocin-induced diabetic rat model. This is the first research that we are aware of that investigates the potential of CT-CS-LPs for wound healing in diabetic rats. Size, entrapment efficiency, morphological analysis, surface charge, and in vitro release were all conducted on the CT-CS-LPs nanovesicles. Furthermore, in vivo experiments in diabetic rats assessed the CT-CS-LPs efficacy in boosting the wound healing process.
Materials and Methods
Materials
Citicoline was provided as a kind donation from Global Nabi Pharmaceutical Co. (Egypt). Soybean lecithin (Epikuron® 200 soya bean L-α phosphatidylcholine) was kindly donated by Cargill (Minneapolis, MN, Germany). Cholesterol, Chitosan (MW: 150,000 Da), and Streptozocin were obtained from Sigma-Aldrich (St. Louis, MO, USA). Carbopol 974 NF, Triethanolamine, Propylparaben, Methylparaben, and Chloroform (HPLC grade) were supplied by El-Nasr pharmaceutical chemical company (Cairo, Egypt). Dialysis bags (MW cut off: 12,000 DA) were purchased from SERVAPOR Company (Heidelberg, Germany). All other chemicals and reagents used were of analytical grade.
Design of Experiments and Statistical Analysis
Box-Behnken design (BBD) with three-factor and three-level was used to optimize the causal variables to reduce the size and increase the entrapment and surface charge of CT-CS-LPs formulation. The experimental design was developed and evaluated using the Design Expert® software (Version 12.0.3.0, Stat-Ease Inc., Minneapolis, MN, USA). There have been fourteen runs, twelve of which involve the midpoints of each edge of a tridimensional cube, two of which concern the center point of the cube. Three independent factors were examined: the amount of lipid (mg) (X1), the concentration of CS W/v (%) (X2), and the amount of cholesterol (mg) (X3). Vesicle size (VS), zeta potential (ZP), and entrapment efficiency (EE) were assumed to be the response variables. The plot3D R-package in R software was used to generate 3D response surface plots.Citation25 As determined by the BBD, the formulation factors and components of the produced CT-CS-LPs are listed in and . Finally, desirability was computed to find an optimum formulation.
Table 1 The Box-Behnken Design Levels Utilized for CT-CS-LPs Optimization
Table 2 The Experimental Design Runs and Independent and Dependent Factors for CT-CS-LPs Formulation Based on the Box-Behnken Design
Preparation of Citicoline-Loaded Chitosan-Coated Liposomes
The LPs utilized were developed via the thin-film hydration approach.Citation26 Concisely, accurately weighed amounts of soybean lecithin and cholesterol were dissolved in 10 mL of chloroform in a round-bottom flask. The organic solvent evaporation was performed using a rotating evaporator (Stuart rotary evaporator, United Kingdom) at 50 °C to form a thin lipid layer. The hydration of the lipid layer was established with 10 mL of phosphate buffer saline (PBS, pH 7.4) containing 10 mg of CT for 2 h. The resulting dispersion was sonicated (Ney ultrasonic cleaner, USA) for 10 min to produce unilamellar LPs, then kept at 4°C overnight. The CS different concentrations were made by adding the calculated amounts to an aqueous acetic acid solution (1%, v/v). The LPs were coated with CS by dropwise addition of liposomal suspension to CS solution (3:1) at 25°C for 2 h under stirring, and the mixture was kept overnight in the refrigerator before characterization.
Characterization and Optimization of Citicoline Loaded Chitosan-Coated Liposomes
Vesicle Diameter and Surface Charge Study
The vesicle size and the surface charge of CT-CS-LPs were determined via dynamic light scattering (DLS) approaches (Zetasizer Nano ZS, Malvern Instruments, UK). Before analysis, the suspension of CT-CS-LPs was diluted with distilled water (1:10) and analyzed at 25°C.Citation27
Citicoline Entrapment Efficiency
The entrapment of CT in CT-CS-LPs was calculated indirectly by analyzing CT in the supernatant after centrifugation and then subtracting from the quantity added during formulation. The centrifugation was established via a cooling centrifuge (SIGMA 3-30K, Germany) for 3h (14,000 rpm, 4°C) to separate the supernatant containing free CT.Citation28 The concentration of CT in the supernatant was estimated spectrophotometrically (Jasco V-530, Japan) at 271 nm after suitable dilution.
The percentage of CT entrapment was calculated using the following equation:
Characterization of the Optimized Citicoline Loaded Chitosan-Coated Liposomes
Fourier-Transform Infrared Spectroscopy
Fourier transform infrared spectroscopy (FT-IR) assessed interaction between CT and the LPs matrix. CT, soybean lecithin, cholesterol, CS, physical mixture, and optimized formula (CT-CS-LPs) were homogeneously mixed with potassium bromide (KBr) by a mortar and pestle. After that, the mixtures were put in a hydraulic press for compression into a thin film and fixed in a sample holder. Then, FT-IR analysis was performed in transmission mode between 4000 and 400 cm−1 using KBr film as reference.Citation29
In vitro Release Study
In vitro release analysis was performed using the Franz permeation apparatus with cells (5-cm2 diffusion area). The donor chamber maintained the optimized CT-CS-LPs suspension (chitosan-coated), CT-LPs suspension (chitosan-uncoated), and CT solution (all containing amounts equal to 10 mg CT). The receptor media includes 50 milliliters of phosphate buffer (pH 5.5) under magnetic stirring (100 rpm) at 32±0.5°C.Citation30 A pre-soaked cellulose membrane separated the donor chamber from the receptor one.Citation31 One mL sample was taken from the receptor chamber and replaced by fresh phosphate buffer (1 mL) at predetermined time intervals. The collected samples were filtered and spectrophotometrically measured at a wavelength of 271 nm to estimate the percentage of drug release according to the following equation:
Qi and Qr are the amounts of drug released at t-time and the initial amount of CT, respectively.Citation32
Analysis of Morphology and pH
Transmission electron microscopy (TEM) assessed the optimized CT-CS-LPs formulation morphology. One drop of freshly produced CT-CS-LPs dispersion was placed on a carbon-coated grid and left at 25°C for 5 minutes. Next, 0.1 mL of phosphotungstic acid (1%, w/v) was added to the grid as a negative stain, left for 2 min for adequate staining absorption, and filtered out via filter paper. TEM (Jeol, Tokyo, Japan) examines the formulation at 80 kV.Citation28 The pH of the optimized CT-CS-LPs formulation was assessed via a calibrated pH meter (Jenway, UK).
Stability Study
The optimized CT-CS-LPs formulation was stored at 4°C in a glass container for three months. The samples from the optimum formulation were collected and tested for vesicle diameter and entrapment after 0, 30, 60, and 90 days of storage.Citation33
Formulation of Transdermal Based Gel
The optimized CT-CS-LPs, CS-LPs (empty nanovesicles), and free CT solution were combined with Carbopol polymer to create a gel, as previously described.Citation33 First, 2% Carbopol 974 NF (w/w) and preservatives (0.1% methylparaben and 0.01% propylparaben) were sprinkled into water and agitated for 3 hrs. Next, CT-CS-LPs, CS-LPs, and free CT solution were added to the gel base and stirred for 1 h. The pH of the prepared gels was adjusted to 6.0±0.05 using triethanolamine to obtain a suitable strength for topical application. The CT concentration in CT-CS-LPs and free CT gels was equivalent to 1% w/w. All gels were tested for homogeneity, spreadability, transparency, and appropriate rheological properties. Previously, we examined the characterization of the produced gels.Citation34
In vivo Evaluation in a Diabetic Rat Model
Twenty-four Wistar rats (170–210 g) were used following the approval of the Local Institutional Animal Ethics Committee at Beni-Suef University (Acceptance No: 021-212) and conducted according to the Guide for the Care and Use of Laboratory Animals published in 2011 by the United States National Academy of Sciences. Following acclimation, the animals were housed in propylene cages at 25°C. The rats were given standard feed and had unrestricted access to water. For fifteen days before diabetes mellitus induction, the animals were administered fructose solution (10%) ad libitum.Citation35 Then, the rats returned to get unlimited water.
Induction of Diabetes Mellitus in Animals
Before the induction of diabetes mellitus, all animals fasted for a day, a period of decreased mobility and stress. Streptozocin was dissolved in citrate buffer with pH 4.4 to obtain 20 mg/mL and then filtered through a 0.2-µm Millipore filter (Whatman Ltd, Springfield Mill, UK). Each animal received streptozocin with a dose of 50 mg/kg intraperitoneally. Blood was collected from the tail veins of the rats after 72 hrs to test for diabetes induction after streptozocin injection, and glucose levels were measured using a commercial glucometer (GlucoDr®). The animal with a blood glucose level of more than 200 mg/dL was considered diabetic,Citation36,Citation37 and the following symptoms supported the diagnosis: polyphagia, polyuria, and polydipsia.Citation35 Correa et alCitation38 explain how the wound is created. The rats were anesthetized with 5 mg/kg xylazine and 90 mg/kg ketamine intraperitoneally. The dorsal area has been shaved and disinfected with 70% ethyl alcohol. Next, circular wounds were made using a 10 mm diameter sterile biopsy punch, and the skin and subcutaneous tissue were detached.
Application of Treatments
Diabetic rats were divided into four main groups (n = 6): group A was untreated and considered as a control group; group B was treated with CS-LPs gel (without CT); group C was treated with free CT gel, and group D was treated with optimized CT-CS-LPs gel.
The wound treatment began on the day the injury occurred (day 0) and continued once daily (12 pm) for fourteen consecutive days. The wounds were cleansed with sterile gauze soaked in 0.9% NaCl sterile solution before applying the treatments (1 gm gel) above them. The scars remained exposed throughout the experiment.
Macroscopic Analysis
The wound area was measured with a transparent millimeter scale in the excised model, and digital pictures were obtained on days 0, 3, 6, 9, 12, and 14. The wound area measurements were used as an estimated parameter.Citation36,Citation39 The percent of wound healing was calculated using the following equation:
Microscopic Analysis
On days 3, 7, and 14 of the experiment, the entire wounds with their edges were excised from all the studied groups, fixed in formalin (10%) immediately for 48 h, then processed by the routine paraffin technique, and the stains that detailed by the method published by Suvarna et al were performed.Citation40
Histopathological Examination by Hematoxylin and Eosin Stain
In this general staining technique, the paraffinized wound sections were stained with hematoxylin and eosin (H&E) stain for the general examination. The length of the wound gap and the thickness of granulation tissue were measured in wound sections stained with H&E (X40, par 500 µm). Also, the degree of necrosis, granulation tissue, epithelization, connective tissue remodeling, inflammatory cell infiltration, edema, and angiogenesis was assessed in wound sections stained with H&E (X100, par 200 µm).Citation22
Histopathological Examination by Crossman’s Trichrome and Picrosirius Red Stains
For this special staining technique, the paraffinized wound sections were stained with Crossman’s trichrome stain for total collagen fiber identification and Picrosirius red stain (bright-field view and polarized-field view) for mature and immature collagen fiber differentiation. The percent area of collagen fiber was quantified in wound sections X100, par 200 µm in Crossman’s trichrome and Picrosirius red (bright-field view) stains, and X200 par 100 µm in Picrosirius red (polarized-field view) stain.Citation38
Immunohistochemistry Study
In the immunohistochemical technique, the paraffinized wound sections were stained with VEGF rabbit polyclonal antibody (Cat. # RB-222-R7, Thermo Scientific Company). The positive area of VEGF gene expression was evaluated in wound sections X200, par 100 µm.
All stained slides were examined by light microscope and captured with LEICA (DFC290 HD system digital camera, Switzerland), except the Picrosirius red polarized field view was examined and photographed by Olympus BX-53P polarizing microscope.Citation41 All evaluations were achieved by applying image-j analysis software 1.52a.
Statistical Analysis
Each experiment was conducted in triplicates, and the results are given as mean ± standard deviation. A one-way ANOVA with a Tukey post hoc test was used to assess significant differences between studied groups. The microscopic analysis was evaluated using SPSS software (version 22, USA). A mixed ANOVA followed by a Bonferroni post-test was employed to distinguish between groups in the microscopic examination. The results were considered significant when the P-value was less than 0.05.
Results and Discussion
Formulation of Citicoline Loaded Chitosan-Coated Liposomes
Preliminary tests were conducted to determine the impact of various factors on the CT-CS-LPs formulation, including an organic solvent, hydration medium, drug amount, and sonication time. The main objective is to achieve an appropriate size and high entrapment; therefore, all aspects were regarded. Indeed, to improve the entrapment and stability of LPs vesicles, cholesterol-integrated lecithin was usedCitation42–Citation44 The following conditions were preferred for CT-CS-LPs formulation: 10 mg CT, PBS with pH 7.4 as a hydration medium, 2 h of hydration, 10 min of sonication, and chloroform as an organic solvent.
Design of Experiments and Statistical Analysis
The models adequately described the variability in the estimated findings (Tables S1 and S2), as shown by the insignificant lack of fit. Visual examination of the model diagnostic plots (Figures S1–S3 in supplemental materials) shows a decent fit to the data without obvious residual error patterns, with most residual errors following a normal distribution. The relationship between independent and dependent factors is depicted in , and each plot denotes the effect of two independent variables while the third remains constant.
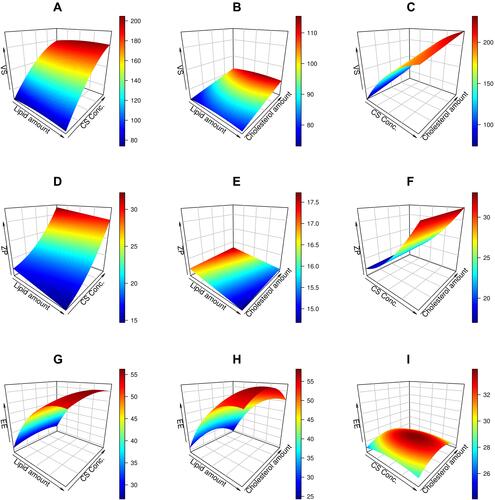
Figure 1 3D response surface plots for the effects of independent variables (lipid amount, CS concentration, and cholesterol amount) on response variables: (A–C) (effect on vesicle size (VS), (D–F) (effect on entrapment efficiency (EE (%)), and (G–I) (effect on zeta potential (ZP)) of CT-CS-LPs formulations.
The Impact of Independent Factors on Vesicle Size
As shown in , the mean diameter of formed CT-CS-LPs vesicles ranged between 85.39 and 229.5 nm. When the VS data were analyzed using ANOVA, the reduced cubic model was found to be appropriate. Additionally, the ANOVA analysis indicates that the effect of CS concentration and cholesterol amount on VS of CT-CS-LPs was very significant (p<0.05). The resulting equation concerning coded values was as follows:
As illustrated in , there is a considerable rise in VS in response to increased CS concentration. This observation is due to the covering of LPs with CSCitation26 and the swelling of CS in the presence of water.Citation45 In addition, the rise in cholesterol amount is associated with a slight increase in VS. The observed increase in VS may be due to more cholesterol molecules being dispersed in the phospholipid bilayer.Citation46 Unexpectedly, there is no significant increase in VS when increasing the lipid concentration. These findings are similar to those of Xu et al, who reported that lipid content had a negligible effect on VS.Citation47
The Impact of Independent Factors on Zeta Potential
As shown in , the ZP of formed CT-CS-LPs vesicles ranged between 14.6 and 33.1 mV. When the ZP data were analyzed using ANOVA, the reduced quadratic model was found to be appropriate. Additionally, the ANOVA analysis indicates that the effect of lipid amount, CS concentration, and cholesterol amount on ZP of CT-CS-LPs was very significant (p < 0.05). The resulting equation concerning coded values was as follows:
The surface charge of CT-CS-LPs was positive due to the CS amine group, making it bioadhesive to negatively charged LPs surfaces and imposing an overall positive charge. As depicted in , The ZP of 16.2 mV was increased to 21.3 mV when CS increased from 0.1 to 0.2%. The magnitude of the ZP was raised further to an average of 32.1 mV when the CS was increased to 0.3%. These results were ascribed to a rise in amino acid content, which provided an additional positive charge to LPs, thus increasing their stability in solution.Citation26
The Impact of Independent Factors on Entrapment Efficiency
() shows that the EE of formed CT-CS-LPs ranged between 25.8 and 58.5%. ANOVA shows the appropriateness of the reduced quadratic model in the collected EE data. Additionally, the ANOVA analysis of the obtained EE reveals a very significant effect of lipid and cholesterol on the CT-CS-LPs entrapment (p < 0.05). The resulting equation concerning coded values was as follows:
The highest entrapment was achieved with lipid content of about 85 mg ( and ); increasing the lipid levels increased the entrapment proportionately due to the bigger vesicle size and, therefore, the higher internal drug encapsulation amount. However, increasing the lipid content to > 85 mg had little effect on drug encapsulation since the viscosity increased and the extruder retained a small portion of the formulation. As a result, it was determined that increasing lipid loading had a detrimental effect on encapsulation.Citation47
As illustrated in ( and ), raising the cholesterol level from 5 to 15 mg increases the entrapment. Once cholesterol levels reach 15 mg, each subsequent rise results in a further decrease in encapsulation. Cholesterol decreases the rotational flexibility of phospholipid hydrocarbon chains, thus decreasing hydrophilic molecule loss and stabilizing the lipid bilayer.Citation48,Citation49 Hydrophilic molecule entrapment is proportional to the quantity of aqueous phase generated during formulation, and the presence of cholesterol in the LPs may change the width of the vesicle, thus decreasing entrapment. When cholesterol levels reach a certain level, entrapment reduces as the volume of internal LPs decreases.Citation49,Citation50 The concentration of CS has a negligible effect (> 0.05) on the entrapment.
Formulation Optimization
Following the imposition of constraints on VS, ZP, and EE, the Design Expert® program suggested the formulation of optimum CT-CS-LPs with a total desirability of 0.57. summarizes the components of the optimal formula. The optimal formulation variables are anticipated to be 100 mg of lipid, 0.3% of CS, and 5 mg of cholesterol. The corresponding optimum response variables are VS of 194.4 nm, ZP of 30.1 mV, and EE of 54.6% (). As illustrated in , Our models accurately predicted the characteristics of the optimum CT-CS-LPs (prediction errors < 9%).
Table 3 The Optimized CT-CS-LPs Formulation Composition, Laboratory Recorded and Model-Predicted Values
Table 4 Semi-Quantitative Scoring of the Healing Process in Diabetic Rats of the Different Studied Groups Using Sections Stained with H&E X100
Characterization of the Optimized Citicoline-Loaded Chitosan-Coated Liposomes
Fourier-Transform Infrared Spectroscopy
Interaction (presented as bond formation or peak disappearance) between CT and LPs components was verified using the FT-IR tool (Figure S4 in the supplemental file). The CT spectrum showed characteristic peaks at 3423 cm−1 (amine group present in pyrimidine ring), 1654 cm−1 (Stretching of RCOR’ in pyrimidine ring), 1240 cm−1 (Stretching of C-N in tertiary amine), and 1078 cm−1 (Stretching of C-O in tetrahydrofuran).Citation51 The cholesterol spectrum showed an intense peak at 3419 cm−1 (O-H stretching), a distinct peak was observed at 2941 cm−1 (CH2 symmetric stretching vibration), and a peak at 1459 cm−1 (double bond was present in the cholesterol second ring).Citation52 Lecithin showed an absorption band at 2926 cm−1 (carboxylic acid group).Citation52 CS showed a characteristic peak at 3426 cm−1 (OH stretching vibration), whereas the peaks at 2921 and 1427 cm−1 are attributed to C-H and CH2-OH vibration.Citation52 The CT-CS-LPs spectra were characterized by the absence of CT characteristic peaks, indicating that CT molecules were embedded in the lipid matrix.
In vitro Release Study
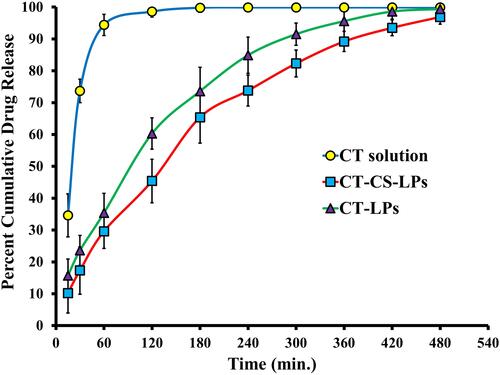
The CT-CS-LPs had a significantly different release profile than the CT-LPs and CT solution (, p < 0.05). CT solution released a cumulative quantity of 94.4% after 1 h, whereas CT-LPs and CT-CS-LPs released 98.6% and 93.5%, respectively, after 7 h. These findings indicated that the rate of CT release from both uncoated and coated LPs was much lower than the rate of CT release from the CT solution. As predicted, CS had a significant effect on the drug release characteristics of LPs. Coating LPs with CS reduced the proportion of drug released as compared to uncoated LPs. These findings are consistent with those of Nguyen et al.Citation53 In addition, CT-CS-LPs displayed delayed drug release for 8 h.
Figure 2 The optimized CT-CS-LPs and CT solution in vitro release profiles.
Analysis of Morphology and pH
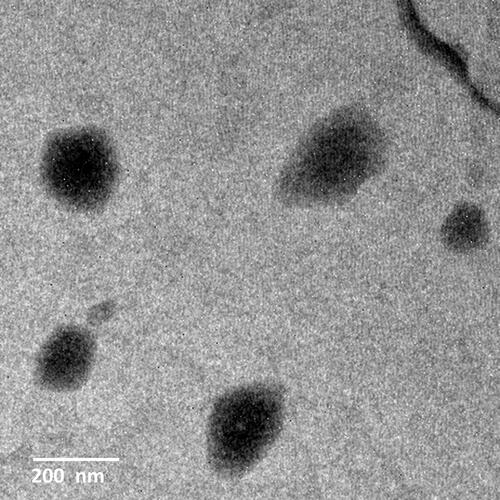
TEM was used to visualize the morphological characterization of the optimized CT-CS-LPs formulation (). The analysis revealed that the majority of liposomal suspension vesicles scattered well and were spherical. Moreover, the CS coating has no negative impact on the microstructure of liposomal vesicles. Notably, a very thin-coated layer covering the membrane surface reveals the core-shell structure. However, the size analysis by TEM often differs from DLS, which is ascribed to issues related to the high vacuum conditions used in TEM, and the hydrodynamic and electrokinetic effects in DLS measurements.Citation54,Citation55 Moreover, TEM techniques analyze individual particles, while DLS analyzes the size of an assembly of particles (about 1011), and fitting the data yields the observed sample average size.Citation56 The optimized CT-CS-LPs had a pH of 5.71.
Figure 3 The TEM image of the optimized CT-CS-LPs formulation.
Stability Study
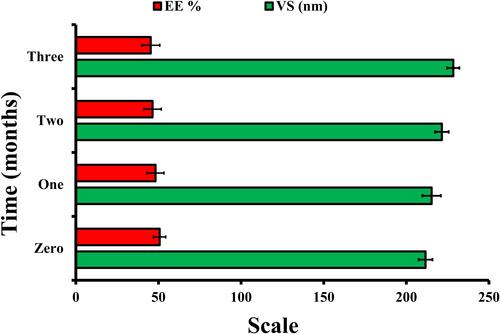
As shown in , the optimized CT-CS-LPs exhibited minor changes in VS (size increased from 211.6±4.23 nm to 228.4±3.72 nm) and EE (entrapment reduced from 50.7±3.66% to 45.3 ±5.54%) during the three months. These differences were considered negligible (p >0.05 in one-way ANOVA). The high surface charge (+32.1 mV) of optimized CT-CS-LPs may account for their stability. Stable formulations typically have a surface charge greater than or equal 30 mV (absolute value).Citation51,Citation52
Figure 4 The size and entrapment of the optimized CT-CS-LPs formulation after 90 days of storage.
In vivo Evaluation in a Diabetic Rat Model
Macroscopic Analysis
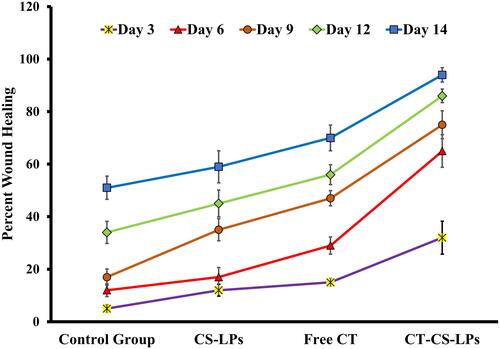
The progression and macroscopic features of the wounds are shown in and , demonstrating accelerated wound closure in rats treated with CS-LPs, Free CT, and CT-CS-LPs. shows the images of the most representative rat from each treatment group. The wounds of all groups remained open until the 12th day, except for the CT-CS-LPs group. When comparing the CT-CS-LPs group to the control, CS-LPs, and free CT groups on day 14, the CT-CS-LPs group exhibited a significant wound area reduction (). This clearly illustrates that the coexistence of the two components, CS and CT, promotes the wound healing process, leading to the group (D) receiving CT-CS-LPs having a greater wound closure rate than the other groups. Besides, studies have shown that these two components may help speed up the healing process of wounds.Citation57–Citation62
Figure 5 Photographs of wound healing were taken on the 0th, 3rd, 6th, 9th, 12th, and 14th days in different diabetic rats in; control (untreated), chitosan-coated liposomes without citicoline (CS-LPs), free citicoline (free CT), and optimized citicoline chitosan-coated liposomes (CT-CS-LPs) groups.
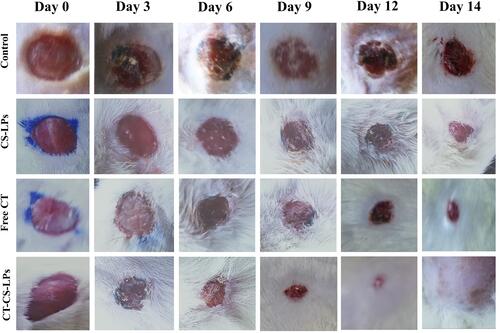
Figure 6 Percent area of wound healing in treated diabetic rats on the 3rd, 6th, 9th, 12th, and 14th days after wound creation in; control (untreated), chitosan-coated liposomes without citicoline (CS-LPs), free citicoline (free CT), and optimized citicoline chitosan-coated liposomes (CT-CS-LPs) groups.
Microscopic Analysis
Histopathological Examination by Hematoxylin and Eosin Stain
The wound gap length was measured through an H&E stain. It is significantly different between all studied groups (P≤0.05, ). On all days, the contraction of wound edges was more rapid in free CT and CT-CS-LPs groups than in the others. The regeneration of keratinocytes was required for wound re-epithelialization and differentiation.Citation63 It was noted that, on day 7, the re-epithelization occurred rapidly under the scab ( and ), and by day 14, there was complete epidermal formation with keratinization and gap closure in free CT and CT-CS-LPs groups ( and ) compared to the others.
Figure 7 Microscopic evaluation of the healing process in the skin wound sections in the diabetic rats of all studied groups showing: (A) the wound gap length (µm), using sections stained with H&E. X40. (B) The granulation tissue thickness (µm), using sections stained with H&E. X40. (C) The percent area of the total collagen fibers, using sections stained with Crossman’s trichrome stain X100. (D) The percent area of the total collagen fibers, using sections stained with Picrosirius red stain (bright-field View) X100. (E) The percent area of the mature collagen fibers, using sections stained with Picrosirius red stain (polarized-field view) X200. (F) The relative percent area of VEGF immunoexpression, using sections stained with VEGF Antibody X400. (A) illustrates a significant variation when compared to the control group, (B) illustrates a significant variation when compared to CS-LPs group, and c illustrates a significant variation when compared to free citicoline group.
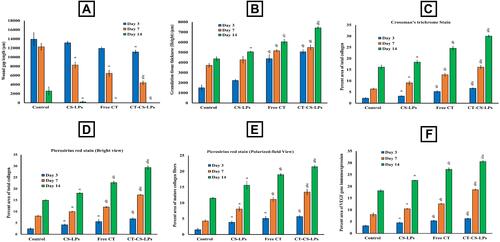
Figure 8 Representative photomicrographs of skin sections (H&E stain) from all studied groups on the 3rd, 7th, and 14th days post wound creation showing; Control (A1–A6), CS-LPs (B1–B6), Free CT (C1–C6), and CT-CS-LPs (D1–D6) groups. Notice: inflammatory cells (thin arrows), fibroblast (thick arrows), congested blood vessels (*), microvessels (arrow heads), scab (S), blood arterioles (zigzagged arrows), the regenerated epidermis (E), collagen bundles (C), hair follicles (F) and sebaceous gland (G).
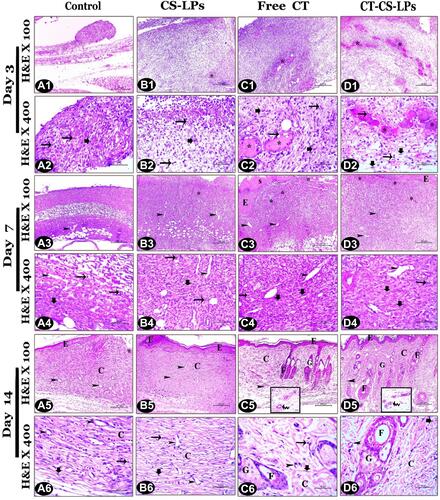
Concerning the granulation tissue thickness, it was noticed that there was a significant difference between all the studied groups, P ≤ 0.05 (). The thickness of the newly formed tissues in the free CT and CT-CS-LPs groups was significantly increased due to more regenerated fibroblast, connective tissue, and micro-vessels ( and , and ). By day 14, the granulation tissue appeared thicker in the CT-CS-LPs group because of the complete formation of dermal constituents, including hair follicles and sebaceous glands (d5 and ).
General scoring of different pathological lesions that appeared in the regenerated tissues was assessed via H&E stain regarding the published scoring system.Citation22 According to and , necrosis, edema, and inflammatory cell infiltration were increased in the control group compared to the CT-CS-LPs group. While re-epithelization, connective tissue remodeling, and angiogenesis were significantly increased in the CT-CS-LPs group compared to the control group. Therefore, treatment with CT-CS-LPs enhances the wound healing process by reducing inflammation, accelerating re-epithelization, connective tissue remodeling, and angiogenesis.
Crossman’s Trichrome and Picrosirius Red (Bright-Field View) Stain
Crossman’s trichrome and Picrosirius red (Bright-field View) stains were used to identify and quantify the area percentage of the total collagen fibers in the regenerated dermis ( and ). The collagen fibers appeared green with Crossman’s trichrome stain and red with Picrosirius red (Bright-field View) stain. The quantity of the total fibers was significantly different between all the studied groups, P ≤ 0.05 ( and ).
Figure 9 Photomicrographs of skin sections from all studied groups on the 3rd, 7th, and 14th days post wound creation, showing the total collagen fibers appeared green by Crossman’s trichrome stain and red by Picrosirius red stain (bright-field view); control (A1–A6), CS-LPs (B1–B6), Free CT (C1–C6) and CT-CS-LPs (D1–D6) groups.
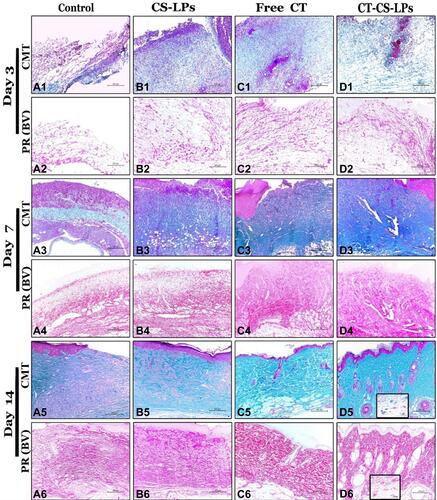
On day 3, the collagen fiber appeared as thin fine fibers, while on day 7, they appeared as condensed randomly distributed fibers. By day 14, the fibers appeared in the form of organized short thick bundles filling the dermis and also surrounding the regenerated arterioles in the free CT and CT-CS-LPs groups ( and and and ), while in the control and CS-LPs groups, appeared as fine fiber together with thinly randomly distributed bundles, ( and ). On all days, the highest quantity of collagen fiber appeared in the CT-CS-LPs group compared to the other groups.
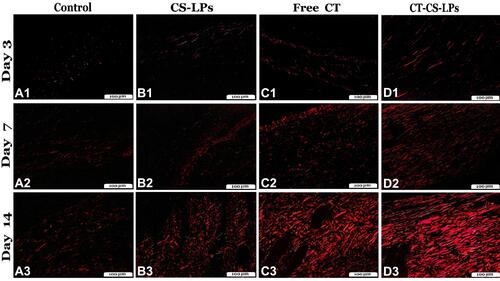
Picrosirius Red (Polarized-Field View) Stain
The Picrosirius red (Polarized-field View) stain was used for identification and differentiation between the immature (type III) and mature (type I) collagen fiber and quantification of the area percentage of the mature one ( and ). The mature collagen appeared shiny red, but the immature one seemed green polarized fibers. The organization and quantity of the mature fibers were significantly different between all studied groups, P ≤ 0.05 (). The highest percentage of mature collagen fibers was presented in the CT-CS-LPs group on all days. By day 14, it appeared as thin organized randomly distributed short bundles in the Control and CS-LPs groups, but more condensed in the latter group ( and ), while it appeared as thick organized parallel bundles in the Free CT and CT-CS-LPs groups ().
Figure 10 Photomicrographs of skin sections from all studied groups stained with Picrosirius red stain (polarized-field view), on the 3rd, 7th, and 14th days post wound creation showing: control (A1–A3), CS-LPs (B1–B3), Free CT (C1–C3) and CT-CS-LPs (D1–D3) groups. The shiny red fibers were the mature collagen, while the immature appeared light green.
Immunohistochemistry Study
Representative skin wound sections presented in and revealed the difference between groups in the reaction intensity and the area percentage of VEGF immune-expression. The VEGF gene expression area percentage was significantly different between all studied groups, P ≤ 0.05 (). Angiogenesis is a key process for granulation tissue maintenance, thus enhancing wound healing. It was induced by several angiogenic factors, including VEGF.Citation64,Citation65 VEGF immune expression is increased by the thickening of granulated tissues. On day 3, it appeared within the inflammatory cells and fibroblasts of all the studied groups, in addition to the endothelial cells of new micro-vessels except in the control group ().
Figure 11 Vascular Endothelial Growth Factor (VEGF) immunohistochemistry photomicrographs from all studied groups on the 3rd, 7th, and 14th days post wound creation, showing: control group with minimal VEGF immunoexpression (A1–A6). CS-LPs group with mild VEGF immunoexpression (B1–B6). Free CT group with moderate VEGF immunoexpression (C1–C6). CT-CS-LPs group with strong VEGF immunoexpression (D1–D6).
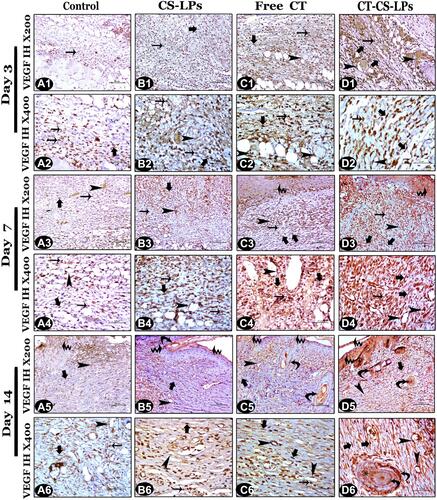
Both the Free CT and CT-CS-LPs groups showed cytoplasmic immunoreaction of VEGF within the regenerated keratinocytes of the epithelial covering by day 7 ( and ). By day 14, the positive immunoreactive cells appeared within the regenerated epidermis of all studied groups (),Citation66 while also appearing within the hair follicles (internal and external root sheaths) and the sebaceous glands in the Free CT and CT-CS-LPs groups only ( and ). At all stages of healing, the treatment with CT-CS-LPs showed significantly higher VEGF immunoreaction than control and the other treatments due to more induction of micro-vessels and fibroblast formation as well as improved epithelialization.Citation22
Conclusion
This is the first research to demonstrate the efficacy of chitosan-coated liposomes containing citicoline as a new treatment for wound healing in a diabetic rat model. The formulated CT-CS-LPs exhibited sustained sustained-release behavior and high stability. Moreover, the in vivo assessments revealed that CT-CS-LPs promote the healing process in diabetic rats. However, the therapeutic effectiveness of the suggested approach in diabetic patients needs to be investigated.
Acknowledgments
The researchers acknowledge the support given by Taif University Researchers Supporting Project number (TURSP-2020/50), Taif University, Taif, Saudi Arabia.
Disclosure
The authors report no conflicts of interest in this work.
References
- Guariguata L, Whiting DR, Hambleton I, et al. Global estimates of diabetes prevalence for 2013 and projections for 2035. Diabetes Res Clin Pract. 2014;103(2):137–149. doi:10.1016/j.diabres.2013.11.002
- Rodrigues BT, Vangaveti VN, Malabu UH. Prevalence and risk factors for diabetic lower limb amputation: a clinic-based case control study. J Diabetes Res. 2016;2016. doi:10.1155/2016/5941957IJN_A_342504
- Kumar Chellappan D, Yenese Y, Chian Wei C, et al. Nanotechnology and diabetic wound healing: a review. Endocr Metab Immune Disord Drug Targets. 2017;17(2):87–95.
- Järbrink K, Ni G, Sönnergren H, et al. The humanistic and economic burden of chronic wounds: a protocol for a systematic review. Syst Rev. 2017;6(1):1–7. doi:10.1186/s13643-016-0400-8
- Kumar, SSD, Rajendran, NK, Houreld, NN, et al. Recent advances on silver nanoparticle and biopolymer-based biomaterials for wound healing applications. Int J Biol Macromol. 2018;115:165–175. doi:10.1016/j.ijbiomac.2018.04.003
- Gopal A, Kant V, Gopalakrishnan A, et al. Chitosan-based copper nanocomposite accelerates healing in excision wound model in rats. Eur J Pharmacol. 2014;731:8–19.
- Xie Z, Paras CB, Weng H, et al. Dual growth factor releasing multi-functional nanofibers for wound healing. Acta Biomater. 2013;9(12):9351–9359. doi:10.1016/j.actbio.2013.07.030
- Vijayakumar V, Samal SK, Mohanty S, et al. Recent advancements in biopolymer and metal nanoparticle-based materials in diabetic wound healing management. Int J Biol Macromol. 2019;122:137–148. doi:10.1016/j.ijbiomac.2018.10.120
- Eloy JO, Claro de Souza M, Petrilli R, et al. Liposomes as carriers of hydrophilic small molecule drugs: strategies to enhance encapsulation and delivery. Colloids Surf B Biointerfaces. 2014;123:345–363. doi:10.1016/j.colsurfb.2014.09.029
- Muzzarelli R. Human enzymatic activities related to the therapeutic administration of chitin derivatives. Cell Mol Life Sci. 1997;53(2):131–140. doi:10.1007/PL00000584
- Menchicchi B, Fuenzalida JP, Bobbili KB, et al. Structure of chitosan determines its interactions with mucin. Biomacromolecules. 2014;15(10):3550–3558. doi:10.1021/bm5007954
- Menchicchi B, Fuenzalida JP, Hensel A, et al. Biophysical analysis of the molecular interactions between polysaccharides and mucin. Biomacromolecules. 2015;16(3):924–935. doi:10.1021/bm501832y
- Kong M, Chen XG, Xing K, et al. Antimicrobial properties of chitosan and mode of action: a state of the art review. Int J Food Microbiol. 2010;144(1):51–63. doi:10.1016/j.ijfoodmicro.2010.09.012
- Bozzuto G, Molinari A. Liposomes as nanomedical devices. Int J Nanomedicine. 2015;10:975. doi:10.2147/IJN.S68861
- Gibis M, Ruedt C, Weiss J. In vitro release of grape-seed polyphenols encapsulated from uncoated and chitosan-coated liposomes. Food Res Int. 2016;88:105–113. doi:10.1016/j.foodres.2016.02.010
- Raafat D, von Bargen K, Haas A, et al. Insights into the mode of action of chitosan as an antibacterial compound. Appl Environ Microbiol. 2008;74(12):3764–3773. doi:10.1128/AEM.00453-08
- Tokura S, Ueno K, Miyazaki S, et al. Molecular Weight Dependent Antimicrobial Activity by Chitosan, in New Macromolecular Architecture and Functions. Springer; 1996:199–207.
- Gareri P, Castagna A, Cotroneo AM, et al. The role of citicoline in cognitive impairment: pharmacological characteristics, possible advantages, and doubts for an old drug with new perspectives. Clin Interv Aging. 2015;10:1421. doi:10.2147/CIA.S87886
- Álvarez-sabín J, Román GC. Citicoline in vascular cognitive impairment and vascular dementia after stroke. Stroke. 2011;42(1_suppl_1):S40–S43. doi:10.1161/STROKEAHA.110.606509
- Barrachina M, Domı́nguez I, Ambrosio S, et al. Neuroprotective effect of citicoline in 6-hydroxydopamine-lesioned rats and in 6-hydroxydopamine-treated SH-SY5Y human neuroblastoma cells. J Neurol Sci. 2003;215(1–2):105–110. doi:10.1016/S0022-510X(03)00204-1
- Campos E, Schiavi C, Benedetti P, et al. Effect of citicoline on visual acuity in amblyopia: preliminary results. Graefes Arch Clin Exp Ophthalmol. 1995;233(5):307–312. doi:10.1007/BF00177654
- Elbialy ZI, Assar DH, Abdelnaby A, et al. Healing potential of Spirulina platensis for skin wounds by modulating bFGF, VEGF, TGF-ß1 and α-SMA genes expression targeting angiogenesis and scar tissue formation in the rat model. Biomed Pharmacother. 2021;137:111349. doi:10.1016/j.biopha.2021.111349
- Ford KM, D’Amore PA. Molecular regulation of vascular endothelial growth factor expression in the retinal pigment epithelium. Mol Vis. 2012;18:519.
- Feng X, Chen Y, Zhang M, et al. Protective effect of citicoline on random flap survival in a rat mode. Int Immunopharmacol. 2020;83:106448. doi:10.1016/j.intimp.2020.106448
- Soetaert K. plot3D: plotting multi-dimensional data, R package version 1.1. 2017:1.
- Khalil M, Hashmi U, Riaz R, et al. Chitosan coated liposomes (CCL) containing triamcinolone acetonide for sustained delivery: a potential topical treatment for posterior segment diseases. Int J Biol Macromol. 2020;143:483–491. doi:10.1016/j.ijbiomac.2019.10.256
- Ruckmani K, Sankar V. Formulation and optimization of zidovudine niosomes. Aaps Pharmscitech. 2010;11(3):1119–1127. doi:10.1208/s12249-010-9480-2
- Eid HM, Naguib IA, Alsantali RI, et al. Novel chitosan-coated niosomal formulation for improved management of bacterial conjunctivitis: a highly permeable and efficient ocular nanocarrier for azithromycin. J Pharm Sci. 2021;110(8):3027–3036. doi:10.1016/j.xphs.2021.04.020
- Elkomy MH, Elmowafy M, Shalaby K, et al. Development and machine-learning optimization of mucoadhesive nanostructured lipid carriers loaded with fluconazole for treatment of oral candidiasis. Drug Dev Ind Pharm. 2021;47(2):246–258. doi:10.1080/03639045.2020.1871005
- Mahmoud MO, Aboud HM, Hassan AH, et al. Transdermal delivery of atorvastatin calcium from novel nanovesicular systems using polyethylene glycol fatty acid esters: ameliorated effect without liver toxicity in poloxamer 407-induced hyperlipidemic rats. J Control Release. 2017;254:10–22. doi:10.1016/j.jconrel.2017.03.039
- Eid HM, Elkomy MH, El Menshawe SF, et al. Development, optimization, and in vitro/in vivo characterization of enhanced lipid nanoparticles for ocular delivery of ofloxacin: the influence of pegylation and chitosan coating. AAPS PharmSciTech. 2019;20(5):1–14. doi:10.1208/s12249-019-1371-6
- Aboud HM, Hassan AH, Ali AA, et al. Novel in situ gelling vaginal sponges of sildenafil citrate-based cubosomes for uterine targeting. Drug Deliv. 2018;25(1):1328–1339. doi:10.1080/10717544.2018.1477858
- Elkomy MH, El Menshawe SF, Eid HM, et al. Development of a nanogel formulation for transdermal delivery of tenoxicam: a pharmacokinetic–pharmacodynamic modeling approach for quantitative prediction of skin absorption. Drug Dev Ind Pharm. 2017;43(4):531–544. doi:10.1080/03639045.2016.1268153
- Elkomy MH, Elmenshawe SF, Eid HM, et al. Topical ketoprofen nanogel: artificial neural network optimization, clustered bootstrap validation, and in vivo activity evaluation based on longitudinal dose response modeling. Drug Deliv. 2016;23(9):3294–3306. doi:10.1080/10717544.2016.1176086
- Wilson RD, Islam MS. Fructose-fed streptozotocin-injected rat: an alternative model for type 2 diabetes. Pharmacol Rep. 2012;64(1):129–139. doi:10.1016/S1734-1140(12)70739-9
- Nourbar E, Mirazi N, Yari S, et al. Effect of hydroethanolic extract of Nigella sativa L. On Skin Wound Healing Process in Diabetic Male Rats. Int j Prev Med. 2019;10.
- Panda DS, Eid HM, Elkomy MH, et al. Berberine encapsulated lecithin–chitosan nanoparticles as innovative wound healing agent in type II diabetes. Pharmaceutics. 2021;13(8):1197. doi:10.3390/pharmaceutics13081197
- Correa VLR, Assis Martins J, Ribeiro de Souza T, et al. Melatonin loaded lecithin-chitosan nanoparticles improved the wound healing in diabetic rats. Int J Biol Macromol. 2020;162:1465–1475. doi:10.1016/j.ijbiomac.2020.08.027
- Ozler M, Simsek K, Ozkan C, et al. Comparison of the effect of topical and systemic melatonin administration on delayed wound healing in rats that underwent pinealectomy. Scand J Clin Lab Invest. 2010;70(6):447–452. doi:10.3109/00365513.2010.506926
- Suvarna KS, Layton C, Bancroft JD. Bancroft’s Theory and Practice of Histological Techniques E-Book. Elsevier Health Sciences; 2018.
- Puchtler H, Waldrop FS, Valentine LS. Polarization microscopic studies of connective tissue stained with picro-sirius red FBA. Beiträge Zur Pathologie. 1973;150(2):174–187. doi:10.1016/S0005-8165(73)80016-2
- El-Badry M, Fetih G, Fathalla D, et al. Transdermal delivery of meloxicam using niosomal hydrogels: in vitro and pharmacodynamic evaluation. Pharm Dev Technol. 2015;20(7):820–826. doi:10.3109/10837450.2014.926919
- Hashim IIA, Abo El-Magd N, El-Sheakh A, et al. Pivotal role of Acitretin nanovesicular gel for effective treatment of psoriasis: ex vivo–in vivo evaluation study. Int J Nanomedicine. 2018;13:1059. doi:10.2147/IJN.S156412
- Salem HF, Kharshoum RM, Sayed OM, et al. Formulation design and optimization of novel soft glycerosomes for enhanced topical delivery of celecoxib and cupferron by Box–Behnken statistical design. Drug Dev Ind Pharm. 2018;44(11):1871–1884. doi:10.1080/03639045.2018.1504963
- Tian F, Liu Y, Hu K, et al. The depolymerization mechanism of chitosan by hydrogen peroxide. J Mater Sci. 2003;38(23):4709–4712. doi:10.1023/A:1027466716950
- Shaker S, Gardouh AR, Ghorab MM. Factors affecting liposomes particle size prepared by ethanol injection method. Res Pharm Sci. 2017;12(5):346. doi:10.4103/1735-5362.213979
- Xu X, Khan MA, Burgess DJ. A quality by design (QbD) case study on liposomes containing hydrophilic API: II. Screening of critical variables, and establishment of design space at laboratory scale. Int J Pharm. 2012;423(2):543–553. doi:10.1016/j.ijpharm.2011.11.036
- Manojlovic V, Winkler K, Bunjes V, et al. Membrane interactions of ternary phospholipid/cholesterol bilayers and encapsulation efficiencies of a RIP II protein. Colloids Surf B Biointerfaces. 2008;64(2):284–296. doi:10.1016/j.colsurfb.2008.02.001
- Glavas-Dodov M, Fredro-Kumbaradzi E, Goracinova K, et al. The effects of lyophilization on the stability of liposomes containing 5-FU. Int J Pharm. 2005;291(1–2):79–86. doi:10.1016/j.ijpharm.2004.07.045
- Di Giulio A, Maurizi G, Odoardi P, et al. Encapsulation of ampicillin in reverse-phase evaporation liposomes: a direct evaluation by derivative spectrophotometry. Int J Pharm. 1991;74(2–3):183–188. doi:10.1016/0378-5173(91)90235-G
- Sreenivasa Reddy Y, Dinakar A, Srinivas L. Design development an d evaluation of citicoline controlled release tablets. Der Pharmacia Lettre. 2013;5:296–311.
- Imam SS, Alshehri S, Altamimi MA, et al. Formulation of piperine–chitosan-coated liposomes: characterization and In Vitro Cytotoxic Evaluation. Molecules. 2021;26(11):3281. doi:10.3390/molecules26113281
- Nguyen TX, Huang L, Liu L, et al. Chitosan-coated nano-liposomes for the oral delivery of berberine hydrochloride. J Mater Chem. 2014;2(41):7149–7159. doi:10.1039/C4TB00876F
- Xu R. Shear plane and hydrodynamic diameter of microspheres in suspension. Langmuir. 1998;14(10):2593–2597. doi:10.1021/la971404g
- Min GK, Bevan MA, Prieve DC, et al. Light scattering characterization of polystyrene latex with and without adsorbed polymer. Colloids Surf A Physicochem Eng Asp. 2002;202(1):9–21. doi:10.1016/S0927-7757(01)01060-3
- Ito T, Sun L, Bevan MA, et al. Comparison of nanoparticle size and electrophoretic mobility measurements using a carbon-nanotube-based coulter counter, dynamic light scattering, transmission electron microscopy, and phase analysis light scattering. Langmuir. 2004;20(16):6940–6945. doi:10.1021/la049524t
- Ueno H, Mori T, Fujinaga T. Topical formulations and wound healing applications of chitosan. Adv Drug Deliv Rev. 2001;52(2):105–115. doi:10.1016/S0169-409X(01)00189-2
- Biranje SS, Madiwale PV, Patankar KC, et al. Hemostasis and anti-necrotic activity of wound-healing dressing containing chitosan nanoparticles. Int J Biol Macromol. 2019;121:936–946. doi:10.1016/j.ijbiomac.2018.10.125
- Paul W, Sharma CP. Chitosan and alginate wound dressings: a short review. Trends Biomater Artif Organs. 2004;18(1):18–23.
- Samadian H, Ehterami A, Sarrafzadeh A, et al. Sophisticated polycaprolactone/gelatin nanofibrous nerve guided conduit containing platelet-rich plasma and citicoline for peripheral nerve regeneration: in vitro and in vivo study. Int J Biol Macromol. 2020;150:380–388. doi:10.1016/j.ijbiomac.2020.02.102
- Krupinski J, Abudawood M, Matou-Nasri S, et al. Citicoline induces angiogenesis improving survival of vascular/human brain microvessel endothelial cells through pathways involving ERK1/2 and insulin receptor substrate-1. Vasc Cell. 2012;4(1):1–11. doi:10.1186/2045-824X-4-20
- Liu Y, Zhang Q, Zhou N, et al. Study on a novel poly (vinyl alcohol)/graphene oxide-citicoline sodium-lanthanum wound dressing: biocompatibility, bioactivity, antimicrobial activity, and wound healing effect. Chem Eng J. 2020;395:125059. doi:10.1016/j.cej.2020.125059
- Pastar I, Stojadinovic O, Yin NC, et al. Epithelialization in wound healing: a comprehensive review. Adv Wound Care. 2014;3(7):445–464. doi:10.1089/wound.2013.0473
- Ahluwalia A, Tarnawski AS. Critical role of hypoxia sensor-HIF-1α in VEGF gene activation Implications for Angiogenesis and Tissue Injury Healing. Curr Med Chem. 2012;19(1):90–97.
- Li D, Yuan Q, Yu K, et al. Mg–Zn–Mn alloy extract induces the angiogenesis of human umbilical vein endothelial cells via FGF/FGFR signaling pathway. Biochem Biophys Res Commun. 2019;514(3):618–624. doi:10.1016/j.bbrc.2019.04.198
- Ibrahim NA. Evaluation of the effect of bee propolis cream on wound healing in experimentally induced type I diabetes mellitus: a histological and immunohistochemical study. Egypt J Histol. 2013;36(4):847–856.