Abstract
Because of its unique magnetic properties, the iron oxide (Fe3O4) nanoparticle has been widely exploited and its application in various fields has promised immense benefits. However, doubts exist over the use of Fe3O4-nanoparticles in human beings. Thus, the aim of the current study was to find out the potential safety range of medical use. Twenty-five Kunming mice were exposed to Fe3O4-nanoparticles via intraperitoneal injection daily for 1 week at doses of 0, 5, 10, 20, and 40 mg/kg. Hepatic and renal tissues were sliced for physiological observation. Injuries were observed in the high-dose groups (20 and 40 mg/kg) compared with the control group (0 mg/kg). Biomarkers of reactive oxygen species, glutathione, malondialdehyde, DNA-protein crosslinks, and 8-hydroxy-2′-deoxyguanosine in the hepatic and renal tissues were detected. Injury to tissues and oxidative damage to cells at the molecular level was found. The safest dose recommended from the results of this study is 5 mg/kg, as we believe this to be an upper limit balancing the benefits and risks for sub-long-term exposure.
Introduction
In 1959, Richard P. Feynman, a quantum physicist, gave a lecture entitled “There’s Plenty of Room at the Bottom,” which preluded the boom in nanotechnology. In the last decade, the integration of physics, chemistry, and the life sciences into nanotechnology has realized Feynman’s bold predictions. Nanotechnology is currently one of the leading and most promising technologies available. The enormous benefits of the application of nanotechnology in a variety of situations have been publicized. Specifically, nanoparticles are being used in drug delivery, gene transport, medical imaging, molecular diagnostics, and cardiac therapy,Citation1 as well as in the food, cosmetics, and environmental industries.Citation2 While nanotechnology is a technical revolution, the debate about the potential threat of large-scale nanoparticle use in humans, industry, and research is still ongoing. At present, there is limited information available to settle the debate over use in various industries and situations. Thus, although exciting, nanotechnology is still in its infancy despite the speed of development over the last decade.
The unique magnetic properties of nanomagnetite (Fe3O4-nanoparticles) have been largely exploited. Because of the simplicity of its synthesis and partial solubility in acidic media, compared with other nanoparticles like TiO2 and SiO2,Citation3 the Fe3O4-nanoparticle has become a much-studied area of research and application.Citation4–Citation6 Applications have included use as a printing ink, metal ion removal and magnetite filtration, biomolecule separation, and nuclear magnetic resonance imaging. Interestingly, nanomagnetite use is especially prominent in in vivo applications.Citation7 The most prevalent medical applications of Fe3O4-nanoparticles are the reinforcement of the magnetic resonance imaging signal and intracellular hyperthermia. In both cases, Fe3O4-nanoparticles are injected only once. Moreover, the use of Fe3O4-nanoparticles in drug delivery or as a drug adjuvant is potentially promising for the treatment of various kinds of cancers. For instance, Chen and his team strongly suggested that a combination of Fe3O4-nanoparticles and a short hairpin RNA (shRNA) expression vector might be an effective anti-multidrug resistance (MDR) method in leukemia cells.Citation8 Additionally, Fe3O4-nanoparticles can induce epidermal growth factor receptor expression, which is essential in tumor therapy.Citation9 Drug delivery in cancer will inevitably involve sub-long-term or even long-term injections of nanoparticles. Thus, whether or not repeated delivery of nanomagnetite into organisms, and humans specifically, will cause damage is of great concern. To date there is a lack of data concerning Fe3O4-nanoparticle safety. Moreover, inconsistent outcomes have made this topic even more ambiguous. Saba Naqvi and his colleagues concluded that nanomagnetite caused damage in a cell line via increased oxidative stress,Citation10 whereas a similar study concluded that it was safe.Citation11 The discrepancy in results may have been due to the use of different cell lines. As Coulter et al’s study suggested, cell type can influence the uptake, localization, and cytotoxicity of nanoparticles.Citation12 Hence, more systematic in vivo studies mimicking the possible effects in humans are urgently required.
Most medical application of nanoparticles is by direct injections, particularly peritoneal injection, which is convenient to carry out. In this study, Fe3O4-nanoparticles were injected peritoneally in Kunming mice. The range of injecting dose was decided according to results in our preliminary experiments before the formal ones. The final physiological effects in the liver and kidney of mice were examined. Additionally, we also investigated the key upstream events for any resulting damage. Finally, we also studied the reactive oxygen species (ROS) glutathione (GSH) and malondialdehyde (MDA), DNA-protein crosslinks (DPC), and 8-hydroxy-2′-deoxyguanosine (8-OH-dG) to examine the extent of oxidative stress and damage incurred. Our ultimate aim was to determine the boundary between a safe and dangerous dose.
Methods
Nanoparticles and chemicals
Fe3O4-nanoparticle (Sigma, St Louis, MO), 2′7′-dichlorodihydrofluorescein (DCFH-DA; Calbiochem, La Jolla, CA), 5,5′-dithiobis (2-nitrobenzoic acid) (DTNB; Sigma), and 2-thiobarbituric acid (TBA; Shanghai Reagent Factory, Shanghai, China) were used in experiments. All other chemicals used were of analytical grade.
Animals and grouping
A total of 25 8-week-old specific-pathogen-free (SPF) Kunming male mice, weighing 24–27 g, were obtained from the Experimental Animal Center of Hubei Province (Wuhan, China). The mice were randomly grouped into groups of five, and then housed in separate cages under standard conditions, with a 12/12-hour light–dark cycle. The mice were given free access to mouse chow and water. The groups were separated by nanoparticle exposure dose (5, 10, 20, and 40 mg/kg, respectively) and a phosphate-buffered saline (PBS; control) group. The volume of nanoparticles administered to mice depended on their weights in the proportion of 1% mL/g. Mice were given daily intraperitoneal injections of nanoparticles at a fixed time for 1 week.
Preparation and characterization of Fe3O4-nanoparticles
Fe3O4-nanoparticles (diameter < 50 nm) were suspended in PBS (pH 7.5) to create a stock solution at a concentration of 8 mg/mL, and diluted to 4, 2, 1, and 0.5 mg/mL as required. Ultrasonication was performed to disperse the coagulated particles just before each injection, thus excluding any disturbance of the heterogeneity of nanoparticles. Physical characterization of particles was performed to better define the material. The crystal appearance and diameters of nanoparticles were observed and measured under a scanning electron microscope (SEM). Nanoparticle zeta potential was measured using a Nano-ZS instrument (Malvern Instruments Ltd, Malvern, UK).
Histological examinations
Mice were sacrificed by having their eyes removed and blood drained after the 1-week exposure. Hepatic and renal tissues with little blood of mice were isolated for histopathology slice preparation. All samples were incubated in fixative (saturated 2, 4, 6-trinitrophenol; formalin; glacial acetic acid [15:5:1 v/v/v]) solution for 24 hours at room temperature. The fixated samples were then embedded in paraffin, sectioned into 10 μm thick slices and stained with hematoxylin and eosin (H&E; Sigma) for observation by a blinded pathologist under a Leica DM 4000B microscope (Leica Microsystems, Wetzlar, Germany).
Preparation of tissue cell suspensions and homogenates
Tissues were rinsed in ice-cold PBS. Hepatic and renal tissues were cut by medical scissors, placed in PBS on ice, and filtrated to form a single-cell suspension for DPC detection. The left half of each organ was dried and weighed. Afterwards, they were homogenized by a glass homogenizer on ice, using 10 mL/g of ice-cold PBS (pH 7.5). Next, three quarters of the homogenate was centrifuged at 10,000 g, 4°C for 10 minutes, and supernatants were collected for ROS, MDA, and GSH detection. The other quarter of the homogenate was centrifuged at 2300 g, 4°C for 10 minutes, and the supernatants collected for 8-OH-dG detection.
ROS determination
ROS level was determined based on the reaction between ROS, such as the hydroxyl radical, and DCFH-DA. DCFH-DA is immediately transformed into a highly fluorescent compound, DCFH, upon reaction with ROS, which can be quantified by a FLx 800 fluorescence reader (Bio-Tek, USA).Citation13 Supernatants were diluted 200-fold in PBS, and 100 μL of diluted supernatant was mixed with 100 μL DCFH-DA (20 μM, diluted 100-fold from dimethylsulfoxide [DMSO]-dissolved-stock solution) and placed into the well of a microplate. The reaction mixture was allowed to sit for 5 minutes in complete darkness and the ROS level was then detected by a fluorescence reader with 485 nm excitation and 520 nm emission wavelengths.
GSH depletion assay
GSH is a major scavenger of ROS in tissues. Thiols such as GSH can react with DTNB in the dark and form yellow compounds. Citation14 In case of disturbance of thiols from proteins, 10% trichloroacetic acid (TCA) was used to delimitate these proteins. Afterwards, the pH was adjusted to 7.5 to yield the color change reaction with DTNB (60 μg·mL−1, diluted 50-fold from DMSO-dissolved stock solution). Experimental and standard samples (reductive GSH; Sigma) were analyzed using a microplate reader at a wavelength of 412 nm. Based on the standard curve, the calculation was GSH (nmol/L) = OD412/0.0023.
MDA determination
MDA and thiobarbituric acid (TBA) can bind to each other at the boiling point of the mixture, forming pink pigments. We used a modified version of the originally described assay published by Draper and Hadley.Citation15 Briefly, a 0.5 mL tissue sample was mixed evenly with 0.6% TBA solution (dissolved in 10% TCA, acidic pH was neutralized by sodium hydroxide). Proteins were precipitated and pink pigments formed in the mixture during a 15-minute bath in boiling water. After a quick cooling process, the pink solutions were centrifuged at 10,000 g for 5 minutes and supernatants collected for absorbance detection at 450 nm, 532 nm, and 600 nm, respectively. MDA concentration was determined using the following standard curve equation by reference: CMDA (μmol/L) = 6.45(OD532 − OD600) − 0.56 OD450.
8-OH-dG ELISA assay
The levels of 8-OH-dG in the liver and kidney supernatants were measured using enzyme-linked immunosorbent assays (ELISA). A kit (RD Biosciences, San Diego, CA 92121, USA) specific for mice 8-OH-dG was used. All procedures were conducted according to the manufacturer’s instructions. Yellow-colored product formed in proportion to the amount of 8-OH-dG present in the samples or standards, and absorbance was measured at an optical density of 450 nm. The standard curve equation for the 8-OH-dG test was as follows: C(8-OG-dG) (ng/mL) = 13171 × OD-3825.4.
DPC determination
A KCl-sodium dodecyl sulfate (SDS) assay was used to determine DPC levels.Citation16 Briefly, DNA was released from suspended cells after exposure to SDS and sheared into fragments of a relatively uniform length by repeated aspiration using a pipette. Next, DNA wash buffer (0.1 M KCl, 0.1 mM EDTA, 20 mM Tris-HCl, pH 7.4) was added to the mixture, and then centrifuged at 100,000 g for 10 minutes, and protein-bound DNA was precipitated. Then, 1 mL supernatant was washed and precipitated again. After washing three times, the final pellet was re-suspended and incubated with proteinase K at 50°C for 3 hours to digest the protein and leave the protein-bound DNA intact. Thus, 3 mL of free DNA and 1 mL of protein-bound DNA was separated and collected. Afterwards, Hoechst 33258 was added to each 1 mL DNA sample, obtained from previous steps, for fluorescence measurement at an excitation wavelength of 350 nm and an emission wavelength of 460 nm. Finally, a DPC coefficient was expressed as the percentage of protein-bound DNA to total DNA (free DNA plus protein-bound DNA). The equation used was as follows: DPC coefficient = OD of protein-bound DNA/(3 × OD of free DNA + OD of protein-bound DNA).
Statistical analysis
All data in this paper are expressed as mean ± standard er ror of the mean (SEM). Statistical graphs were generated using Origin 7.0 software (OriginLab, Northampton, MA). One-way analyses of variance combined with Fisher’s protected t-test procedure of SPSS software (v. 12.0; SPSS Inc, Chicago, IL) were used to determine the significance of differences between groups. The statistical significance was P < 0.05.
Results
Characterization of Fe3O4-nanoparticles
To characterize and ascertain the properties of the nanoparticles used, the raw particle appearance, dispersed diameter (PBS, pH 7.5), and zeta potential were determined.
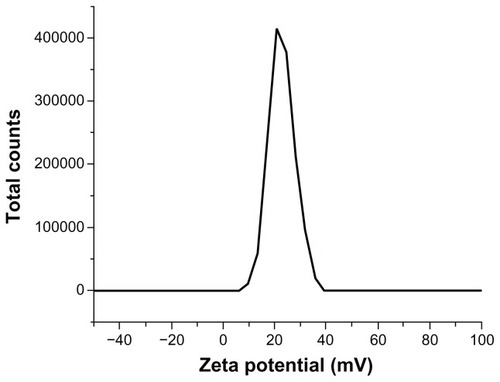
SEM showed that particles were smoothly sphere-shaped in appearance (). The measurement of particle diameters showed a normal distribution curve with an axis of 35 nm after ultrasonication dispersal (). More than 95% of the nanoparticle diameters were smaller than 50 nm. Surface charge is shown in the zeta potential graph (). The particles showed a frequency peak of approximately 20 mV.
Figure 1 Crystal appearance of Fe3O4-nanoparticles (SEM).
Abbreviation: SEM, scanning electron microscopy.
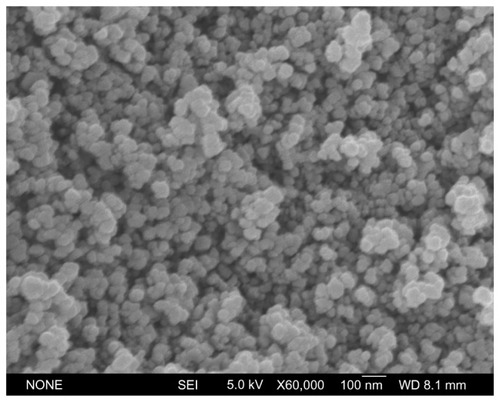
Figure 2 Size distribution of Fe3O4-nanoparticles dispersed in phosphate-buffered saline.
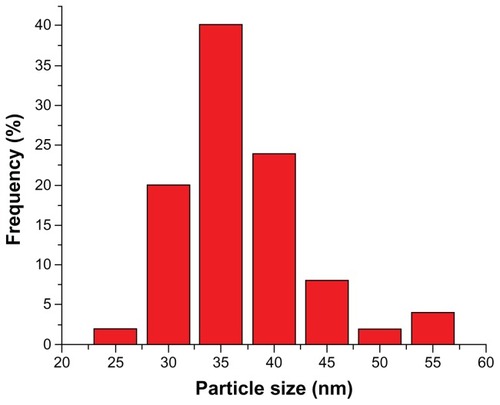
Figure 3 Zeta potential of Fe3O4-nanoparticles.
Histological pathologies
The liver and kidney are both major organs that participate in coping with stress caused by endogenous compounds and xenobiotics. Both organs underwent alterations in response to nanoparticle exposure ().
Figure 4 Liver and renal kidney slices (stained with hematoxylin and eosin). Row (A) presents pictures of Liver slices and Row (B) pictures of Kidney slices.
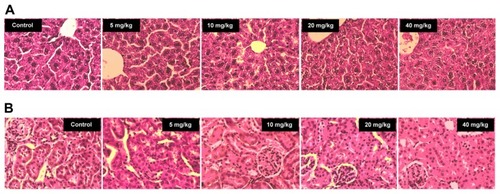
In healthy mouse livers, the sections showed well-preserved cell morphology and a prominent nucleus with a cord and sinus ratio of approximately 2:1. However, cells expanded, liver cords broadened, and liver sinuses contracted extensively in the 10 mg/kg nanoparticle group (). Mice suffered greater hepatic damage with increasing nanoparticle doses. At the maximum exposure dose, the liver slices became fuzzy and edematous with extremely loose cytoplasm. Kidney sections also showed signs of damage. A large reduction of tubular space and extreme edema of epithelial cells in glomeruli were observed, with increasing damage observed from 5 mg/kg to 40 mg/kg. In contrast, uninjured kidney slices appeared clear and healthy in appearance in the control group ().
Imbalance between oxidative and reductive pools
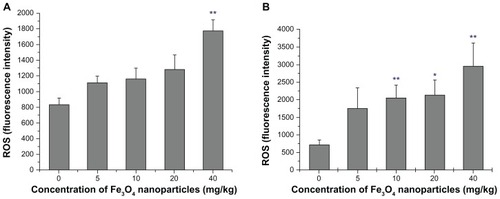
Together, upregulation of oxidizing agents, typically ROS, and exhaustion of antioxidants provide evidence of oxidative stress. The level of ROS found in the groups is shown in . ROS levels in liver tissues increased as the nanoparticle exposure dose increased, but only achieved statistical significance at 40 mg/kg (P < 0.01). In contrast, kidney tissues were associated with greater ROS content (). A significant increase in ROS level was recorded at only 10 mg/kg (P < 0.05). ROS balance in kidney thus seemed to be more vulnerable to nanomagnetite particles.
Figure 5 ROS level of liver and kidney homogenates. (A) presents the data of Liver and (B) the data of Kidney.
Notes: Compared with the control group, *indicates 0.01 < P < 0.05, **indicates P < 0.01.
Abbreviation: ROS, reactive oxygen species.
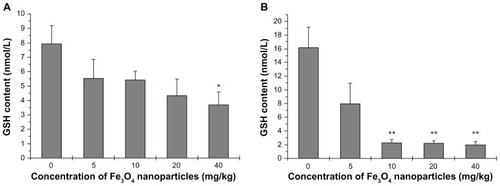
In accordance with the increase in ROS level, a slippery gradient of reduced GSH was detected in the liver (). There was a statistically significant increase in ROS in the 40 mg/kg group compared with the control group (P < 0.05). Decrease in GSH was found in kidney tissue in the 10 mg/kg group (P < 0.01) (). Cells in such conditions could be potentially susceptible to oxidative stress. Combining the changes of ROS and reduced GSH levels, especially in the 40 mg/kg group, an imbalance between ROS and GSH was particularly evident. The oxidative and reductive balance was unchanged only in the 5 mg/kg group.
Figure 6 Reduced-GSH level of liver and kidney homogenates. (A) presents the data of Liver and (B) the data of Kidney.
Notes: Compared with the control group, *indicates 0.01 < P < 0.05, **indicates P < 0.01.
Abbreviation: GSH, Glutathione.
Lipid peroxidation injury
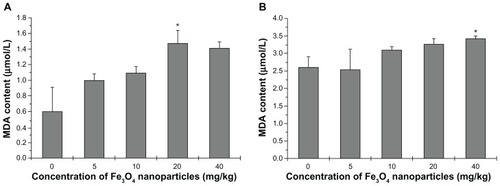
Phospholipids in cellular membranes contain a large quantity of allylic hydrogen, which is essential for cell integrity, but is vulnerable to free radical attack. MDA is a typical biomarker for lipid peroxidation injury evaluation. An increase in nanoparticle dose was associated with an increase of MDA in tissue homogenates, except at 20 mg/kg to 40 mg/kg where a trend for a decrease in MDA was seen at 40 mg/kg (). This result is not consistent with the ROS results, suggesting the possibility that cell death and apoptosis peaked in the maximum-dose group and superficially suppressed lipid peroxidation. Lipid peroxidation also occurred in the kidneys, especially at the highest dose of 40 mg/kg (P < 0.5) ().
Figure 7 MDA level of liver and kidney homogenates. (A) presents the data of Liver and (B) the data of Kidney.
Notes: Compared with the control group, *indicates 0.01 < P < 0.05.
Abbreviation: MDA, Malondialdehyde.
Genotoxicity associated with oxidative stress
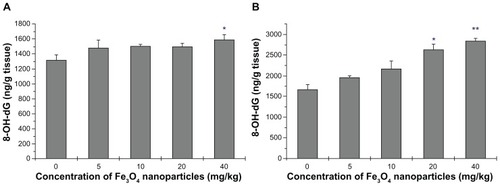
DNA damage was evaluated to assess the genotoxicity of Fe3O4-nanoparticles. Guanine bases in DNA are particularly active residues, and they are easily attacked by ROS to form 8-OH-dG. Unrepaired 8-OH-dG binds to thymidine rather than cytosine to cause transversion mutations. Kasai and Nishimura synthesized the guanosine derivative, 2′-deoxy-2′-(2″,3″-dihydro-2″1,4″-diphenyl-2″-hydroxy-3″-oxo-1″-pyrrolyl)guanosine, for screening environmental mutagens and carcinogens,Citation17 and successfully applied this method to the discovery and detection of 8-OH-dG in the late 1980s.Citation18 Research has shown that 8-OH-dG is increased in tissues, serum, and/or urine of patients who have oxidative stress-associated diseases. Changes in 8-OH-dG in this study are shown in (). In liver tissues, a significant increase in 8-OH-dG was found in the highest dose group (P < 0.5) (). Kidney tissues were more sensitive than livers, as DNA damage was seen in the 20 mg/kg dose (P < 0.5) and was even greater in the highest-dose group (P < 0.01) ().
Figure 8 8-OH-dG level of liver and kidney homogenates. (A) presents the data of Liver and (B) the data of Kidney.
Notes: Compared with the control group, *indicates 0.01 < P < 0.05, **indicates P < 0.01.
Abbreviation: 8-OH-dG, 8-hydmxy-2′-deoxyguanosine.
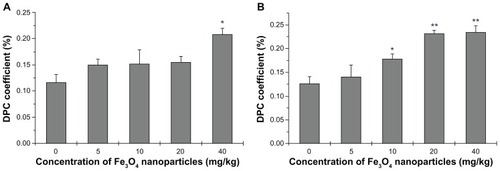
Another measure of DNA damage, DPC, was also used in this study (). The DPC coefficient is often elevated with oxidative stress.Citation16 The covalent crosslinking of proteins to DNA presents a major challenge to DNA metabolic machinery. The 40 mg/kg dose was associated with a significant increase in the DPC coefficient; no other groups had significant increases in DPC (). Kidney DNA was associated with more significant damage as the DPC coefficient was significantly increased in the 10 mg/kg group, and was increased by approximately 25% in the 20 and 40 mg/kg groups ().
Figure 9 DPC coefficient of liver and kidney homogenates. (A) presents the data of Liver and (B) the data of Kidney.
Notes: Compared with the control group, *indicates 0.01 < P < 0.05, **indicates P < 0.01.
Abbreviation: DPC, DNA-Protein Crosslinks.
Discussion
Compared with normal-sized materials, the Fe3O4-nanoparticle has distinctive physical and chemical characteristics. Its benefits as well as hazards for humans should be explored urgently to find a safe dose at which the risks and benefits of utilizing Fe3O4-nanoparticles are balanced.
In this study, we evaluated damage to mice liver and kidney tissues after exposing mice to certain Fe3O4-nanoparticles. Before this, routine tests for characterization were taken to better define the nanoparticles. Tests for material characterization were based on the surface/volume hypothesis concerning the bioactivity of nanoparticles. Although it may not explain the whole, one should not deny its significant impact on their performance in biological applications. Surface charge also has a significant effect on the particles’ bioactivity. For instance, the work of Patil et al suggested that zeta potential may function to alter protein adsorption and cellular uptake of nanoparticles.Citation19 The characterization of nanomaterials in this study did not indicate any potential threats to humans, but it did help to better define our research objectives.
After exposure to the defined particles, histological observations of the mice liver and kidney sections showed common pathological alterations. The cytoplasm was inflated and likely undermined cell integrity, and some cells appeared fused or collapsed. These general changes could lead to the onset of acute and chronic hepatic and/or renal diseases. Tissue injury becomes visible only after a number of cells have been damaged. At this stage, it is likely that impaired function and integrity of organs are already present.
Oxidative stress is related to tissue damage, and can cause further tissue damage. Therefore, we detected oxidative stress markers and associated damage to determine at what dose ROS level increases. ROS play a significant role in the defense against microorganisms and exogenous chemical compounds. Conversely, a long-term elevation in ROS level in tissues is associated with damage to large molecules including DNA, proteins, and lipids.Citation20,Citation21 In addition, ROS have been reported to be involved in signal transduction.Citation22,Citation23 Hence, high ROS levels can damage cell structure and function, and can induce apoptosis or necrosis, which may ultimately result in pathological changes and lead to organ dysfunction or cancers.Citation24–Citation26
Various studies have supported using Fe3O4-nanoparticles in cancer therapies. Wang et al suggested that Fe3O4-nanoparticles can mediate the enhancement of the anticancer efficacy of gambogic acid.Citation27 Daily injections of nanomagnetite for 1 week in mice mimics a simplified drug-delivery regime that could be used in humans. A high dose of nanoparticles was expected to significantly increase ROS level, and this was confirmed in our experiments. ROS up-regulation could lead to mitochondria dysfunction and to cell death.Citation24–Citation26 Moreover, exhaustion of the antioxidant pool (as shown by reduced GSH), and damaged phospholipids were also found in this study associated with the high dose. ROS damage to lipids, shown by increased MDA detection, may have been a cause of cell collapse, as seen in the histological observations. GSH reduction is associated with a lack of protection of proteins against oxidative stress, which may lead to protein dysfunction, protein–protein crosslinks, or even protein aggregation. Protein can also bind to DNA to form DPC. DPC and 8-OH-dG are both associated with DNA damage. Damage to genetic material can be heritable and is associated with negative effects to cells, such as generation of tumors.
Although nanoparticle toxicity is poorly understood, numerous studies using different cell types or animals and different nanomaterials, have suggested that oxidative stress is a major negative effect of nanoparticle use.Citation28–Citation34 Hyun-Jeong Eom and Jinhee Choi’s study showed that CeO2 nanoparticles were associated with oxidative damage to human bronchial epithelial cells (Beas-2B cells), via extracellular signal-regulating kinase (ERK), p38, and c-Jun N-terminal kinase (JNK) signaling pathways, along with nuclear factor-kappaB (NF-κB) and nuclear factor-E2-related factor-2 (Nrf-2) signaling.Citation35 Eun-Jung Park and Kwangsik Park indicated that oxidative stress, induced by silica nanoparticles in vivo and in vitro, might have been involved in proinflammatory responses.Citation36 Other upstream or downstream events, such as heat-shock protein activation, Citation37 changes in the expression pattern of NADPH oxidase, glutathione peroxidase, and glutathione reductase,Citation38 apoptosis induction,Citation39 and kinase activationCitation40–Citation42 have also been shown to be associated with nanoparticle use. In the current study, we found oxidative damage to cells and molecular changes after injection with nanoparticles, which was associated with hepatic and renal tissue injury. A limitation of the current study is that the adsorption, distribution, and metabolism of Fe3O4-nanoparticles were not studied. The metabolic enzymes in the liver, especially the CYP450 family, may also play important roles in inducing nanoparticle toxicity. Whether the release of ions can happen and what contribution to nanoparticle toxicity this would have are topics warranting further study.
Conclusion
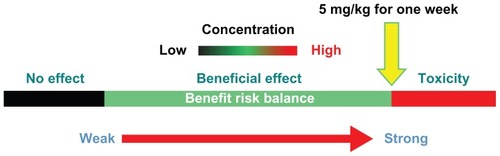
The hepatic and renal toxicity evaluation of Fe3O4-nanoparticles was conducted as outlined in . These experiments helped to determine a recommended tentative low-risk dose of Fe3O4-nanoparticle for in vivo systemic delivery over the course of 1 week. Considering all the biomarkers detected, we recommend that 5 mg/kg should be the highest safe dose used (). However, the lack of statistical significance associated with the 5 mg/kg group, in any of the measures of this study, could be due to the high variability within the group. Samples for each test in this study from only five mice were not high enough to accurately determine this. Longer treatment periods (ie, 2, 4, and 8 weeks) should be tested with a larger number of animals to confirm that a dose of 5 mg/kg is really safe.
Figure 10 Outline of experiment procedures.
Abbreviations: 8-OH-dG, 8-hydmxy-2′-deoxyguanosine; DPC, DNA-Protein Crosslinks; MDA, Malondialdehyde; ROS, reactive oxygen species; GSH, Glutathione.
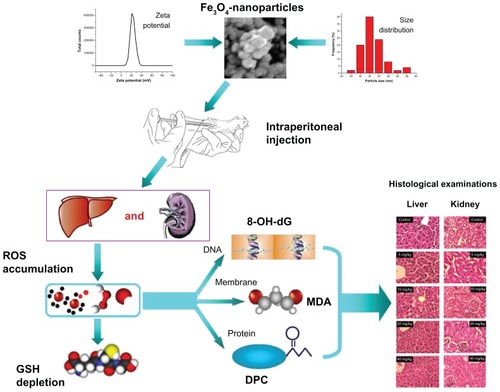
Figure 11 Expected safe dose of Fe3O4-nanoparticles for sub-long-term systematic delivery.
Acknowledgments
The authors are grateful to Professor Zhisong Lu (Institute for Clean Energy and Advanced Materials Southwest University, Chongqing China) for his kind help. Xu Yang would also like to thank Edanz Editing China for their work on an earlier draft of this manuscript.
Disclosure
This work was supported by a project grant from the Chinese National Program for High Technology Research and Development (863 Program) (Grant No 2006AA03Z330) and Key Project of the Chinese National Program for Fundamental Research and Development (973 Program) (Grant No 2010CB933904). The funders had no role in the study design, data collection and analysis, decision to publish, or preparation of the manuscript. The authors declare that no competing interests exist.
References
- SahooSKParveenSPandaJJThe present and future of nanotechnology in human health careNanomedicine20073203117379166
- HoodENanotechnology: looking as we leapEnviron Health Perspect2004112A74074915345364
- KraemerSMIron oxide dissolution and solubility in the presence of siderophoresAquat Sci200466318
- CaruthersSDWicklineSALanzaGMNanotechnological applications in medicineCurr Opin Biotechnol200718263017254762
- SimbergDDuzaTParkJHBiomimetic amplification of nanoparticle homing to tumorsProc Natl Acad Sci U S A200710493293617215365
- XuCJSunSHMonodisperse magnetic nanoparticles for biomedical applicationsPolym Int200756821826
- CabreraLGutierrezSMenendezNMagnetite nanoparticles: Electrochemical synthesis and characterizationElectrochim Acta20085334363441
- ChenBAMaoPPChengJReversal of multidrug resistance by magnetic Fe3O4 nanoparticle copolymerizating daunorubicin and MDR1 shRNA expression vector in leukemia cellsInt J Nanomedicine2010543744420957165
- ChungTHHsiaoJKHsuSCIron oxide nanoparticle-induced epidermal growth factor receptor expression in human stem cells for tumor therapyACS Nano201159807981622053840
- NaqviSSamimMAbdinMConcentration-dependent toxicity of iron oxide nanoparticles mediated by increased oxidative stressInt J Nanomedicine2010598398921187917
- HussainSMHessKLGearhartJMIn vitro toxicity of nanoparticles in BRL 3A rat liver cellsToxicol In Vitro20051997598316125895
- CoulterJAJainSButterworthKTCell type-dependent uptake, localization, and cytotoxicity of 1.9 nm gold nanoparticlesInt J Nanomedicine201272673268522701316
- CrowJPDichlorodihydrofluorescein and dihydrorhodamine 123 are sensitive indicators of peroxynitrite in vitro: implications for intracellular measurement of reactive nitrogen and oxygen speciesNitric Oxide199711451579701053
- AndersonMEDetermination of glutathione and glutathione disulfide in biological samplesMethods Enzymol19851135485544088074
- DraperHHHadleyMMalondialdehyde determination as index of lipid peroxidationMethods Enzymol19901864214312233309
- LiuYLiCMLuZStudies on formation and repair of formaldehyde-damaged DNA by detection of DNA-protein crosslinks and DNA breaksFront Biosci20061199199716146790
- KasaiHHayamiHYamaizumiZDetection and identification of mutagens and carcinogens as their adducts with guanosine derivativesNucleic Acids Res198412212721366701096
- KasaiHNishimuraSHydroxylation of deoxyguanosine at the C-8 position by ascorbic acid and other reducing agentsNucleic Acids Res198412213721456701097
- PatilaSSandbergAHeckertEProtein adsorption and cellular uptake of cerium oxide nanoparticles as a function of zeta potentialBiomaterials2007284600460717675227
- DasMBabuKReddyNPOxidative damage of plasma proteins and lipids in epidemic dropsy patients: Alterations in antioxidant statusBiochim Biophys Acta2005172220921715715957
- SidorczukMGBrzóskaMMJurczukMOxidative damage to proteins and DNA in rats exposed to cadmium and/or ethanolChem Biol Interact2009180313819428343
- ChenKThomasSRKeaneyJFBeyond LDL oxidation: ROS in vascular signal transductionFree Radic Biol Med20033511713212853068
- WangXLiuJZHuJXROS-activated p38 MAPK/ERK-Akt cascade plays a central role in palmitic acid-stimulated hepatocyte proliferationFree Radic Biol Med20115153955121620957
- FangJSekiTMaedaHTherapeutic strategies by modulating oxygen stress in cancer and inflammationAdv Drug Deliv Rev20096129030219249331
- KhandrikaLKumarBKoulSOxidative stress in prostate cancerCancer Lett200928212513619185987
- UedaSMasutaniHNakamuraHRedox control of cell deathAntioxid Redox Signal2002440541412215208
- WangCZhangHChenBStudy of the enhanced anticancer efficacy of gambogic acid on Capan-1 pancreatic cancer cells when mediated via magnetic Fe3O4 nanoparticlesInt J Nanomedicine201161929193521931488
- WangFGaoFLanMOxidative stress contributes to silica nanoparticle-induced cytotoxicity in human embryonic kidney cellsToxicol In Vitro20092380881519401228
- AhamedMAlSalhiMSSiddiquiMKJSilver nanoparticle applications and human healthClin Chim Acta20104111841184820719239
- YuSRuiQCaiTClose association of intestinal autofluorescence with the formation of severe oxidative damage in intestine of nematodes chronically exposed to Al2O3-nanoparticleEnviron Toxicol Pharmacol20113223324121843804
- ParkEJChoiJParkYKOxidative stress induced by cerium oxide nanoparticles in cultured BEAS-2B cellsToxicology20082459010018243471
- ReddyARNReddyYNKrishnaDRMulti wall carbon nanotubes induce oxidative stress and cytotoxicity in human embryonic kidney (HEK293) cellsToxicology2010272111620371264
- ParkEJYiJChungKHRyuDYOxidative stress and apoptosis induced by titanium dioxide nanoparticles in cultured BEAS-2B cellsToxicol Lett200818022222918662754
- HuangCCAronstamRSChenDROxidative stress, calcium homeostasis, and altered gene expression in human lung epithelial cells exposed to ZnO nanoparticlesToxicol In Vitro201024455519755143
- EomHJChoiJOxidative stress of CeO2 nanoparticles via p38-Nrf-2 signaling pathway in human bronchial epithelial cell, Beas-2BToxicol Lett2009187778319429248
- ParkEJParkKOxidative stress and pro-inflammatory responses induced by silica nanoparticles in vivo and in vitroToxicol Lett2009184182519022359
- AhamedMPosgaiRGoreyTJSilver nanoparticles induced heat shock protein 70, oxidative stress and apoptosis in Drosophila melanogasterToxicol Appl Pharmacol201012426326919874832
- RahmanMFWangJPattersonTAExpression of genes related to oxidative stress in the mouse brain after exposure to silver-25 nanoparticlesToxicol Lett2009187152119429238
- ChoiJEKimSAhnJHInduction of oxidative stress and apoptosis by silver nanoparticles in the liver of adult zebrafishAqua Toxicol2010100151159
- LeeHMShinDMSongHMNanoparticles up-regulate tumor necrosis factor-α and CXCL8 via reactive oxygen species and mitogen-activated protein kinase activationToxicol Appl Pharmacol200923816016919450615
- WanRMoYZhangXMatrix metalloproteinase-2 and -9 are induced differently by metal nanoparticles in human monocytes: the role of oxidative stress and protein tyrosine kinase activationToxicol Appl Pharmacol200823327628518835569
- LiuXSunJEndothelial cells dysfunction induced by silica nanoparticles through oxidative stress via JNK/P53 and NF-κB pathwaysBiomaterials2010318198820920727582