 ?Mathematical formulae have been encoded as MathML and are displayed in this HTML version using MathJax in order to improve their display. Uncheck the box to turn MathJax off. This feature requires Javascript. Click on a formula to zoom.
Abstract
In this paper work, four naked nanocrystals (size range 80–700 nm) were prepared without any surfactant or polymer using the solvent/nonsolvent method. The effects of particle size on their solubility, dissolution, and oral bioavailability were investigated. Solubility and dissolution testing were performed in three types of dissolution medium, and the studies demonstrated that the equilibrium solubilities of coenzyme Q10 nanocrystals and bulk drugs were not affected by the dissolution media but the kinetic solubilities were. Kinetic solubility curves and changes in particle size distribution were determined and well explained by the proposed solubilization model for the nanocrystals and bulk drugs. The particle size effect on dissolution was clearly influenced by the diffusion coefficients of the various dissolution media, and the dissolution velocity of coenzyme Q10 increased as particle size decreased. The bioavailability of coenzyme Q10 after oral administration in beagle dogs was improved by reducing the particle size. For 700 nm nanocrystals, the AUC0–48 was 4.4-fold greater than that for the coarse suspensions, but a further decrease in particle size from 700 nm to 120 nm did not contribute to improvement in bioavailability until the particle size was reduced to 80 nm, when bioavailability was increased by 7.3-fold.
Introduction
Since Sucker et al produced nanoparticles in the 1980s,Citation1 nanonization has attracted much attention, especially for improving the bioavailability of poorly soluble drugs.Citation2–Citation7 For the oral administration of poorly soluble drugs, due to solubility limits and low dissolution velocity, there is a low concentration gradient between the gut and blood vessels, leading to limited transport, which consequently affects oral absorption. Increasing the solubility and dissolution rate is a promising approach. In this context, nanonization, ie, a reduction in particle size so that at least one dimension measures less than 1000 nm, has been developed based on theoretical considerations, such as the Ostwald–Freundlich equation,Citation2,Citation3,Citation5,Citation7,Citation8 the Noyes–Whitney equation,Citation2,Citation4,Citation6–Citation8 the Prandtl equation,Citation2,Citation5,Citation9 and Ostwald ripening.Citation7
Among these theories, the Ostwald–Freundlich equation is specific to nanonization as opposed to micronization, and has been used widely in the pharmaceutical industry, although it has attracted some controversy and has not as yet been thoroughly proven.Citation10 It is derived from the Kelvin equation, and expresses the dependence of saturation solubility or equilibrium solubility on particle size,Citation10 as follows:
where Sr = the solubility of particles of radius r, S∞ = the solubility of the solid of a plane surface (or consisting of large particles), λsl = interfacial tension, M = the molar mass, ρ = density of the solid, v = represents the number of moles of ions formed from one mole of electrolyte, v equals 1 for non-electrolytes, R = the gas constant, T = absolute temperature. This equation is applicable to spherical particles smaller than 1000 nm in size, especially 200 nm.Citation11
EquationEquation 2(2) is the Noyes–Whitney equation:Citation12,Citation13
where dC/dt = dissolution rate, D = diffusion coefficient, A = surface area, V = the volume of the dissolution medium, Cs = saturation solubility, Cx = the drug concentration of bulk solution, and h = hydrodynamic boundary layer thickness, which is also affected by particle size as expressed by the Prandtl equation.Citation9 This indicates that, after reduction of particle size, increased saturation solubility, an enlarged surface area, and a thinner diffusion layer could dramatically increase the dissolution velocity, thereby simultaneously improving bioavailability.Citation14 Ostwald ripening, like “a big fish eating a small fish,” is a process in which large crystals grow at the expense of smaller ones as a result of differences in solubility.
The particle size effect related to solubility, dissolution, and bioavailability has been documented by many researchers.Citation4,Citation6,Citation15–Citation17 However, the preparations used were stabilized by surfactants or polymers, so may not truly reflect the effects of particle size. Until now, investigations of the particle size effect using naked nanocrystals (ie, 100% drugs without any stabilizer) have rarely been reported.
For nanocrystal systems, obtaining high drug loadings is a challenge. There is a tendency towards precipitation or agglomeration to reduce the enlarged surface area, which usually need to be resisted by adding surfactants or stabilizers,Citation18 so that drug loadings of 86% (weight of itraconazole/total solid weight) for sub-300 nm itraconazole nanoparticles have been considered to be high.Citation19 There are only a few studies about the use of naked nanocrystals in the pharmaceutical industry to date,Citation20–Citation24 and most of the relevant research has only involved the preparation method. Wang et alCitation23 and Sun et alCitation24 prepared naked nanocrystals of different sizes with coenzyme Q10 using the solvent/nonsolvent method and studied the relationship between particle size and solubility in four ethanol–water solutions. However, there is still no systematic research on naked nanocrystals. Thus, the present study was designed to investigate further the effect of particle size on solubility and dissolution of coenzyme Q10 from another angle. In addition, the relationship between particle size and bioavailability was investigated using beagle dogs, since this is the accepted model for obtaining more stable data about oral administration.
Materials and methods
Materials
Raw coenzyme Q10 material was purchased from Yunnan Chuxiong Sun Pharmaceutical Co, Ltd (Yunnan, China). Coenzyme Q10 capsules were obtained from Shanghai Pukang Pharmaceutical Co, Ltd (Shanghai, China). Absolute ethanol (99.7% v/v) and isopropanol (99.7% v/v) were provided by Tianjin Bodi Chemical Holding Co, Ltd (Tianjin, China). Tween 20 was purchased from Tianjin Kermel Chemical Reagent Co, Ltd (Tianjin, China). High-performance liquid chromatography (HPLC) grade methanol was obtained from Jiangsu Hanbon Science and Technology Co, Ltd (Jiangsu, China) and ethanol was obtained from Tianjin Kermel Chemical Reagent Co, Ltd. All other chemicals and reagents were of analytical grade.
Preparation of naked coenzyme Q10 nanocrystal and coarse suspensions
A precipitation method was developed for producing suspensions of naked coenzyme Q10 nanocrystals. Briefly, 30.0 mg and 10.0 mg of coenzyme Q10 were separately dissolved into 3.0 mL of ethanol in a water bath at 60°C as the organic phase. This was then injected into 27.0 mL of double-distilled water at 14,000 rpm and stirred for 15 seconds (IKAT18 Ultra Turrax®, Germany) to obtain suspensions of 120 nm and 80 nm, respectively. The suspensions of 400 nm and 700 nm nanocrystals were prepared by dispersing 27.0 mL of double-distilled water into the organic phase in a 50°C water bath at 30 mL per minute and 15 mL per minute under stirring at 800 rpm and 400 rpm, respectively. The nanocrystal suspension of 80 nm was concentrated by ultrafiltration (Millipore, Bedford, MA). The coarse suspensions were produced by dispersing 30.0 mg of coenzyme Q10 in 30.0 mL of distilled water containing 10% v/v ethanol. The coenzyme Q10 content of the five suspensions was adjusted to about 1 mg/mL.
Characterization of nanocrystal suspensions
Particle size distribution and zeta potential
The particle size distribution of the naked nanocrystals was determined by dynamic light scattering using a PSS Nicomp 380 ZLS equipped with a He-Ne laser source at 632.8 nm (PSS Nicomp, Santa Barbara, CA) at 23°C under an angle of 90 degrees and characterized by intensity-weighted particle size. The suspension sample (about 1 mL) was placed inside the sample holder of the particle size analyzer and then determined directly without dilution. Once the required intensity was reached, an analysis was performed to obtain the mean particle size and polydispersity index. The zeta potential was also measured using the PSS Nicomp 380 ZLS.
Transmission electron microscopy
The samples of different-sized nanocrystal suspensions were diluted with distilled water, pipetted onto collodion film-coated copper grids with a mesh size of 300, dried using absorbent paper, stained with phosphorus tungsten acid for 4 minutes, and finally dried under ambient conditions. Morphological evaluation of the particles was performed using a transmission electron microscope (JM-1200EX; JEOL, Tokyo, Japan).
Differential scanning calorimetry
Thermographs of the nanocrystals and bulk drugs in suspension were obtained using a differential scanning calorimetry instrument (1 STARe; Mettler Toledo, Schwerzenbach, Switzerland). Samples equivalent to 20 μg of coenzyme Q10 were placed in aluminum pans and heated from 20°C to 60°C at a scanning rate of 10°C per minute under a nitrogen purge of 40 mL per minute. The results were analyzed using STARe software. The liquid samples were then placed in separate aluminum pans and dried at room temperature for 12 hours to remove the solvent. Thermographs of dried samples were subsequently obtained under the same operating conditions.
Preparation of dissolution media
Three types of dissolution medium were utilized in this work to investigate the size effect in a series of in vitro dissolution and solubility experiments. Dissolution medium A contained 1.3% w/v Tween 20, dissolution medium B contained 1.3% w/v Tween 20 and 5.0% v/v isopropanol, and dissolution medium C contained 1.3% w/v Tween 20 and 10.0% v/v isopropanol.
Solubility measurement
Shaking behavior
The kinetic solubility of bulk coenzyme Q10 with different amounts of drug content was examined in dissolution medium A, and two types of shaking behavior were investigated. Samples of coenzyme Q10 2 mg, 6 mg, 10 mg, and 20 mg were each dispersed in 60 mL of dissolution medium, after which 3 mL of samples were transferred into vials that were capped and sealed with Parafilm®. Samples with the same drug content were taped in two directions, ie, horizontally and vertically, to the shaker platform, and then continuously agitated at 100 rpm in a water bath maintained at 25°C. The amount of drug dissolved was determined at different time points by passing each sample through a 0.1 μm Millipore filter and analyzing the drug concentration using reverse-phase high-performance liquid chromatography (HPLC). The measurements were repeated three times.
Solubility of CoQ10 nanocrystals and bulk drugs
The equilibrium solubility values for the four coenzyme Q10 nanocrystals and bulk drugs in the three types of dissolution medium were determined using the dilution method. Taking dissolution medium B as an example, 1 mL of the coenzyme Q10 nanocrystal suspensions of different particle size (drug content equals approximately 1 mg) was added to 2 mL of medium (containing 1.95% w/v Tween 20 and 7.5% v/v isopropanol) in a capped vial to give dissolution medium B (containing 1.3% w/v Tween 20 and 5.0% v/v isopropanol). The vial was sealed with Parafilm, taped horizontally to the shaker platform, and then continuously agitated at 100 rpm in a water bath maintained at 25°C. At different time points, the equilibrated samples were passed through a three-layer membrane filter (pore size from the top to bottom layer being 0.1 μm, 0.05 μm, and 0.1 μm), while a one-layer 0.05 μm Millipore filter was also investigated. The filtrate was analyzed by reverse-phase HPLC.
In vitro dissolution profile measurement
Dissolution studies of five coenzyme Q10 suspensions were conducted in a drug dissolution test apparatus (ZRS-8G, Tianda Tianfa Technology Co, Ltd, Tianjin, China) using the paddle method. Based on the solubility values obtained in the previous section, 0.6 mL of coenzyme Q10 nanocrystal suspension (containing 0.6 mg of coenzyme Q10) was dispersed in 900 mL of dissolution medium to create sink conditions. Dissolution was fixed at 100 rpm and temperature was maintained at 25°C. At predetermined time intervals, 3 mL of dissolution medium was withdrawn and replaced with the same volume of fresh medium. A 0.05 μm membrane filter was used to remove undissolved drug particles. Drug concentrations were quantified by HPLC and dissolution studies were performed in triplicate.
Bioavailability studies in beagle dogs
Twelve healthy beagle dogs (body weight 10.02 ± 0.57 kg) were supplied by the Experimental Animal Center at Shenyang Pharmaceutical University, Shenyang, China. Animal studies were performed in accordance with the guidelines for animal experimentation of Shenyang Pharmaceutical University and approved by the animal ethics committee of the institution. Four different sizes of coenzyme Q10 nanocrystal suspensions, coarse suspensions, and commercial capsules were orally administered to the 12 beagle dogs at a dose of 60 mg/body in a crossover manner. There was a washout period of one week between each consecutive dose. The dogs were fasted for 12 hours before dosing but had free access to water. Blood samples (1.5 mL) were collected from a antecubital vein into heparinized syringes at 0 (pre-dose), and at 0.17, 0.5, 1, 2, 3, 4, 6, 8, 12, 24, 36, and 48 hours after dosing. Serum samples were obtained by centrifugation of the blood samples and stored at −20°C until further analysis.
Analytical method
CoQ10 in dissolution media
Samples for solubility and dissolution investigations were subjected to HPLC using a system consisting of an HPLC pump (Model P230; Dalian Elite Analytical Instruments Co, Ltd, Dalian, China) and an ultraviolet detector (Model UV228; Dalian Elite Analytical Instruments Co, Ltd) set at 212 nm. A C18 column (Haito pack ODS C18, 4.6 mm × 100 mm, 5 μm; Zhongshan Haito Biomaterials Technology Ltd, Guangdong Province, China) operated at 30°C was used as an analytical column. The mobile phase, a mixture of methanol and ethanol (40:60, v/v), was delivered at a flow rate of 1.0 mL per minute and the injection volume was 100 μL.
Coenzyme Q10 in serum
Coenzyme Q10 in serum was determined by a validated HPLC method. First, 10 μL of internal standard solution (vitamin K1, 15 μg/mL in ethanol) was added to 100 μL of serum kept for 20 minutes at 37°C. After mixing thoroughly on a vortex mixer, 200 μL of methanol and 600 μL of hexane were added to the mixture and mixed well on the vortex mixer for 3 minutes. The mixture was then centrifuged at 10,000 rpm for 10 minutes, and 500 μL of supernatant was removed. The extraction was repeated twice in a similar fashion and 600 μL of supernatant was removed. The total volume of supernatant (1100 μL) was collected and dried under nitrogen. The residue was reconstituted in 100 μL of mobile phase which was a mixture of methanol and ethanol (30:70, v/v), followed by centrifugation at 10,000 rpm for 10 minutes and then determined by HPLC consisting of an HPLC pump and an ultraviolet detector (Model UV200II; Elite) set at 275 nm. A 20 μL sample was injected into a C18 column (Hypersil BDS C18, 4.6 mm × 150 mm, 5 μm; Elite) kept at 30°C and using the mobile phase for analysis at a flow rate of 1.0 mL per minute for 10 minutes. All experiments were performed under low lighting conditions.
Pharmacokinetic analysis
Standard pharmacokinetic parameters for coenzyme Q10 were obtained from the plasma concentration-time curves. These pharmacokinetic parameters included peak concentration of the drug in plasma (Cmax), the time taken to reach peak concentration, and the area under the curve (AUC0→48), which was calculated from 0 to 48 hours using a linear trapezoidal rule.
Statistical analysis
Statistical analysis was performed using one-way analysis of variance and the Student’s t-test with SPSS version 16.0 software (IBM Corporation, Armonk, NY). P-values less than 0.05 were considered to be statistically significant.
Results and discussion
Size distribution and zeta potential of coenzyme Q10 nanocrystals in suspension
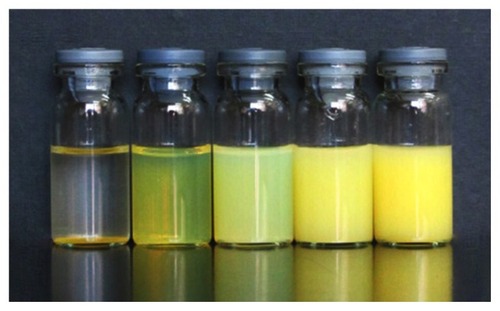
As shown in , suspensions of the bulk drug and the naked coenzyme Q10 nanocrystals of different sizes had different appearances. The drug contents of the five formulations were the same, and the difference in appearance was caused only by variations in size. It was found that all the nanocrystals were homodispersed, with a shift from a darker to lighter color on reduction in size. In contrast, the bulk drug dispersed in suspension was quite unstable and had sedimented completely by 2 days.
Figure 1 Suspensions of bulk drugs and naked coenzyme Q10 nanocrystals of different sizes after storage for 2 days at room temperature.
Notes: From left to right: bulk drugs, nanocrystals of 80 nm, 120 nm, 400 nm, and 700 nm, respectively. The drug content of all five formulations was about 1 mg/mL.
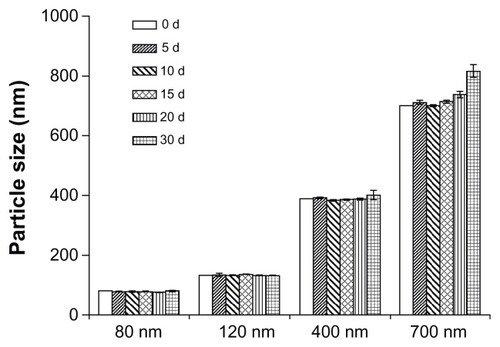
The average size, size distribution, and zeta potential for each of the four different-sized coenzyme Q10 nanocrystals are shown in , and the physical stability results are shown in . The average size of the coenzyme Q10 nanocrystals in the different suspensions was found to be 80.6 nm, 122.2 nm, 391.6 nm, and 680.1 nm (expressed as 80 nm, 120 nm, 400 nm, and 700 nm, respectively). The 400 nm- and 700 nm-sized nanocrystals were stable for at least 2 weeks, but the 80 nm- and 120 nm-sized nanocrystals were physically stable for up to 1 month at room temperature. Zeta potential measurement demonstrated that the nanocrystals in suspension were negatively charged, which might account for the adsorption caused by the large surface area, and contributed to their physical stability. Strong Brownian motion and small density differences between the coenzyme Q10 nanocrystals and the solvent could also have contributed to their stability.
Table 1 Particle size, polydispersity index, and zeta potential of coenzyme Q10 nanocrystals (n = 4)
Figure 2 Physical stability of the suspensions of naked coenzyme Q10 nanocrystals at room temperature (n = 3).
Evaluation of morphology and crystal form
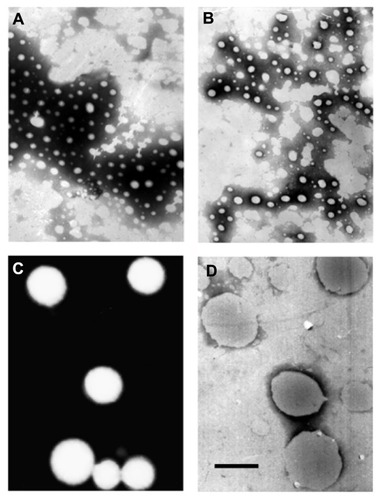
Transmission electron micrographs clearly show that the nanocrystals were rounded (), which is crucial for investigation of the relationship between size and solubility proposed by the classical Ostwald–Freundlich equation.
Figure 3 Transmission electron micrographs of coenzyme Q10 nanocrystals with particle sizes of (A) 80 nm, (B) 120 nm, (C) 400 nm, and (D) 700 nm.
Note: Bar = 500 nm.
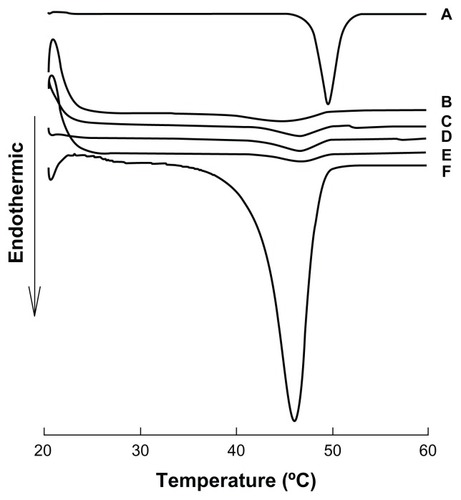
Differential scanning calorimetry and X-ray powder diffraction analysis are usually used to detect if the crystal form has changed. Because the coenzyme Q10 nanocrystals were prepared without any stabilizer and dispersed in an ethanol–water mixture, additional processes, such as lyophilization or other dry methods, could lead to a change in particle size. Therefore, nanocrystals in suspension were used in subsequent experiments. Small-angle X-ray scattering showed disappointingly low sensitivity for 80 nm nanocrystals in suspension, so liquid differential scanning calorimetry was chosen to investigate the original suspension sample. The results of liquid differential scanning calorimetry (see ) show that the nanocrystals failed to demonstrate the melting point of coenzyme Q10, even when concentrated 50-fold. Interestingly, the raw materials dispersed in water had a typical melting point of about 50°C, which disappeared after 4 hours of storage at room temperature, showing that the crystal transformation of coenzyme Q10 might be induced by the solvent. In order to validate this hypothesis, dried samples were used as a reference preparation. All the samples showed an obvious endothermic peak (see ), especially for the 50-fold concentrated 120 nm nanocrystal suspension, in which the amount of drug was high enough to produce sensitivity, and further showed solvent-induced crystal transformation.
Figure 4 Differential scanning calorimetry patterns of suspensions of coenzyme Q10 nanocrystals of different sizes and coarse suspensions.
Notes: (A) Coarse suspensions; (B) 80 nm, (C) 120 nm, (D) 400 nm, (E) 700 nm; (F) coarse suspensions after storage for 4 hours; (G) 50-fold concentrated 120 nm nanocrystal suspensions.
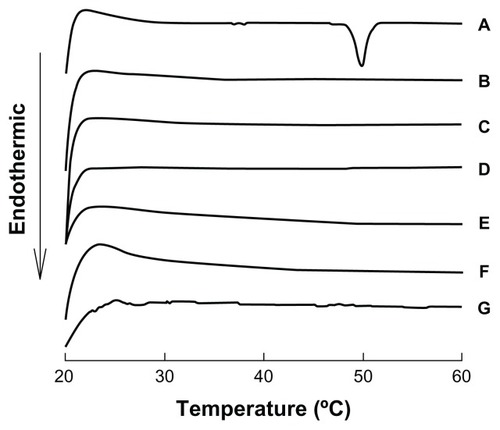
Figure 5 Differential scanning calorimetry patterns of dried suspensions of coenzyme Q10 nanocrystals of different sizes and coarse suspensions.
Notes: (A) Coarse suspensions; (B) 80 nm, (C) 120 nm, (D) 400 nm, (E) 700 nm; (F) 50-fold concentrated 120 nm nanocrystal suspensions.
Solubility
For poorly soluble coenzyme Q10, the aqueous solutions provided solubility and dissolution results which were too low for measurement, so the nonionic surfactant Tween 20 was used, in accordance with an already reported method.Citation25 Furthermore, different concentrations of isopropanol, which has lower volatility than ethanol, were added to prepare three different media for investigating the effects of size. Although the surfactant was used, it was added after the nanocrystals were prepared so as to develop an appropriate dissolution condition. This is different from the situation in which the surfactant was used as a stabilizer when nanocrystals were prepared. Even though all formulations were prepared using the same concentrations of surfactant, the density of the surfactants dispersed in different-sized nanocrystals was different due to the curvature and surface area.
Investigation of shaking behavior
In the literature, solubility is always measured by adding an excess amount of drug to the dissolution medium, while shaking continuously in a water bath and sampling at a fixed time (such as 24 hours).Citation4 Because determination of solubility at equilibrium takes a long time, and many problems, such as chemical instability, biodegradation, and solvent volatilization, can adversely affect the results, “kinetic” solubility is preferable and is frequently determined.
As shown in , drug content had obvious effects on kinetic solubility. The higher the drug content, the faster the dissolution rate and the shorter the time taken to reach equilibrium. The shaking behavior did not have a negligible effect. Solubility experiments are usually conducted at 100 rpm, but in our study, this rate of agitation was found to be weak and the vibration was distributed nonuniformly when the samples were placed vertically so that drug particles sedimented at the bottom of the tubes. The reduced surface area exposed to the dissolution medium resulted in a longer equilibrium time, as shown in . When the samples were placed horizontally, a full vibration effect was obtained and samples with a drug content of 0.10 mg/mL, 0.17 mg/mL, and 0.33 mg/mL all reached equilibrium by day 25.
Figure 6 Kinetic solubility of coenzyme Q10 at different drug contents ranging from about 0.03 mg/mL to 0.33 mg/mL.
Notes: Results are expressed as the mean ± standard deviation of three replicates. ● = 0.03 mg/mL; ♦ = 0.10 mg/mL; ▲ = 0.17 mg/mL; ♦ = 0.33 mg/mL. Solid line: placed horizontally; dotted line: placed vertically.
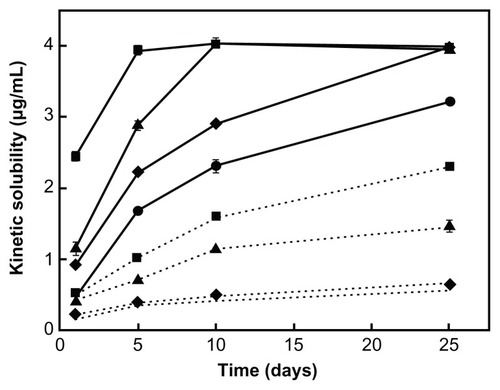
If equilibrium is not reached, a false impression that solubility is higher as drug content increases is created, leading to inaccuracy when comparing different drugs or formulations. Thus, when kinetic solubility is used as an index for comparison, it is essential to identify the amount of drug being used compared to the vague phrase “excess amount.” In addition, the method mentioned above could also be used for assessing equilibrium, and when the solubilities of more than two samples in a series of samples with varying drug content exhibit the same value after full agitation, equilibrium is reached, and the same value is the equilibrium solubility. It is worth noting that this method is not used for ionized drug, the solubility of which is dependent on drug content.
Solubility of coenzyme Q10 nanocrystals and bulk drug
Solubility experiments are usually conducted using drugs in the solid state. Considering that drying naked nanocrystals without any surfactant may change the particle size, and the adsorbed gas as a barrier would influence the dissolution rate,Citation26 the suspensions were used directly, ie, by adding a certain volume of nanosuspension or coarse suspension to a solution to obtain the final dissolution medium. In each final dissolution system, about 3.3% of ethanol residue was introduced by the nanosuspensions. Dialysis in water was initially used to remove ethanol from the nanosuspensions, but this was abandoned because the particle size changed and the particles became unstable. Therefore, each formulation was treated in the same way to ensure consistency. In addition, previous experiments indicated that the influence of 3.3% ethanol on solubility could be ignored.Citation24
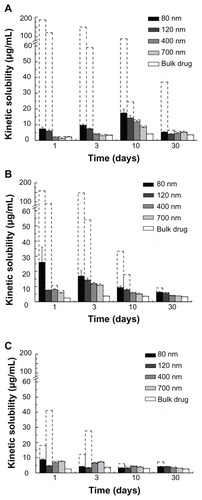
As shown in , the solubility values obtained using different Millipore filters differed greatly, especially for the 80 nm and 120 nm particle sizes. For 80 nm nanocrystals, after one day in dissolution medium A, the value obtained with the one-layer filter was 25.4-fold higher than that using the three-layer filter. Although both minimum pore sizes were 0.05 μm, small particles passed through the one-layer filter more easily. Further reduction of pore size, such as using a 0.03 μm filter, was not feasible, because water or ethanol had difficulty passing through. For this reason, a three-layer filter was used for the first time to obtain a better solid–liquid separation. The upper layer trapped large particles and prevented blockages, the middle layer, which is chosen based on the Nicomp distribution analysis intercepted small particles, while the bottom layer acted as a supporting surface, and the crisscrossing of layer to layer provided better solid-liquid separation and accurate solubility data as far as possible. For different sized nanocrystals, the kinetic solubility obtained using three-layer filters increased as the particle size decreased in this experiment.
Figure 7 Kinetic solubility of coenzyme Q10 nanocrystals and bulk drugs from the suspensions in three types of dissolution medium. Experiments were performed at 100 rpm and 25°C, and samples were placed horizontally for agitation. The drug content was about 0.33 mg/mL in every case. The results are expressed as the mean ± standard deviation of three replicates. (A) Distilled water containing 1.3% w/v Tween 20, (B) distilled water containing 1.3% w/v Tween 20 and 5.0% v/v isopropanol, and (C) distilled water containing 1.3% w/v Tween 20 and 10.0% v/v isopropanol.
Notes: Solid bar: passed through a three-layer membrane filter (the pore size from the top to bottom layer being 0.1 μm, 0.05 μm, and 0.1 μm); dashed bar: passed through a one-layer 0.05 μm Millipore filter.
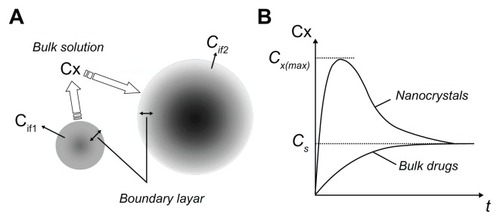
In a previous study, we proposed a new concept of “interfacial solubility” (Cif), which is the average concentration of the boundary layer and describes the dissolution process of nanocrystals and bulk drugs.Citation24 As shown in , “solubilization” is a kinetic process and involves both dissolution and precipitation, which occur at the same time but in different ratios, and usually proceed by diffusion. The driving force is the difference between the interfacial solubility (Cif) and the concentration of the bulk solution (Cx). The disjoining pressure of small particles is greater than that of large particles, so small particles have a higher interfacial solubility. Due to their higher differential concentration, thinner diffusion layer,Citation27 and increased surface area, small particles dissolve faster (). For small particles, extremely fast dissolution quickly increases the concentration of the bulk solution to achieve a supersaturated state. On account of the presence of residual particles which induce precipitation and an increasing degree of supersaturation, the rate of precipitation gradually increases until it becomes equal to the rate of dissolution when the bulk solution concentration reaches its maximum, Cx(max). The rate of precipitation then exceeds that of dissolution, the bulk solution concentration decreases, and desaturation increases. As the driving force of precipitation is gradually reduced, the concentration of the bulk solution finally reaches a plateau, which is the constant saturation solubility, Cs (ie, the equilibrium solubility). The concentration of the bulk solution Cx, usually measured in practice, is called the kinetic solubility,Citation8 which is a metastable state, and eventually returns to the equilibrium solubility (). This process happens when the concentration gradient is high enough. It happens faster after dilution, so that at last small particles would dissolve and precipitate into large particles, a process known as “Ostwald ripening.”
Figure 8 Solubilization model of nanocrystals and bulk drugs. (A) Solubilization process; (B) solubilization curves.
As shown in , the content of isopropanol had no obvious effect on the final equilibrium solubility of coenzyme Q10, while the kinetic solubility was different for the three types of dissolution medium, perhaps due to their different diffusion coefficients. As the content of isopropanol in the dissolution medium increased from 0% to 10%, ripening became faster, and the concentration of the bulk solution reached its maximum at days 10, 3, and 1, respectively. For the different-sized nanocrystals, the smaller the size, the faster the ripening process (see ). The trend of nanocrystal solubilization was that concentrations first increased to reach a supersaturated state and then decreased. In contrast, the concentrations increased gradually for bulk drugs.
Table 2 Size and size distribution of different coenzyme Q10 nanocrystals after dissolution in three types of dissolution medium for different predetermined timesTable Footnote*
Ripening is a problem when investigating the relationship between particle size and equilibrium solubility in addition to solid-liquid separation, because it is an inevitable process and occurs at the same moment as dilution (as shown in ). When ripening happens, the values obtained represent kinetic solubility rather than equilibrium solubility, and small particles change to large ones when absolute equilibrium is reached. The best method is to determine the equilibrium solubility of coenzyme Q10 nanocrystals in suspension directly without dilution, after nanocrystal suspensions of uniform particle size have been prepared. Unfortunately, this is limited by absorption of coenzyme Q10 onto the Millipore filter.
In vitro dissolution study
In vitro dissolution of coenzyme Q10 from the suspensions containing 80 nm, 120 nm, 400 nm, or 700 nm naked nanocrystals and bulk drugs was also investigated in the three types of dissolution medium. Dissolution of nanocrystals smaller than 200 nm is seldom documented. In this paper, dissolution conditions were selected based on the following considerations: the barrier effect for diffusion caused by dialysis bags, which is a common method for dissolution testing, should be avoided;Citation28 the centrifugation method is used extensively for solid-liquid separation, but is not able to separate out small coenzyme Q10 nanocrystals (a suspension of 139 nm nanocrystals was centrifuged at 30,000 rpm for one hour, and the size distributions of the top, middle, and bottom layers were all the same). There are also reports of using ultracentrifugation or centrifuging twice,Citation29,Citation30 but this takes a considerably longer time and is conducted at a low temperature, which changes the drug dissolution conditions; submicron particles, eg, 80 nm, can easily pass through common filters (≥0.1 μm),Citation4,Citation31 and the three-layer filters described in the previous section are not appropriate for timely sampling. Although in vitro dissolution is often used to predict the in vivo behavior of drugs and experiments are usually carried out at 37°C, the temperature was set at 25°C considering the change in temperature during filtration with a 0.05 μm filter and the conditions being consistent with solubility measurement.
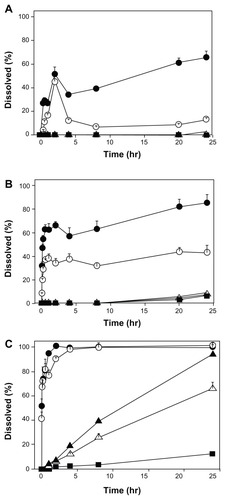
As shown in , the dissolution rate of coenzyme Q10 in the suspensions was clearly affected by particle size. In dissolution medium A, only the 80 nm and 120 nm nanocrystals showed marked dissolution. The peaks observed at 2 hours (51.4% and 45.2% for 80 nm and 120 nm, respectively) may be due to undissolved small particles passing through the 0.05 μm filter. In the case of the 80 nm nanocrystals, 65.4% of coenzyme Q10 was dissolved in 24 hours, while for the 120 nm nanocrystals this value was only 13.2%. In dissolution medium B, the difference in dissolution profiles for the 80 nm and 120 nm nanocrystals was further demonstrated. Both showed rapid dissolution in 30 minutes, with the former producing dissolution of 62.8% and the latter producing dissolution of 37.0%. The 120 nm nanocrystals then dissolved slowly, and the fraction only reached 43.3% in 24 hours. In contrast, the 80 nm produced a steady increase to 85.4%. Although the 400 nm and 700 nm nanocrystals and bulk drugs showed very little dissolution, their dissolution profiles were similar until the ratio of isopropanol increased to 10% v/v (ie, dissolution medium C). Under this condition, the 80 nm and 120 nm nanocrystals rapidly dissolved in 30 minutes and both reached 100% dissolution at 2 hours and 4 hours. The three different dissolution profiles were clearly not influenced by solubility, because the solubilities of coenzyme Q10 in the three types of medium were close, as shown in . The perfect sink conditions avoided supersaturation and consequent ripening, so that our results only reflect different diffusion behavior. As the content of isopropanol increased, diffusion became easier and dissolution proceeded faster. These findings indicate that the diffusion coefficient of the dissolution medium is an important factor, in addition to the solubility that influenced the particle size effect on dissolution.
Figure 9 Dissolution profiles of coenzyme Q10 nanocrystals and bulk drugs from the suspensions in three types of dissolution medium. (A) Distilled water containing 1.3% w/v Tween 20, (B) distilled water containing 1.3% w/v Tween 20 and 5.0% v/v isopropanol, and (C) distilled water containing 1.3% w/v Tween 20 and 10.0% v/v isopropanol.
Notes: The dissolution study was performed at 100 rpm and 25°C. About 0.6 mg of coenzyme Q10 was used in 900 mL of dissolution medium. The results are expressed as the mean ± standard deviation of three replicates. ● = 80 nm; ○ = 120 nm; ▲ = 400 nm; △ = 700 nm; ■ = bulk drugs.
Bioavailability study in dogs
All serum samples were analyzed following the HPLC method described earlier. Calibration curves (10–1000 ng/mL, eight concentrations) and quality control samples (50, 200, and 1600 ng/mL) were freshly prepared for each analysis. The lower limit of quantification using this method was 10 ng/mL. The linear regression coefficients for the calibration curves ranged from 0.99 to 0.9999. The accuracy and precision of the quality control samples ranged from 97.3% to 103.5% of nominal values, and 1.3% to 10.6% for the coefficient of variation, respectively. The results show that the method meets the requirements for biological sample analysis.
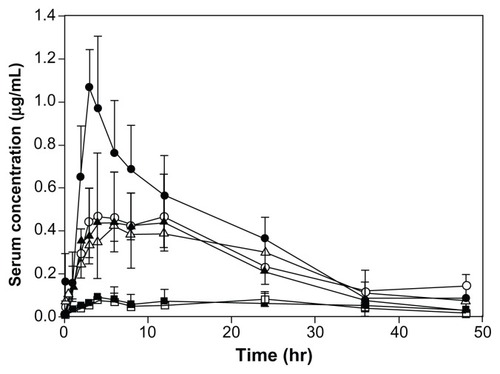
The serum concentration-time profiles and the pharmacokinetic parameters of coenzyme Q10 following oral administration of different-sized nanocrystal suspensions, coarse suspensions, and capsules in beagle dogs are presented in and , respectively. These results show that the absorption of coenzyme Q10 markedly improved as the particle size was reduced to the nanoscale range. Compared with coarse suspensions of the bulk drug, the Cmax and AUC0–48 of the naked coenzyme Q10 nanocrystal suspensions with particle sizes of 80 nm, 120 nm, 400 nm, and 700 nm were increased by 10.8-fold, 5.8-fold, 5.0-fold, and 4.5-fold, and by 7.3-fold, 5.1-fold, 4.7-fold, and 4.4-fold, respectively. Compared with commercial capsules, the values were increased by 9.2-fold, 4.9-fold, 4.2-fold, and 3.8-fold, and by 6.8-fold, 4.8-fold, 4.4-fold, and 4.1-fold, respectively. Although the differences in particle size were significant for coenzyme Q10 nanocrystals that were 120 nm to 700 nm in size, the increases in Cmax and AUC0–48 observed for these nanocrystal suspensions were almost the same (not statistically significant). This indicates that the particle size effect on oral absorption has a fixed range, and controlling the sizes in this range could achieve the same bioavailability, which makes application on an industrial scale more feasible. The significant discrepancy between the 80 nm and 120 nm nanocrystals in this regard may be attributed mainly to different degrees of uniformity. The 120 nm nanocrystals displayed a wide distribution (polydispersity index 0.156, see ) and had two major particle size groups (82 nm and 191 nm, respectively), which led to unstable behavior in vivo which was evident in the pharmacokinetic parameters, with large standard deviations (see ). This unusual result indicates that particle size uniformity is crucial for nanocrystals, because inhomogeneous nanocrystals were not only invalid but also showed increased individual differences.
Table 3 Pharmacokinetic parameters obtained after oral administration of different coenzyme Q10 nanocrystal suspensions, coarse suspensions, and capsules (n ≥ 4)Table Footnotea
Figure 10 Serum concentration–time profiles of coenzyme Q10 after oral administration of different suspensions and capsules at doses of 60 mg/body in beagle dogs.
Notes: Results are expressed as the mean, with the bars showing the standard deviation values. ● = 80 nm nanocrystal suspensions; ○ = 120 nm nanocrystal suspensions; ▲ = 400 nm nanocrystal suspensions; △ = 700 nm nanocrystal suspensions; ■ = capsules; □ = coarse suspensions (n ≥ 4).
Because coenzyme Q10 is classified as a Class II drug according to the Biopharmaceutics Classification System,Citation32 its absorption could be rate-limited by the dissolution process. Although there was no correlation between in vitro dissolution and in vivo bioavailability, the profiles shown in may still reflect the in vivo dissolution behavior. In the paper published by Jinno et al,Citation4 the absorption of cilostazol nanocrystals was lower in the fed state than in the fasted state, with results that were different from those for coarse suspensions. The authors considered that dissolution of cilostazol nanocrystals was rapid enough for absorption to be limited by permeability. The results of this dissolution experiment indicate that lesser absorption of nanocrystals in the fed state than in the fasted state might be partly due to a reduced diffusion coefficient after eating.
The particle size effect was not related to solubility at equilibrium, because the solubility at equilibrium was almost the same for all the four sizes of nanocrystals and the bulk drugs. The improvement in kinetic solubility, dissolution rate, and adhesionCitation18 should be responsible for the improved bioavailability of coenzyme Q10. Taken together, reduction in particle size from the microscale to the nanoscale could enhance bioavailability, but a further reduction in particle size did not contribute to the improvement in bioavailability until it was reduced to less than 100 nm.
Conclusion
Four naked stable coenzyme Q10 nanocrystals of different size were prepared and characterized to generate a drug model for investigating the effects of particle size. The kinetic solubility of four sizes of nanocrystals and bulk drugs was determined in three types of medium. The relationship between size and various solubilities (ie, kinetic solubility, equilibrium solubility) was studied. The results clearly show that particle size was related to kinetic solubility rather than equilibrium solubility. The biggest challenge in investigating the relationship between particle size and equilibrium solubility was found to be solid-liquid separation and the ripening process. A new concept of “interfacial solubility” and a solubilization model of nanocrystals and bulk drugs is proposed, based on the results of this study and is verified by trends in particle size and kinetic solubility. Dissolution testing of four nanocrystals and bulk drugs in three types of dissolution medium also clearly showed the effect of particle size, which was influenced by the diffusion coefficient. The effect of particle size on oral absorption has a fixed range, with coenzyme Q10 nanocrystals from 700 nm to 120 nm in size having similar bioavailability. Further, for small nanocrystals 120 nm in size, a wide size distribution (polydispersity index 0.156) increased the individual differences, which indicates that small is not always optimal. Our findings for naked nanocrystals may have significant implications for understanding problems of nanonization, ie, effects of particle size on solubility, dissolution, and in vivo bioavailability, and assist in the design of new nanodrug delivery systems.
Acknowledgment
This work was supported by the National Basic Research Program of China (973 Program 2009CB 930300).
Disclosure
The authors report no conflicts of interest in this work.
References
- GassmannPListMSchweitzerASuckerHHydrosols-alternatives for the parenteral application of poorly water soluble drugsEur J Pharm Biopharm19944026472
- MüllerRHJacobsCKayserONanosuspensions as particulate drug formulations in therapy: Rationale for development and what we can expect for the futureAdv Drug Deliv Rev200147131911251242
- DolencAKristlJBaumgartnerSPlaninsekOAdvantages of celecoxib nanosuspension formulation and transformation into tabletsInt J Pharm200937612220421219426794
- JinnoJKamadaNMiyakeMEffect of particle size reduction on dissolution and oral absorption of a poorly water-soluble drug, cilostazol, in beagle dogsJ Control Release20061111/2566416410029
- MüllerRHPetersKNanosuspensions for the formulation of poorly soluble drugs: I. Preparation by a size-reduction techniqueInt J Pharm19981602229237
- DongYNgWKShenSKimSTanRBHPreparation and characterization of spironolactone nanoparticles by antisolvent precipitationInt J Pharm20093751/2848819481693
- KesisoglouFPanmaiSWuYNanosizing – oral formulation development and biopharmaceutical evaluationAdv Drug Deliv Rev200759763164417601629
- MauludinRMüllerRHKeckCMKinetic solubility and dissolution velocity of rutin nanocrystalsEur J Pharm Sci2009364/550251019130880
- MosharrafMNyströmCThe effect of particle size and shape on the surface specific dissolution rate of microsized practically insoluble drugsInt J Pharm19951221/23547
- WuWNancollasGHA new understanding of the relationship between solubility and particle sizeJ Solution Chem1998276521531
- KippJEThe role of solid nanoparticle technology in the parenteral delivery of poorly water-soluble drugsInt J Pharm20042841/210912215454302
- NoyesAAWhitneyWRThe rate of solution of solid substances in their own solutionsJ Am Chem Soc18971912930934
- DokoumetzidisAMacherasPA century of dissolution research: from Noyes and Whitney to the Biopharmaceutics Classification SystemInt J Pharm2006321111116920290
- BabuVRAreefullaSMallikarjunVSolubility and dissolution enhancement: an overviewJ Pharm Res201031141145
- GhoshIBoseSVippaguntaRHarmonFNanosuspension for improving the bioavailability of a poorly soluble drug and screening of stabilizing agents to inhibit crystal growthInt J Pharm20114091/226026821371540
- KocbekPBaumgartnerSKristlJPreparation and evaluation of nanosuspensions for enhancing the dissolution of poorly soluble drugsInt J Pharm20063121/217918616469459
- RaoGCKumarMSMathivananNRaoMENanosuspensions as the most promising approach in nanoparticulate drug delivery systemsPharmazie20045915914964413
- RabinowBENanosuspensions in drug deliveryNat Rev Drug Discov20043978579615340388
- MatteucciMEHotzeMAJohnstonKPWilliamsRODrug nanoparticles by antisolvent precipitation: mixing energy versus surfactant stabilizationLangmuir200622218951895917014140
- ZhangJYShenZGZhongJPreparation of amorphous cefuroxime axetil nanoparticles by controlled nanoprecipitation method without surfactantsInt J Pharm20063231/215316016828244
- ZhangXXiaQGuNPreparation of all-trans retinoic acid nanosuspensions using a modified precipitation methodDrug Dev Ind Pharm200632785786316908423
- BabaKPudavarHERoyINew method for delivering a hydrophobic drug for photodynamic therapy using pure nanocrystal form of the drugMol Pharm20074228929717266331
- WangFSunJDengYHRelationship between particle size and solubility of coenzyme Q10 nanosuspensionsJ Shenyang Pharm Univ20102712933939
- SunJDengYHMaYLHanJEquilibrium solubility of naked nanocrystals is not related to particle sizeJ Shenyang Pharm Univ20112808585593
- AnkolaDViswanadBBhardwajVRamaraoPKumarMDevelopment of potent oral nanoparticulate formulation of coenzyme Q10 for treatment of hypertension: can the simple nutritional supplements be used as first line therapeutic agents for prophylaxis/therapy?Eur J Pharm Biopharm200767236136917452099
- SheridanPLBucktonGStoreyDEThe extent of errors associated with contact angles II. Factors affecting data obtained using a Wilhelmy plate technique for powdersInt J Pharm19941092155171
- AnderbergEKBisratMNyströmCPhysicochemical aspects of drug release. VII. The effect of surfactant concentration and drug particle size on solubility and dissolution rate of felodipine, a sparingly soluble drugInt J Pharm1988471/36777
- HengDCutlerDJChanHKYunJRaperJAWhat is a suitable dissolution method for drug nanoparticles?Pharm Res20082571696170118320295
- Van EerdenbrughBVermantJMartensJASolubility increases associated with crystalline drug nanoparticles: methodologies and significanceMol Pharm201016718581870
- BergstromCAWassvikCMJohanssonKHubatschIPoorly soluble marketed drugs display solvation limited solubilityJ Med Chem200750235858586217929794
- HecqJDeleersMFanaraDVranckxHAmighiKPreparation and characterization of nanocrystals for solubility and dissolution rate enhancement of nifedipineInt J Pharm20052991/216717715996838
- PalamakulaASolimanMKhanMMRegional permeability of coenzyme Q10 in isolated rat gastrointestinal tractsPharmazie200560321221415801676