 ?Mathematical formulae have been encoded as MathML and are displayed in this HTML version using MathJax in order to improve their display. Uncheck the box to turn MathJax off. This feature requires Javascript. Click on a formula to zoom.
Abstract
The main obstacles for cationic polyplexes in gene delivery are in vivo instability and low solid-tumor accumulation. Safe vectors with high transfection efficiency and in vivo tumor accumulation are therefore highly desirable. In this study, the amphiphilic block copolymer poly(n-butyl methacrylate)-b-poly(N-acryloylmorpholine) was synthesized by reversible addition–fragmentation chain-transfer (RAFT) radical polymerization. The corresponding well-defined vesicles with narrow size distribution were tailored by finely regulating the packing parameter (β) of copolymer (1/2 < β < 1). Compared with traditional “gold-standard” polycation (polyethylenimine, 25 kDa), plasmid DNA condensing efficiency, DNase I degradation protection, and cellular uptake were improved by the supramolecular nano vesicles. In addition, the plasmid DNA transferring efficiency in 10% fetal bovine serum medium was enlarged five times to that of polyethylenimine in renal tubular epithelial and human hepatocellular carcinoma cell lines. This improved in vitro transfection was mainly attributed to the densely packed bilayer. This stealth polyplex showed high serum stability via entropic repulsion, which further protected the polyplex from being destroyed during sterilization. As indicated by the IVIS® Lumina II Imaging System (Caliper Life Sciences, Hopkinton, MA) 24 hours post-intravenous administration, intra-tumor accumulation of the stealth polyplex was clearly promoted. This study successfully circumvented the traditional dilemma of efficient gene transfection at a high nitrogen-from-polyethylenimine to phosphate-from-DNA ratio that is accompanied with site cytotoxicity and low stability. As such, these simply tailored noncytotoxic nano vesicles show significant potential for use in practical gene therapy.
Introduction
In the last two decades, there has been ever-increasing interest in gene delivery research, as many diseases, tissue regeneration, and anticancer therapies have genetic bases.Citation1,Citation2 “Gene therapy” has been defined as the treatment of human disease by the transfer of guest genes into the patient’s specific host cells to correct missing genes, replace defective genes, or downregulate aberrant gene expression.Citation3,Citation4 Successful transference of the foreign gene to the nuclei of host cells involves many steps, including carrier fabrication, polyplex formation, in vivo long circulation, intracellular transportation, and endosomal escape. These all strongly rely on the properties of carriers. Traditional physical transferring methods, including electroporation, microinjection, and the gene gun, have not proved convenient for in vivo manipulation.Citation5 Further, the use of virus vectors with relatively high transfection efficiency has also been limited due to a few fatal accidents in clinical trials.Citation6,Citation7 As alternative non-virus candidates, liposomes and polymersomes have been developed in recent years.Citation8 However, liposomes, assembled from lipids, are multicomponent, generally heterogeneous in size, and have morphologically unstable structures, which result in relatively low transferring efficiencies.Citation9,Citation10 In contrast, synthesized polymer vectors have progressed very well due to their low immunogenicity, having no integration requirement and no limit on plasmid size, ability to be mass produced at a controlled quality, and ability to target specific cells.Citation11–Citation13
Among the tremendous number of synthesized polymers developed, polycations have been widely used due to their high affinity to anionic genetic materials. Polyethylenimine (PEI), the well-known “proton sponge,” which has modifiable properties, is an excellent candidate for fabricating nonvirus vectors as it has certain advantages, including that it is relatively easy to prepare, has tunable composition, and high transfection efficiency.Citation13–Citation16 Although PEI has performed well in transferring genes to in vitro cultured cells in serum-free conditions, successful gene delivery based on PEI is still rather difficult because of its undeterminable surface properties resulting in in vivo instability.Citation13,Citation17 Moreover, most of the previous studies based on PEI homo- or copolymers have shown that successful gene transfection requires the nitrogen-from-PEI/phosphate-from-DNA ratio (N/P) to be >7 or even more. This high N/P has led to undesirable cytotoxic effects on either the targeting cell or the normal tissue. In addition, it has been difficult to drain the excess PEI away at the intracellular level due to the very high N/P.Citation13,Citation18,Citation19 Thus, claims of high transferring efficiency via PEI (or other polycations) at a high N/P seem contradictory for in vivo application, which has limited its application in practical gene therapy.
The ideal polyplex should transfer genes in vivo in serum-containing conditions and escape enzyme degradation. Accumulation at the tumor post-intravenous injection should be as high as possible.Citation20 Fortunately, polymer vesicles self-assembled from a corresponding amphiphilic block copolymer have large hydrophilic hollow inner spaces and densely packed non-charged bilayer surfaces, which answer the outlined issues.Citation21–Citation23 The size, structure, and surface-chain density of vesicles can be collectively altered by regulating the copolymer’s molecular weight, polydispersity, and side-chain composition.Citation23–Citation26 Further, they can escape the reticuloendothelial system which can be suppressed via structural tailoring. Accumulation of vesicles at the tumor via the enhanced permeability and retention (EPR) effect can be promoted by well-defined chemistries and the fine-tuning of unique physicochemical properties.Citation27,Citation28
In this study, a well-defined amphiphilic block copolymer, poly(n-butyl methacrylate)x-b-poly(N-acryloylmorpholine)y (PBMAx-b-PNAMy), was finely prepared by reversible addition–fragmentation chain-transfer (RAFT) radical polymerization.Citation29 The hydrophobic to hydrophilic block ratio was regulated at 73/51, resulting in a packing parameter in the range of 0.5–1.0.Citation30 The well-defined vesicles were successfully prepared and characterized by dynamic light scattering (DLS) and transmission electron microscopy (TEM). Then a fluorescent reporting gene, pEGFP-N1, was condensed in situ into these novel vesicles in a self-assembly process. Two cell lines, renal tubular epithelial (293T) and human hepatocellular carcinoma (HepG2), were used to evaluate the promotion of transferring efficiency and this was tested by inverse fluorescent microscopy, flow cytometry, and confocal laser scanning microscopy. Entrapment efficiency, stability, and enhanced cellular uptake and intracellular transportation, as well as the corresponding mechanism, were also systemically investigated using quantum dot (QD) 605. The in vivo intra-tumor accumulation was evaluated in a BALB/c nude mouse xenografted tumor model and imaged using the IVIS® Lumina II Imaging System (Caliper Life Sciences, Hopkinton, MA).
Materials and methods
Materials
Branched PEI (Mw = 25,000 g/mol) was purchased from Sigma-Aldrich (St Louis, MO) and used as received. The macromolecular RAFT agent with disulfide bond and phenyl end-group poly(n-Butyl methacrylate) (PBMA) was kindly provided by Teruo Okano’s group (Tokyo Women’s Medical University, Tokyo, Japan). N-acryloylmorpholine (AM) was purchased from Wako Pure Chemicals (Osaka, Japan) and purified by distillation under reduced pressure. Also purchased from Sigma-Aldrich was 4,4′-Azobis(4-cyanopentanoic acid), which was purified by recrystallization. Sodium thiosulfate, tetrahydrofuran (THF), N,N-dimethylacetamide, diethyl ether, disodium hydrogen phosphate, monosodium phosphate, hydrated phosphotungstate, and highly purified 1,4-dioxane were obtained from Wako Pure Chemicals and used without further purification. Further, 2-Ethanolamine (Kanto Chemical Co, Tokyo, Japan), maleimide (Sigma-Aldrich), Dulbecco’s phosphate-buffered saline (PBS), bovine serum albumin (BSA; minimum 96%) (Sigma-Aldrich), and 1,2-dioleoyl-3-trimethylammonium-propane (chloride salt) (DOTAP; Avanti Polar Lipids, Alabaster, AL) were used as received. Water used in this study was purified by a Milli-Q A10 (Millipore Corporation, Billerica, MA) water purification system at resistivity ~18.2 MΩ · cm.
Synthesis of PBMAx-b-PNAMy diblock copolymers
PBMAx-b-PNAMy block copolymers with different hydrophobic/hydrophilic block lengths (x/y) were synthesized by RAFT radical polymerization using PBMA with a disulfide bond and phenyl end-group as macro-chain transfer agent (CTA).Citation31,Citation32 A macromolecular RAFT agent copolymerized with hydrophilic monomer AM with a small amount of radicals at 70°C is shown in the first step in . PBMA (10 mmol/L), 4,4′-Azobis(4-cyanopentanoic acid) (2 mmol/L), and AM (0.65 M) were dissolved in 10 mL 1,4-dioxane. The solution was then degassed through three freeze–pump–thaw cycles. The polymerization was conducted at 70°C for 24 hours. After polymerization, the solution was precipitated twice in excess diethyl ether then dried under vacuum to recover the pale pinkish polymer. The number of respective monomer units of b-poly(N-acryloylmorpholine) (BMA) and AM were described as x and y, respectively. X and y mainly changed with the monomer to initiator ratio.
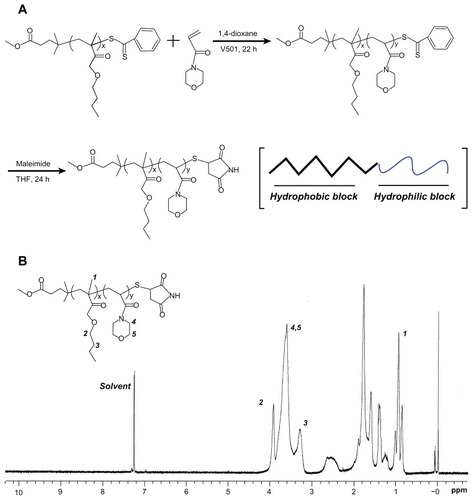
Figure 1 (A) The synthesis process: end-group conversion of PBMAx-b-PNAMy block copolymer (x/y = 73/51) by reversible addition–fragmentation chain-transfer polymerization. (B) Composition characterization of PBMA75-b-PNAM51 by proton nuclear magnetic resonance spectroscopy using chloroform-d as the solvent.
Abbreviations: PBMAx-b-PNAMy, poly(n-butyl methacrylate)x-b-poly(N-acryloylmorpholine)y; THF, tetrahydrofuran.
Aminolysis and conversion of polymer termini
As shown in the second step in , the phenyl group on the polymer termini was easily converted to a thiol group by aminolysis of dithiobenzoate.Citation33,Citation34 Briefly, the weight proportional amount of PBMA-b-PNAM diblock copolymer (0.015 mmol), 2 mol equivalent of sodium thiosulfate, and 40 mol equivalent of maleimide against terminal groups were dissolved in 5 mL THF deoxidized by N2 gas bubbling for 2 hours. Further, 2-Ethanolamine (20 mol equivalent to phenyl group) in 2 mL deoxidized THF was slowly dropped into the polymer solutions under bubbling N2 then the reaction was kept at room temperature and dark conditions for 24 hours in a nitrogen atmosphere. After the reaction, the solution was dialyzed against water using a dialysis tube (MWCO 1000, Spectra/Pro 6, Spectrum Medical Industries, Los Angeles, CA) to remove the unreacted chemicals and byproducts. Finally, the final white polymer products were recovered by freeze-drying.
Characterization of the block copolymers
The polymer chemical compositions were determined using a proton nuclear magnetic resonance (1H NMR) instrument (INOVA 400, Varian, Palo Alto, CA) using chloroform-d (Sigma-Aldrich) as the solvent (). The hydrophobic/hydrophilic block length was calculated based on ultraviolet (UV) using phenyl group absorption.Citation34
Cell culture
Two cell lines, 293T and HepG2, were obtained from the American Type Culture Collection (Manassas, VA). Cells were propagated and maintained in Dulbecco’s modified Eagle’s medium (DMEM) supplemented with 10% (v/v) fetal bovine serum (FBS). Cultures were incubated in a controlled-atmosphere incubator at 37°C with 5% CO2. DMEM and FBS were purchased from Gibco BRL (Grand Island, NY). Before the in vitro transfection and other experiments, the cells were pre-cultured until 75% confluence was reached.
Fabrication of vesicles
The vesicles were prepared by directly dissolving the block copolymer in acetone and mixing with 16 times the volume of this resultant solution of Milli-Q water followed by dialysis.Citation31 Briefly, 2.4 mg of block copolymer was dissolved in 0.3 mL of acetone under sonicate for about 2 minutes. After the polymer had dissolved completely, about 4.8 mL of Milli-Q water was added dropwise into the polymer solution under stirring over about 10 minutes. Then the solution was dialyzed against Milli-Q water using a membrane (molecular weight cut-off: 3500) at 4°C for 2 hours to remove the small amount of organic solvent. Following this, the solution was collected and the concentration was calculated at ~0.5 mg/mL by weighing. The vesicle solution was stocked for further characterization.
Characterization of vesicles
The hydrodynamic diameter and size distribution were determined by a ZetaSizer Nano-ZS (Malvern Instruments, Malvern, UK) equipped with a He-Ne laser (633 nm) at scattering angle of 173° with concentration ~0.05 mg/mL. To prepare stained specimens for standard TEM (using a Hitachi H-7000 [Tokyo, Japan] electron microscope) experiments, about 5 μL of the vesicle solution with a concentration of 1 mg/mL, diluted from the stocked solution using Milli-Q water, was dropped onto 200-mesh Formvar-free carbon-coated copper grids (Ted Pella Type-A; nominal carbon thickness 2–3 nm). After evaporating the water by exposing the grids to air at room temperature, the sample was inversely covered with a small drop of an aqueous hydrated phosphotungstate solution with a mass fraction of 2%. Conventional TEM images were obtained at 100 kV. The electronic pictures were converted from film by scanning.
Cytotoxicity assessment was carried out on 293T cells using a Cell-Counting Kit-8 (Dojindo Molecular Technologies, Inc, Rockville, MD) assay. Cells were seeded in a 96-well plate at an initial density of circa 5000 cells/well in 100 μL of complete DMEM. After 24 hours, the cells were treated with either vesicle or PEI at different concentrations ranging from 0 to 10 ug/mL. The treated cells were incubated in a humidified environment with 5% CO2 at 37°C for 48 hours. After washing twice with PBS, 100 μL of DMEM (FBS free) containing Cell-Counting Kit-8 was added to each well. The plate was then incubated in the dark at 37°C with 5% CO2 for about 3 hours. The absorbance (A) at 450 nm was recorded by a microplate reader (Thermo Multiskan MK3, Thermo Scientific, Waltham, MA). The cell viability was calculated as the following function:
where Asample, Acontrol, and Ablank are the absorbance values of the sample, the cells, and the culture medium, respectively.
Amplification and purification of plasmid DNA (pDNA)
A model pDNA encoding a red-shifted variant of the wild-type green fluorescence protein (GFP) (pEGFP-N1; Clontech Laboratories Inc, Mountain View, CA) was used in this study. This plasmid carries the SV40 promoter and enhancer that drive the firefly luciferase gene. The pEGFP-N1 plasmid was amplified in transformed Escherichia coli cultured in 1 mL Luria-Bertani medium containing 10 mg/mL of kanamycin then shaken at 280 rpm for 16 hours at 37°C. The amplified pEGFP-N1 was purified using the Concert Rapid Plasmid Miniprep Kit (Life Technologies, Carlsbad, CA). The purity of such pDNA was indicated by the A260/A280 value, which was about 1.8 and in the range 1.7–2.0. The concentration of pDNA was then measured by UV absorbance with a GeneQuant RNA/DNA Calculator (GE Healthcare, Little Chalfont, UK) at 260 nm. The purity of the pDNA was further confirmed using double restriction enzyme digestion with BamH1 and HindIII and indicated by 0.7% agarose gel electrophoresis.
Polyplex formation with pEGFP-N1 report gene
For the polyplex formed with PEI, proportional PEI was dissolved in Milli-Q water, then a pDNA solution was prepared with the calculated weight for the N/P = 10. Following this, the two solutions were mixed under vortex for about 5 minutes. For the vesicle/pDNA polyplex, the same amount of pDNA was mixed with an appropriate amount of block copolymer (containing DOTAP 5% molar to polymer) in 0.5 mL of acetone and vortexed for 3 minutes. Then about 4.5 mL Milli-Q water was added to this acetone solution under stirring followed by dialysis with Milli-Q water at 4°C for about 4 hours. The pDNA was entrapped in situ into the polyplex and the impurities, including any organic solvent, unloaded pDNA, and polymer, were removed by the dialysis. All the polyplex solutions were stored at ~4°C for future use. A hydrophilic Millipore membrane (MF-Millipore, Millipore Corporation) with pore sizes of 0.45 μm was used to clean the polyplex solution.
Characterization of the polyplex
The hydrodynamic diameter and size distribution were determined at 25°C using the Zetasizer Nano-ZS DLS instrument equipped with a He-Ne laser (633 nm) at a scattering angle of 173°. Each sample was measured in three runs and the average was calculated with cumulative errors smaller than 5%. The concentration was about 0.05 mg/mL in water. The zeta potential in aqueous solutions was measured using a Zetasizer 3000HS (Malvern Instruments) using 5 mM NaCl as the baseline.
Gel retardation assay
About 20 μL of the polyplex samples formed the freshly stocked pDNA (as marker) and PEI-pDAN (at the N/P ~ 10) and vesicle-pDNA were analyzed using 0.7% agarose gel containing 1:10,000 GelRed™ (Biotium, Inc, Hayward, CA) nucleic acid stain. This assay can be used to evaluate the pDNA condensing profile. Gel electrophoresis was carried out in 1 × Tris-acetate-ethylenediaminetetraacetic acid (EDTA) buffer (40 mM Tris-acetate, 1 mM EDTA) at 100 V for 30 minutes in an electrophoresis apparatus (FR-250, Shanghai FURI Science and Technology Co, Ltd, Shanghai, China). DNA bands were visualized using a UV lamp using a gel image analysis system (FR-980, Shanghai Furi). Heparin was used to evaluate the pDNA release profile as heparin can de-complex the pDNA from the polyplex. In general, a small amount of heparin was added to the abovementioned polyplex solution and kept for about 3 hours at room temperature. Then the polyplex incubated with different concentrations of heparin was analyzed to evaluate the release profile using the mentioned 0.7% agarose gel.
Naked pDNA and polyplex condensed with pDNA were incubated with and without 2 μL of DNase I at the concentration 0.5 unit/μL for 10 minutes at 37°C. The DNase I was then inactivated by adding EDTA (2.5 mM, 2 μL). After the inactivation, the solution was heated to 80°C and maintained at this temperature for about 2 minutes. The pDNA was then released from the polyplex by adding 10 mg/mL of heparin and keeping the solution at room temperature for about 3 hours. Finally, the polyplex solutions were analyzed using the mentioned 0.7% agarose gel.
Transfection efficiency evaluation by fluorescent microscopy and flow cytometry
For in vitro transfection studies, 293T/HepG2 cells were seeded onto 24-well plates at a density of 5 × 10⁴ per well in 0.5 mL of DMEM containing 1% antibiotics for 24 hours prior to transfection. For evaluating the proteins in the transfection, two parallel experiments were conducted using 0.5 mL of DMEM medium either with or without 10% FBS. Either the PEI- or vesicle-based polyplex solution containing 3 μg pDNA were added to each well and were incubated with the cells for 6 hours under standard culturing conditions. Then the medium was replaced with 0.5 mL of fresh DMEM supplemented with 10% FBS and cultured for a further 18 hours, resulting in a total transfection time of about 48 hours. It should be noted that all the polyplex solutions were filtrated using a hydrophilic Millipore (MF-Millipore with pore size ~450 nm) before being incubated with the cells. QD-605 aqueous solution obtained from Wuhan Jiayuan Quantum Dot Co, Ltd (Wuhan, China) was used to evaluate the intracellular internalization. The QD loading and incubation method was the same as that for the pDNA transfection. The fluorescent image of each sample was directly obtained by inverse fluorescent microscopy.
Flow cytometry was used to quantitatively indicate the fluorescent intensity of the pDNA or QDs for analyzing transfection efficiency, including cellular uptake and intracellular release. The 293T/HepG2 cells were seeded into 24-well microplates (1 × 10⁵ cells/mL, 500 μL/well) and cultured for 12 hours. The cells were then incubated with the PEI and vesicle polyplexes in the medium either with or without 10% FBS. After culturing at 37°C for about 6 hours, the medium was removed and gently rinsed twice with PBS. Then inverse fluorescent microscopy of the pDNA (green) and QDs (red) was undertaken. After the cells were rinsed and centrifuged, the mean fluorescence intensity (MFI) and the positive ratio were obtained using a FACScan Flow Cytometer (Becton Dickinson, San Jose, CA).
Confocal laser scanning microscopy (CLSM)
To further analyze the polymer vesicle-enhanced pDNA transfection and endocytosis efficiency, CLSM was used to investigate the polyplex endocytosis profile. The same amount of each of the polyplexes formed with PEI and vesicles were incubated with 293T/HepG2 cells for about 24 hours during which the plasmid pEGFP-N1 was taken up by the wild-type cells. After being rinsed at room temperature, the cells were transferred to a glass slide (Nalge Nunc International, Penfield, NY) was pre-attached on the bottom of the well of a six-well dish. The cell density was around 1 × 10⁵ cells/well in 2 mL of normal culture medium. After culturing on the glass slide for about 12 hours, the medium was piped out and the sample was rinsed twice with PBS. The samples were then fixed with 4% paraformaldehyde at room temperature for 15 minutes. Following this, 0.3% Triton X-100 was used to permeate the cells for another 15 minutes at room temperature. Slides were washed three times with PBS for 5 minutes each time then the nuclei were stained with 4′,6-diamidino-2-phenylindole (DAPI; 1:1000) at 37°C for 5 minutes in the dark. Samples were visualized using CLSM (LSM 710, Carl Zeiss, Oberkochen, Germany) excited at 488 and emissions were collected at the wavelength of 515 nm.
Serum stability examination using DLS
The interaction between the nano carriers and BSA was examined by DLS using a Zetasizer Nano S (Malvern Instruments). Firstly, the size and size distribution of the polyplex (PEI and vesicles with pDNA) with a concentration ~0.5 mg/mL and the BSA solution with a concentration ~25 mg/mL in PBS (10 ×) were measured by DLS. Secondly, the polyplex (concentration 0.5 mg/mL in water) was mixed with BSA (concentration 25 mg/mL in PBS) under stirring for about 5 minutes to form the mixture solution. The size and size distribution of the polyplex and BSA mixture was also measured by DLS.
In vivo tumor accumulation profile
The experimental animals (BALB/c nude mice, male, approximately 4–6 weeks old, ~20 g) were purchased from the Shanghai Experimental Animal Center of the Chinese Academic of Sciences (Shanghai, China). The mice were maintained in a pathogen-free environment and allowed to acclimate for at least 1 week before tumor implantation. Firstly, the tumor-bearing mice model was set up as follows: the BALB/c nude mice were inoculated subcutaneously on the right of their backs with 5 × 10⁶ human breast adenocarcinoma (MDA-MB-231) cells (in 100 μL culture medium) to develop xenograft tumors. After about 2 weeks, the volume of the tumors reached about 50 mm3. The success of the xenograft tumor model was demonstrated by tumor luminescent images. Briefly, mice were given an intraperitoneal injection of luciferin (Promega, Fitchburg, WI) at a dose of 150 mg/kg. The tumors were viewed using an IVIS® Lumina II Imaging System (Caliper Life Sciences, Hopkinton, MA), which captured visible light photographs and luminescent images. The immunofluorescence revealed a high epidermal growth factor receptor (EGFR) expression in MDA-MB-231 tumor tissues, indicating that the tumors were successfully xenografted in vivo.
In the following in vivo distribution experiments, the BALB/c nude mice were inoculated subcutaneously on the right of their backs with 5 × 10⁶ HepG2 cells (in 100 μL culture medium) to develop xenograft tumors. After about 2 weeks, the volume of tumors reached about 50 mm3. The mice bearing HepG2 tumors were randomly assigned to one of two groups with three mice/group. The PEI- and vesicle-based polyplexes containing fluorescein isothiocyanate (FITC) were administered once a day for three days via the tail vein with an overall dosage of 50 μg/mouse. One group received the PEI-based polyplex and the other received the vesicle-based polyplex. The distribution of the FITC accumulation profile was indicated by luminescent image 24 hours after the final injection. The mice were anaesthetized with 1.5% isoflurane in 1:2 O2/N2 then the IVIS imaging system was used to view the accumulation profile. All studies were performed in accordance with the guidelines of the Committee on Animals of the Second Military Medical University, Shanghai, China.Citation35
Data analysis
Data were accumulated and expressed as the means ± standard deviation. Student’s t-test was used to assess statistical significance of difference between group means, and P values of 0.05 were considered statistically significant.
Results and discussion
Polymer design for tailoring of well-defined vesicles
The structure and morphology of copolymers in bulk state are determined by the composition, solvent quality, temperature, and polymer concentration as described in the well-known copolymer phase diagram.Citation36 The composition of a copolymer is a thermodynamic factor, namely, a determining factor, whereas the concentration is a dynamic factor. Thus, the final structure and morphology of self-assembled aggregates strongly depend on the corresponding amphiphilic block copolymer compositions and concentrations.Citation37 For obtaining a well-defined structural aggregate, the first step is to synthesize a block copolymer with a unique composition. Living radical polymerization is a conventional method for regulating block compositions.Citation38 Among the specific methods available, RAFT radical polymerization is commonly used. RAFT radical polymerization can be applied to a wide range of monomers under mild experimental conditions.Citation39 In this study, we firstly used RAFT radical polymerization to synthesize a series of amphiphilic PBMAx-b-PNAMy block copolymers with different block lengths (x/y), as shown in . The hydrophobic macromolecular RAFT agent (PBAM73) containing a reactive end-group was used to link the hydrophilic monomer AM using the conventional process, which resulted in about 51 monomer units (PBMAx-b-PNAMy with x/y = 73/51) and a reaction efficiency of about 80%. The composition of this PBMA75-b-PNAM51 block copolymer was characterized by 1H NMR in chloroform-d, as shown in . The 1.0, 3.3, and 4.0 ppm correspond to the special H signal from PBMA of –CH3 and two –CH2 groups, respectively, on the side chain. While the characteristic signal at ~3.8 ppm was generated from the –CH2 on the morpholine group from AM, which clearly showed the AM was successfully introduced to the PBMA chains. The absorption wavelength of phenyl group at the end of the polymer is about 485 nm. Similar to our previous study,Citation33 there were about 51 hydrophilic monomer units – this was calculated based on UV testing. Both the 1H NMR and UV testing indicated the block linking and composition of the amphiphilic PBMA75- b-PNAM51 block copolymer. The relative molecular weight was also confirmed using gel permeation chromatography (Figure S1). Additionally, to avoid the hydrophobic phenyl group affecting the assembly, the phenyl end-group was converted to a hydrophilic maleimide group, as shown in the second step in .
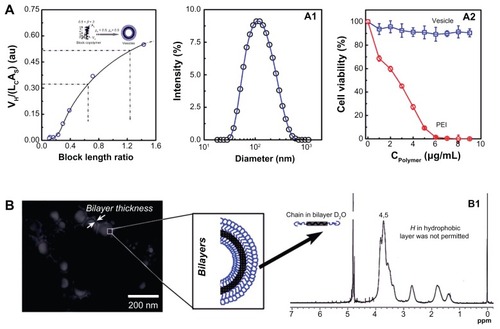
In our previous study, the copolymer composition on the aggregate structure in aqueous solution was systematically investigated. In the present study, to obtain the well-defined vesicles, the hydrophobic/hydrophilic block-length ratio was increased. shows the block copolymer composition’s dependence on its packing parameter (β) in aqueous solution. The β increased with hydrophobic/ hydrophilic block-length ratio. The condition for obtaining vesicles is that its β must be in the range of 0.5–1.Citation23,Citation37 The mechanism and tailoring of the vesicles will be discussed in the following section. shows the size and size distribution of the vesicles in aqueous solution. It can be seen that the vesicles have a relatively narrow size distribution around 100 nm. This size is preferable for gene delivery because the size range 20–200 nm is best for EPR. The cytotoxicity profile of such self-assembled vesicles is shown in . In the testing concentration range, the vesicles showed no cytotoxicity. However, the PEI seemed very toxic against 293T cells, with a half-cell survival concentration of <3 μg/mL. shows the morphology of the vesicles obtained using TEM. As marked in the TEM image, it is helpful to see that the vesicles fabricated in our experiments did have well-defined hollow inner hydrophilic cores (the pale inner disk) and bilayer structures (the light black circle surrounding the pale inner disk). It was expected that the hydrophilic inner space would entrap the hydrophilic oligonucleotides (pDNA) while the surrounding densely packed hydrophilic bilayer would stabilize the polyplex. In the middle of the bilayers, the hydrophobic blocks were densely arrayed. The freedom of H atoms along the hydrophobic chain was thus strongly limited, with the result that its signal was lost in NMR. As shown in , the signals of 2 and 3 indicated in disappeared in the D2O solution, proving that the well-defined structural nano non-cytotoxic vesicles were successfully tailored by regulating the block copolymer compositions.
Figure 2 (A) The conditions for vesicle formation, the hydrodynamic diameter, and the size distribution of the corresponding PBMA75-b-PNAM51 vesicle and its cytotoxicity profile in aqueous solution. (B) Transmission electron microscopy image of the morphology of the well-defined vesicles with hydrophilic hollow inner space and hydrophobic bilayer and structural confirmation by nuclear magnetic resonance spectroscopy.
Abbreviations: PBMA75-b-PNAM51, poly(n-butyl methacrylate)x-b-poly(N-acryloylmorpholine)y, with hydrophobic to hydrophilic block ratio regulated at 73/51; PEI, polyethylenimine.
pDNA loading, enzyme protection, and release
PEI is the best choice for the pDNA transfection due to its hypothesized ability to avoid trafficking to degradative lysosomes. Based on the “proton sponge” hypothesis, the buffering capacity of PEI contributes to osmotic swelling and rupture of endosomes, which results in release of the vector into the cytoplasm. However, as mentioned, PEI also has extreme cytotoxicity that has limited its application in vitro and in vivo. Many methods have been tried to reduce this cytotoxicity by modification of the PEI chain.Citation18 Chemical conjugation and polymerization with PEI may decrease the gene-condensing efficiency. Alternatively, to increase the transferring efficiency and in vitro/vivo stability of the polyplex, the N/P had to be increased to >10 or above.Citation19 However, this high N/P is, in fact, not suitable for the application of PEI.
Considering issues such as transferring efficiency, cytotoxicity, and stability, we designed and prepared a vesicle-based polyplex for gene delivery. The pDNA loading efficiency, enzyme protection, and release profile were investigated by gel retardation assay. The pDNA loading profile and DNA degradation protection profile were investigated as shown in . Here, band m was the marker. Bands r, d, p, and v were the pDNA, PEI/pDNA, polymer/pDNA, and vesicle/ pDNA, respectively, incubated without the DNA enzyme. Bands re, de, pe, and ve were pDNA, PEI/pDNA, polymer/pDNA, and vesicle/pDNA, respectively, incubated with the DNA enzyme. Following this, 10 mg/mL of heparin was added to all samples and deactivated with 2.5 mM 2 μL EDTA at 80°C for about 10 minutes. Both the pDNA and the degraded pDNA segments were released from the bands. Comparing all the bands, it is easily seen that only the pDNA entrapped in the vesicles was completely protected from the enzyme degradation as shown in band ve. The pDNA in the control, PEI, and polymer were almost degraded, as shown in bands re, de, and pe, respectively. Both the condensing and enzyme protection reflects that the vesicles not only increase the pDNA complexation but also protect the pDNA from enzyme degradation by the surrounding dense bilayer. The morphology of this vesicle-based polyplex was also characterized by TEM, as shown in Figure S2. This type of finely tailored polymer vesicle is different from liposomes in that the vesicles have unique properties such as uniform size, simple structures, tunable inner hydrophilic reservoirs, and surrounding densely packed non-charged bilayers. Thus, they represent a good alternative vector for in vitro/vivo gene delivery.
Figure 3 (A) Plasmid DNA (pDNA) condensation: DNA I enzyme-degradation protection profile analysis by 0.7% agarose gel retardation assay. Bands m (the marker), r, d, p, and v were the pDNA control, polyethylenimine (PEI)/pDNA, polymer/pDNA and vesicle/pDNA incubated with no enzyme, respectively; re, de, pe, and ve were pDNA control, PEI/pDNA, polymer/pDNA and vesicle/pDNA incubated with DNA enzyme, respectively. (B) pDNA condensing and releasing profiles of PEI, PBMA75-b-PNAM51 block copolymer, and vesicles at 10 mg/mL. (C) The heparin concentration dependence of the pDNA release for PEI/pDNA (bands c0–c4) and vesicle/pDNA (d0–d4).
Abbreviation: PBMA75-b-PNAM51, poly(n-butyl methacrylate)x-b-poly(N-acryloylmorpholine)y, with hydrophobic to hydrophilic block ratio regulated at 73/51.

The on-time release of pDNA at the target site is another key issue for successful gene therapy. Disassociation of pDNA from the polyplex is believed to occur when other anionically charged macromolecules or cellular components such as mRNA, sulfated sugars, and nuclear chromatin are added in the cell.Citation40 For the vesicle/pDNA system, the pDNA was entrapped in the inner hydrophilic core. Release of the solute (drug or pDNA) from the inner core of the vesicles was dominated by a diffusion mechanism, which, in turn, was dominated by the pDNA concentration difference between inner and outer sides of the vesicles.Citation41 In our experiments, a small amount of cationic DOTAP was inserted in the bilayer. The bilayer structure of the vesicles was disrupted by the heparin, which interacted with DOTAP. The pDNA disassociation from the vesicles was accelerated by adding the disassociation agent (heparin) into the polyplex solutions. Consequently, although the pDNA was entrapped in the inner core of the vesicles, it could be successfully released out in vitro/vivo. As shown in , the pDNA release at the disassociation agent concentration of about 10 mg/mL was clear. In the picture, band 1 was the marker. Bands 2, 4, 6, and 8 were the pDNA, pDNA in PEI, polymer, and vesicles, respectively, while bands 3, 5, 7, and 9 were their corresponding solutions incubated with heparin. Such heparin concentration dependence on the pDNA disassociation from PEI/pDNA and vesicle/pDNA polyplex was further evaluated with heparin concentrations of 2.5, 5, 10, and 20 mg/mL, as shown in . Bands m, b0, and c0 were the marker, the naked pDNA, and naked pDNA with heparin, respectively, which were used as control. Bands c1–c4 reflected the heparin concentration dependence of heparin on pDNA release from PEI/pDNA, while d0–d4 correspond to vesicle/pDNA. For PEI/pDNA, the pDNA was totally released at all heparin concentrations with little difference between c1 and c4. However, the release from d0 to d4 strongly depended on the heparin concentration, indicating that the vesicle/pDNA polyplex had high condensing capacity. This release difference between the two types of polyplex further confirmed that well-defined vesicles not only condense and stabilize preloaded pDNA but also protect it from enzyme degradation. The pDNA entrapped in the inner core can be successfully released with a controllable profile.
Effects of polyplex properties on cellular internalization
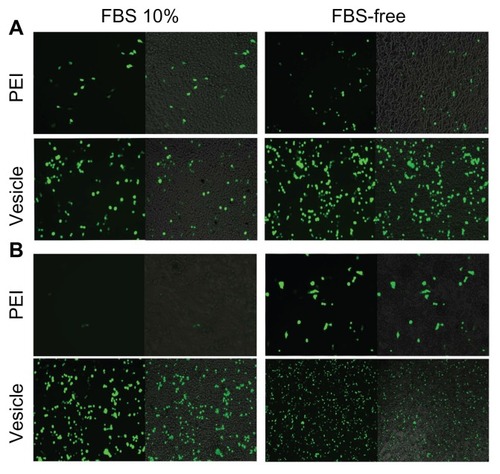
HepG2 and 293T cell lines were used to evaluate the pDNA transfection profile. It should be pointed out that FBS-free culture medium was always used in previous gene transfection studies,Citation42 which did not seem to be a problem for in vitro transfection. However, many biomacromolecules, including the serum proteins, circulate in the blood. In vivo gene therapy will face many types of proteins. Thus, gene-transferring experiments should be conducted using a medium with serum proteins that mimics in vivo conditions as far as possible. In this study, we systematically conducted pDNA transferring with and without 10% FBS. shows inverse fluorescent microscopy images of the pDNA transfection profiles of the PEI/pDNA and vesicle/pDNA polyplexes. By comparing the two columns with 10% FBS (left) and FBS free (right), we found that the transfection efficiency by PEI was significantly lower than that by vesicle. In addition, the medium containing FBS clearly suppressed the transfection efficiency of PEI. However, FBS had little effect on the transfection efficiency by vesicle. In contrast, both the 293T () and HepG2 () cell lines showed that the transferring efficiency by the vesicle/pDNA polyplex was higher than that by PEI/pDNA polyplex. It should be pointed out that a Millipore membrane with pore size of 450 nm was used for sterilization. The transfection efficiency of the PEI/pDNA polyplex before such filtration was much higher than after the filtration (Figure S3). The efficiency at prior to filtration was similar to that in other reports.Citation42,Citation43 This suggested that much of the pDNA or some of the PEI/pDNA polyplex was removed in the sterile process. The reason for this is discussed in the section of “mechanism of self assembly, transfection and stability.” The higher transferring efficiency of the vesicle-based polyplex was also observed in CLSM (Figure S4). To the best of our knowledge, our study is the first report on this point. The proteins in the culture medium strongly affected the transfection efficiency. This was attributed to the charged surface of the polyplex leading to some inter-polyplex aggregation. However, the difference between 10% FBS and FBS free was not as obvious for the vesicle/pDNA polyplex. This was attributed to the vesicles preventing the inner-loaded pDNA from leaking and aggregation by their hydrophilic bilayer.
Figure 4 Plasmid DNA transferring comparison between polyethylenimine PBMA75- b-PNAM51 block copolymer vesicle for 293T (A) and HepG2 (B). Transference was indicated by inverse fluorescent microscopy either with or without fetal bovine serum (FBS).
Abbreviation: PBMA75-b-PNAM51, poly(n-butyl methacrylate)x-b-poly(N-acryloylmorpholine)y, with hydrophobic to hydrophilic block ratio regulated at 73/51.
Evaluation of intracellular level transfection
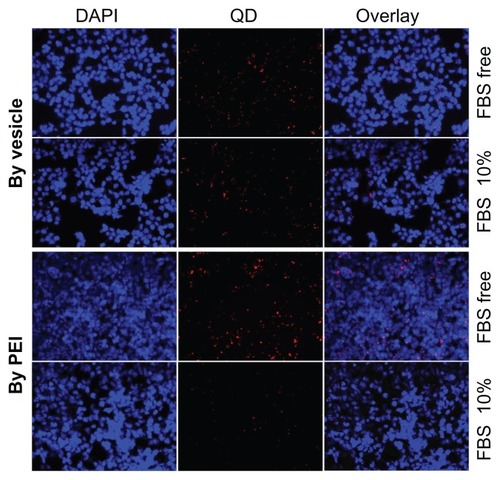
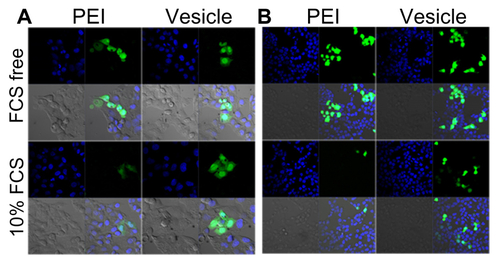
To further clarify the mechanism of the transferring efficiency promoted by vesicles, we used QD605 (a hydrophilic dot of 5 nm) as a probe to investigate the interaction mechanism between the polyplexes and the cells. The QD was used as a probe due to it having no protein expression at an intracellular level, which may eliminate the factors generated from intracellular gene reporting, including intracellular release and protein synthesis. The QDs were loaded into the vesicles by the same method used for pDNA condensing. The intracellular internalization of PEI/QD and vesicle/QD by 293T cells incubated in medium with and without FBS was quantitatively evaluated by inverse fluorescent microscopy (). The blue color was from DAPI staining and the red color was from the QDs. Similar to the transfection profile of pDNA as shown in , in FBS-free culture medium, too many QDs were transferred into the cells. However, in the 10% FBS-containing medium, the transfection efficiency by PEI was much lower than that by vesicles. Moreover, the fluorescent intensity decrease from FBS free to 10% FBS by the PEI-based polyplex was much higher than that by vesicle/QD. This was also attributed to significant inter-polyplex aggregation. This further told us that the proteins in the culture medium lowered the polyplex transferring efficiency. The fluorescent images of QDs and pDNA, which had similar varying trends, further proved that pDNA can be successfully transferred by vesicle.
Figure 5 Quantum dot (QD) transferring efficiency comparison between polyethylenimine (PEI) and the vesicle for 293T cells either with or without fetal bovine serum (FBS).
Notes: The nuclei were stained with 4′,6-diamidino-2-phenylindole (DAPI), giving a blue color. The red color was generated by the QDs.
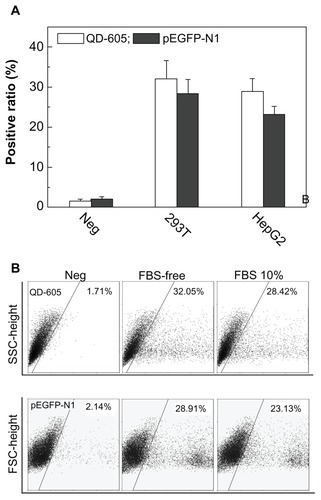
Even if nano carriers successfully transferred the pDNA to the cytoplasm, intracellular release remains a key step for gene reporting. shows quantification analysis of vesicle/pDNA and vesicle/QD polyplexes based on 293T and HepG2 cells. As previously mentioned, inter-polyplex interaction was eliminated in FBS-free conditions. The positive ratio for 293T was a little higher than that of HepG2, which was due to the properties of the cell line. The positive ratio of QDs was higher than that of pEGFP-N1 for 293T and HepG2. We further used the 293T cell line to investigate this transferring difference in FBS free and 10% FBS medium, which is shown in . The positive ratio of QDs (indicated by PL-2) was higher than that of pDNA (indicated by PL-1). Note that the complexation of the vesicles with QDs or pDNA was conducted at the same concentrations. Moreover, the potential of the vesicle/QD polyplex was about 4 mV, which was similar to that of the vesicle/pDNA polyplex (0–3 mV). As mentioned, the vesicle/pDNA and vesicle/QD polyplexes were prepared using the same process. They had the similar surface potential and the transferring was conducted under the same conditions. The QDs used in this study were non-charged particles of small size (~5 nm). They could be directly visualized in fluorescent microscopy after intracellular uptake. Thus, the positive ratio difference between QDs and pDNA directly reflected the intracellular release and reporting profile of pDNA. Consequently, at a similar transferring efficiency, the positive ratio of pDNA was lower that that of the QDs, indicating that some cells had not expressed the green fluorescent protein. This was mainly attributed to some pDNA not being released from the endosomes, but may also be attributed to some pDNA being released but not reported in the fluorescent proteins.
Figure 6 (A) The positive ratio of quantum dot (QD)-605 and pEGFP-N1 transferred by vesicle for 293T and HepG2 cells using the same method and at the same concentration in the medium either with or without fetal bovine serum (FBS). (B) Scattergraphs for QD-605 and plasmid DNA transferred by vesicle for 293T cells either with or without FBS.
Abbreviations: FSC, forward scatter; SSC, side scatter.
Mechanisms of self-assembly, transfection and stability
As already discussed, well-defined nano vesicles offer new hope for overcoming the drawbacks of traditional polycations like PEI.Citation44,Citation45 Further, however, it is necessary to disclose the inherent transfection mechanism for further promoting their practicable use. The driving force for the self-assembly of amphiphilic block copolymers in aqueous media is their strictly different solubility, as described by the Flory–Huggins parameter (χpolymer-solvent) as:Citation46
where δpolymer and δsolvent are the solubility parameter of the polymer and the solvent, respectively, Vsolvent is the molar volume of the solvent, KB is the Boltzmann constant, T is the absolute temperature and 0.34 is the entropic contribution. The Hildebrand–Scatchard solubility parameter () was used to describe the mechanism of solubility of solute, where ΔEVAP is the energy of vaporization and V is the molar volume of the solvent. The thermodynamic condition is χhydrophobic block > 0.5, while χhydrophilic block < 0.5.Citation47–Citation49 Water is a selective solvent for the PBMA-PNAM copolymer, which gave rise to a distinguished solubility difference – that is, χPBMA > 0.5 while χPNAM < 0.5 as shown in . In contrast, the block length strongly affects the morphology of the final aggregate. The difference in block solubility resulted in the different molecular geometry, as described by the packing parameter:
Figure 7 The scheme illustrated complexation between carrier (polyethylenimine [PEI] and vesicles) and plasmid DNA (pDNA). (A) shows the hydrodynamic and kinetic conditions for well-defined vesicle formation, pDNA condensing, and the properties of the corresponding stealth polyplex; (B) shows the polyplex formation by cationic PEI with pDNA and the corresponding size and surface properties of the polyplex.
Note: The dimensions of the drawn polyplex do not reflect its real size.
![Figure 7 The scheme illustrated complexation between carrier (polyethylenimine [PEI] and vesicles) and plasmid DNA (pDNA). (A) shows the hydrodynamic and kinetic conditions for well-defined vesicle formation, pDNA condensing, and the properties of the corresponding stealth polyplex; (B) shows the polyplex formation by cationic PEI with pDNA and the corresponding size and surface properties of the polyplex.Note: The dimensions of the drawn polyplex do not reflect its real size.](/cms/asset/a7d165b6-418e-4ddc-b775-b4eb29ed9f0e/dijn_a_34675_f0007_c.jpg)
where VH, LC, and A0 are the volume occupied by the hydrophobic chain, the hydrophobic chain counter length, and the surface area of hydrophilic chain, respectively.Citation50 Normally, the morphology of the polymeric aggregates changes as the β value changes; for example, for a spherical micelle (0 < β < 1/3), rod-like micelle (1/3 < β < 1/2), vesicle (1/2 < β < 1), and, finally, a planar bilayer (β > 1).
The condition required for hollow spherical vesicle formation is a packing parameter, β, in the range of 0.5–1.0. As shown in , the β of the series of PBMAx-b-PNAMy was calculated and indicated that the vesicles would be form as PBMA/PNAM > 1,Citation23,Citation51 which is why the hydrophobic/hydrophilic length ratio was finely regulated to 73/51 by RAFT radical polymerization. The resulting block-length ratio was 0.5 < β < 1. The morphology of the well-defined vesicles was confirmed by TEM, as shown in . The conditions for and process of vesicle/pDNA polyplex formation is shown in . Most of the pDNA was condensed into the vesicles bearing small amount of DOTAP. This uniform bilayer structure further enhanced the gene-loading capacity and membrane penetration.Citation52 This stealth layer (ie, the surrounding PNAM chains) can enhance the stability of the inner pDNA complex by significantly suppressing the interaction between the polyplex and proteins. Moreover, the size and structure of this type of polyplex was relatively uniform. In contrast, the naked PEI-based polyplex was fabricated by mixing with pDNA, as shown in .Citation42 The positive charge on PEI and negative charge on pDNA were the driving force for their complexation. At a low N/P, the pDNA can not be completely condensed into a stable polyplex by PEI. The primary instable polyplex aggregated each other. However, a large amount of positive charge would appear if the N/P were increased too much. This would also lead to an instable polyplex, which would result in strong serum portion absorption.
The size and size distribution of the pDNA, vesicle, PEI/pDNA, and vesicle/pDNA polyplexes is shown in . It was found that just a single peak appeared for the pDNA and vesicles indicating their uniform size distribution. For the polyplex formed by vesicles, there was still a single peak corresponding to a slightly larger size (~150 nm) than that of the pDNA and hollow vesicles (~100 nm). This single peak indicated that the pDNA was successfully stabilized in the inner core of the vesicles. The small increase in polyplex size was attributed to the swelling effects generated by the inner complex. However, the PEI/pDNA polyplex showed larger and multi-distributed sizes (~600 nm and 4000 nm, respectively). This larger size and broader distribution indicated inter-polyplex aggregation due to positive–negative charge interaction. Such large size did not pass through the membrane with pores of 450 nm. In addition, the surface potential of the PEI/pDNA polyplex randomly fluctuated in the range of −30 to 15 mV or even more, depending on the N/P value. Either too much low or high potential is undesirable for the cell cytotoxicity. The neutralization process between PEI and pDNA was difficult to control. This undesirable aspect of PEI was successfully eliminated by the vesicles with a surface potential of about 0–3 mV. This is also why the transfection efficiency of the PEI/pDNA polyplex was extremely low. Both the stable uniform size and the weakly charged surface of the vesicles contributed to their high transfection efficiency, which was easily tailored by regulating the composition of the block copolymer.
Figure 8 (A) The size and size distribution of plasmid DNA (pDNA), vesicles, and corresponding polyplexes – polyethylenimine (PEI)/pDNA and vesicle/pDNA. (B) The serum stability profile of the vesicles and PEI was evaluated by bovine serum albumin (BSA) measured by dynamic light scattering. (C) The scheme illustrating the mechanism of the surface properties on the stability of the PEI/BSA and vesicle/BSA polyplexes in aqueous solution.
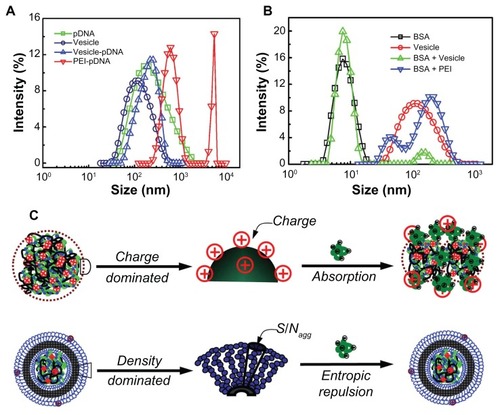
BSA was used to check the properties of the polyplexes in terms of their stability. In the DLS experiments, the size and size distribution of BSA (with a concentration about 25 mg/mL) and the vesicles (with a concentration about 0.5 mg/mL) were measured. Then the BSA was mixed with an equal volume of the vesicles (or PEI). The size of the PEI/BSA and vesicle/BSA polyplexes was further measured by DLS (diameter of PEI < 10 nm; not shown). shows the size and size distribution of the BSA, vesicle, vesicle/BSA, and PEI/BSA polyplexes. The single peak corresponds to the BSA (~8 nm – black squares) and vesicles (~110 nm – red circles), showing the relatively narrow size distribution. For the mixture of vesicle/BSA, there were two well-separated peaks. The small and large peaks (green triangles) corresponded to that of the BSA and vesicles, respectively. In contrast, for PEI/BSA, just one very large and broadly distributed curve coupled from two peaks (~ 50 nm and 200 nm – blue triangles). Note that in the DLS experiment the light scattering intensity (I) is related to the molecular weight (M) and concentration (C) of the scattering objective (D) by the relation I ~ MC. Here, the M directly reflects the size of the scattering objective in solutions.Citation53 In our experiments, the concentration for both cases was the same, so the light intensity, I, just reflects the size of the scattering objective – that is, the size peaks in the DLS testing indicated the molecular weight variation of the polyplexes. The two well-separated peaks of the BSA/vesicle mixture indicate no interaction between the BSA and vesicles. However, the similar size of the BSA and PEI peaks was attributed to the electronic absorption resulting in big aggregates.Citation31,Citation33 This result showed that the serum stability of the vesicle/pDNA polyplex was much higher than that of the PEI/pDNA polyplex, which correlates with the result of the mentioned in vitro gene transference.
Generally, for particles with a surface charge, the force for their stability in aqueous solution comes from electronic repulsion. If two objectives carry opposite charges, absorption will automatically appear, resulting in larger size aggregates. PEI and BSA hold oppositely charged surfaces and their blending at a high N/P showed surface potential of about ~15 mV. Such a highly positive charge led to the large aggregates in their mixture solution, as illustrated in (top). However, for the non-charged particles, including the self-assembled vesicles, stability is attributed to the surface hydrophilic chains. In our previous study, it was found that the determining factor is the corona-forming chain density (ρcorona), which is defined as the ratio of micellar surface area (Scorona) to the aggregation number (Nagg); that is, ρcorona = Scorona/Nagg. The higher ρcorona led to a lower gap between neighboring hydrophilic shell chains.Citation33 Thus, as the mobility of the chains was not permitted, entropic loss resulted. This entropic loss increased the excluded volume of the vesicles, which suppressed the in vitro/vivo protein absorption, as shown in (bottom).
Vesicles further promoted solid tumor accumulation
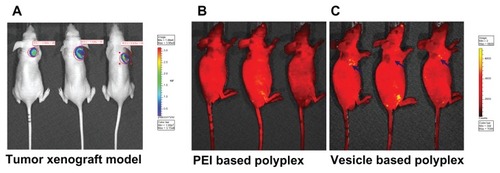
Accumulation at the solid tumor was further investigated by these stealth vesicles. Firstly, the BALB/c nude mouse xenografted tumor model was set up. The successfully established solid-tumor xenograft model was confirmed by the IVIS imaging system shown in . The in vivo tumor accumulation profile was indicated by FITC, which was delivered by the PEI- and vesicle-based polyplexes – the fluorescent images are shown in , respectively. As indicated by the blue arrow, it was found that intra-tumor accumulation of FITC delivered by the vesicles was much higher than that by PEI. This indicates that the intra-tumor accumulation of vesicles was much higher than that of PEI with the same circulation time allowed. This promoted intra-tumor accumulation of vesicles was attributed to their stealth polyplex properties – that is, EPR. The densely packed non-charged hydrophilic bilayer successfully suppressed its menas vesicle’s interaction with the proteins when circulating in blood. Additionally, the EPR effect was also enhanced by the vesicle’s uniform size and size distribution in the range of 100–200 nm. In contrast, the naked PEI-based polyplex’s charged surface interacted with serum proteins resulting in some large aggregations with broad size distribution. Both the surface charge and the large size lowered the circulation time of the polyplex and decreased the EPR effect. The in vivo tumor accumulation profile further proved the stability mechanism, as shown in . Taken together, the results indicate that the in vitro/vivo stability, transferring efficiency, and intra-tumor accumulation can be efficiently enhanced by finely tailored non-cytotoxic well-defined vesicles.
Figure 9 Successfully established tumor xenograft model (A). The passive targeted in vivo tumor accumulation of fluorescein isothiocyanate delivered by polyethylenimine (PEI)- and vesicle-based polyplexes (B and C, respectively) under the same conditions.
Note: All the images were observed by the IVIS® Lumina II Imaging System (Caliper Life Sciences, Hopkinton, MA).
Abbreviation: ROI, region of interest.
Conclusion
Using conventional RAFT radical polymerization, we designed and synthesized an amphiphilic block copolymer, PBMA-b-PNAM block copolymer, with the hydrophobic/hydrophilic block-length ratio of 73/51 (PBMA73-b-PNAM51). The well-def ined polymer vesicles were successfully self-assembled in aqueous solution by tuning the polymer packing parameter 0.5 < β < 1, which was further confirmed by TEM. The low site-cytotoxic vesicle-based polyplex was prepared in situ for gene transfection, which was conducted by inverse fluorescent microscopy, flow cytometry, and CLSM using a tumor (HepG2) cell line and a non-tumor (293T) cell line. The vesicle-based polyplex showed very high pDNA condensing efficiency, enzyme-degradation protection, intracellular uptake and intracellular release. Additionally, the vesicle-based polyplex showed very high serum stability. The mechanism of the promoted transferring efficiency and serum stability of the vesicle was clearly disclosed. The high serum stability further promoted in vivo tumor accumulation, as evaluated by the BALB/c nude mouse xenografted tumor model. The finely tailored supramolecular vesicles significantly promoted gene transfection efficiency, serum stability, and intra-tumor accumulation, which showed their high potential for use in practical gene therapy.
Acknowledgments
The authors deeply thank Prof Teruo Okano and Prof Masamichi Nakayama for their kind help and advice. This work was financially supported by the National Natural Science Foundation of China, including by project NSFC-81171450; by the Shanghai Commission of Science and Technology; by the Ministry of Science and Technology of China (973 and 863 program projects); and a special program project for New Drug Creation and Infection Diseases.
Disclosure
The authors report no conflicts of interest in this work.
Supplementary figures
Figure S1 Gel permeation chromatography characterization of macromolecular reversible addition–fragmentation chain-transfer radical polymerization agent and the corresponding block copolymer poly(n-butyl methacrylate) [PBMA]-poly (N-acryloylmorpholine).
![Figure S1 Gel permeation chromatography characterization of macromolecular reversible addition–fragmentation chain-transfer radical polymerization agent and the corresponding block copolymer poly(n-butyl methacrylate) [PBMA]-poly (N-acryloylmorpholine).](/cms/asset/02194d06-ef5a-4971-8248-4c63ed12046d/dijn_a_34675_sf0001_c.jpg)
Figure S2 Transmission electron microscopy image of the vesicle/plasmid DNA (pDNA) polyplex.
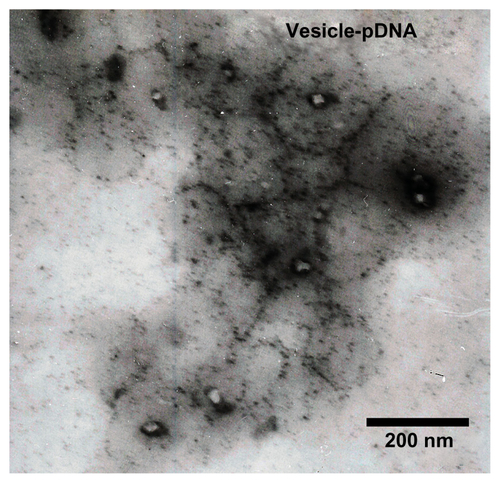
Figure S3 Plasmid DNA transferring comparison using polyethylenimine (PEI) for 293T (A) and HepG2 (B) cell lines, observed by inverse fluorescent microscopy either with (N/P = 10) or without filtration (N/P = 10 − F) in fetal bovine serum-free medium.
Abbreviation: N/P, nitrogen-from-PEI/phosphate-from-DNA ratio.
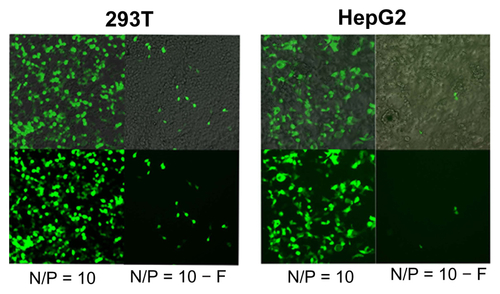
Figure S4 Plasmid DNA transferring comparison between polyethylenimine and PBMA75-b-PNAM51 block copolymer vesicle HepG2 (A) and 293T (B) cell lines, as indicated by confocal laser scanning microscopy either with or without fetal bovine serum.
Abbreviation: PBMA75-b-PNAM51, poly(n-butyl methacrylate)x-b-poly(N-acryloylmorpholine)y, with hydrophobic to hydrophilic block ratio regulated at 73/51.
References
- PutnamDPolymers for gene delivery across length scalesNat Mat20065439451
- FriedmannTHuman gene therapy – an immature genie, but certainly out of the bottleNat Med1996221441478574951
- PackDWHoffmanASPunSStaytonPSDesign and development of polymers for gene deliveryNat Rev Drug Discov20054758159316052241
- CrystalRGTransfer of genes to humans: early lessons and obstacles to successScience199527052354044107569994
- EscoffreJMPortetTFavardCTeissiéJDeanDSRolsMPElectromediated formation of DNA complexes with cell membranes and its consequences for gene deliveryBiochim Biophys Acta2011180861538154321035428
- CheckEA Tragic setbackNature2002420691211611812432357
- BoussifOLezoualc’hFZantaMAA versatile vector for gene and oligonucleotide transfer into cells in culture and in vivo: polyethylenimineProc Natl Acad Sci U S A19959216729773017638184
- ParkTGJeongJHKimSWCurrent status of polymeric gene delivery systemsAdv Drug Deliv Rev200658446748616781003
- GuoXHuangLRecent advances in nonviral vectors for gene deliveryAcc Chem Res201245797197921870813
- UnKKawakamiSSuzukiRMaruyamaKYamashitaFHashidaMDevelopment of an ultrasound-responsive and mannose-modified gene carrier for DNA vaccine therapyBiomaterials201031307813782620656348
- MännistöMVanderkerkenSTonchevaVStructure-activity relationships of poly(L-lysines): effects of pegylation and molecular shape on physicochemical and biological properties in gene deliveryJ Control Release200283116918212220848
- LeongKWMaoHQTruong-LeVLRoyKWalshSMAugustJTDNA-polycation nanospheres as non-viral gene delivery vehiclesJ Control Release1998531–31831939741926
- MoghimiSMSymondsPMurrayJCHunterACDebskaGSzewczykAA two-stage poly(ethylenimine)-mediated cytotoxicity: implications for gene transfer/therapyMol Ther200511699099515922971
- GermershausONeuMBeheMKisselTHER2 targeted polyplexes: the effect of polyplex composition and conjugation chemistry on in vitro and in vivo characteristicsBioconjug Chem200819124425318034452
- BreunigMLungwitzULieblRGoepferichABreaking up the correlation between efficacy and toxicity for nonviral gene deliveryProc Natl Acad Sci U S A200710436144541445917726101
- OgrisMBrunnerSSchüllerSKircheisRWagnerEPEGylated DNA/transferrin-PEI complexes: reduced interaction with blood components, extended circulation in blood and potential for systemic gene deliveryGene Ther19996459560510476219
- NeuMFischerDKisselTRecent advances in rational gene transfer vector design based on poly(ethylene imine) and its derivativesJ Gene Med200578992100915920783
- DengJWenYWangCEfficient intracellular gene delivery using the formulation composed of poly (L-glutamic acid) grafted polyethylenimine and histonePharm Res201128481282621161337
- CookSEParkIKKimEMGalactosylated polyethylenimine-graft- poly(vinyl pyrrolidone) as a hepatocyte-targeting gene carrierJ Control Release20051051–215116315878633
- MastrobattistaEvan der AaMAHenninkWECrommelinDJArtificial viruses: a nanotechnological approach to gene deliveryNat Rev Drug Discov20065211512116521330
- EdingerDWagnerEBioresponsive polymers for the delivery of therapeutic nucleic acidsWiley Interdiscip Rev Nanomed Nanobiotechnol201131334620533517
- WagnerEStrategies to improve DNA polyplexes for in vivo gene transfer: will “artificial viruses” be the answer?Pharm Res200421181414984252
- DischerDEEisenbergAPolymer vesiclesScience2002297558396797312169723
- LemieuxPVinogradovSVGebhartCLBlock and graft copolymers and nanogel copolymer networks for DNA delivery into cellJ Drug Target2000829110510852341
- ThomasMGeQLuJJChenJKlibanovAMCross-linked small polyethylenimines: while still nontoxic, deliver DNA efficiently to mammalian cells in vitro and in vivoPharm Res200522337338015835742
- ZhongZFeijenJLokMCLow molecular weight linear polyethylenimine-b-poly(ethylene glycol)-b-polyethylenimine triblock copolymers: synthesis, characterization, and in vitro gene transfer propertiesBiomacromolecules2005663440344816283777
- KwonGNaitoMYokoyamaMOkanoTSakuraiYKataokaKBlock copolymer micelles for drug delivery: loading and release of doxorubicinJ Control Release1997482–3195201
- NakayamaMOkanoTMiyazakiTKohoriFSakaiKYokoyamaMMolecular design of biodegradable polymeric micelles for temperature-responsive drug releaseJ Control Release20061151465616920217
- MoadGMayadunneRTRizzardoESkidmoreMThangSHSynthesis of novel architectures by radical polymerization with reversible addition fragmentation chain transfer (RAFT polymerization)Macromol Symp20031921112
- NagarajanRMolecular packing parameter and surfactant self-assembly: the neglected role of the surfactant tailLangmuir20021813138
- LiWLiJGaoJThe fine-tuning of thermosensitive and degradable polymer micelles for enhancing intracellular uptake and drug release in tumorsBiomaterials201132153832384421377724
- NakayamaMOkanoTUnique thermoresponsive polymeric micelle behavior via cooperative polymer corona phase transitionsMacromolecules2008413504507
- LiWNakayamaMOkanoTEffect of block compositions of amphiphilic block copolymers on the physicochemical properties of polymeric micellesPolymer2011521737833790
- AkimotoJNakayamaMSakaiKOkanoTThermally controlled intracellular uptake system of polymeric micelles possessing poly (n-isopropylacrylamide)-based outer coronasMol Pharm20107492693520459086
- LiWZhaoHQianWChemotherapy for gastric cancer by finely tailoring anti-Her2 anchored dual targeting immunomicellesBiomaterials201233215349536222542611
- BatesFSFredricksonGHBlock copolymers – designer soft materialsPhysics Today19995232
- GuoZZhangGQiuFZhangHYangYShiACDiscovering ordered phases of block copolymers: new results from a generic Fourier-space approachPhys Rev Lett2008101202830118764231
- ZetterlundPBKagawaYOkuboMControlled/living radical polymerization in dispersed systemsChem Rev200810893747379418729519
- NakayamaMOkanoTPolymer terminal group effects on properties of thermoresponsive polymeric micelles with controlled outer-shell chain lengthsBiomacromolecules2005642320232716004478
- ZhuJTangALawLPAmphiphilic core-shell nanoparticles with poly(ethylenimine) shells as potential gene delivery carriersBioconjug Chem200516113914615656585
- FuYKaoWJDrug release kinetics and transport mechanisms of non-degradable and degradable polymeric delivery systemsExpert Opin Drug Deliv20107442944420331353
- YueYJinFDengRRevisit complexation between DNA and polyethylenimine – Effect of uncomplexed chains free in the solution mixture on gene transfectionJ Control Release20111551677621056067
- YangZSahayGSriadibhatlaSKabanovAVAmphiphilic block copolymers enhance cellular uptake and nuclear entry of polyplex-delivered DNABioconjug Chem200819101987199418729495
- AkincAThomasMKlibanovAMLangerRExploring polyethylenimine-mediated DNA transfection and the proton sponge hypothesisJ Gene Med20057565766315543529
- UchegbuIFPharmaceutical nanotechnology: polymeric vesicles for drug and gene deliveryExpert Opin Drug Deliv20063562964016948558
- BatesFSFredricksonGHBlock copolymer thermodynamics: theory and experimentAnnu Rev Phys Chem19904152555720462355
- HadjichristidisNPispasSFloudasGDilute solutions of block copolymers in selective solventsBlock Copolymers: Synthetic Strategies, Physical Properties and ApplicationsNew York NYWiley2003203231
- HadjichristidisNPispasSFloudasGAdsorption of block copolymers at solid-liquid interfacesBlock Copolymers: Synthetic Strategies, Physical Properties and ApplicationsNew York NYWiley2003232254
- HadjichristidisNPispasSFloudasGTheoryBlock Copolymers: Synthetic Strategies, Physical Properties and ApplicationsNew York NYWiley2003257267
- HanLMiyasakaKTerasakiOCheSEvolution of packing parameters in the structural changes of silica mesoporous crystals: cage-type, 2D cylindrical, bicontinuous diamond and gyroid, and lamellarJ Am Chem Soc201113330115241153321696179
- MaLEisenbergARelationship between wall thickness and size in block copolymer vesiclesLangmuir20092524137301373619425564
- SonntagYMusgaardMOlesenCMutual adaptation of a membrane protein and its lipid bilayer during conformational changesNat Commun2011230421556058
- TeraokaIDynamics of dilute polymer solutionsPolymer Solution: An Introduction to Physical PropertiesNew York, NYWiley2002167276