 ?Mathematical formulae have been encoded as MathML and are displayed in this HTML version using MathJax in order to improve their display. Uncheck the box to turn MathJax off. This feature requires Javascript. Click on a formula to zoom.
Abstract
Background and methods
Chondroitin sulfate-chitosan (ChS-CS) nanoparticles and positively and negatively charged fluorescein isothiocyanate-conjugated bovine serum albumin (FITC-BSA)-loaded ChS-CS nanoparticles were prepared and characterized. The properties of ChS-CS nanoparticles, including cellular uptake, cytotoxicity, and transepithelial transport, as well as findings on field emission-scanning electron microscopy, transmission electron microscopy, and confocal laser scanning microscopy were evaluated in human epithelial colorectal adenocarcinoma (Caco-2) fibroblasts. ChS-CS nanoparticles with a mean particle size of 250 nm and zeta potentials ranging from −30 to +18 mV were prepared using an ionic gelation method.
Results
Standard cell viability assays demonstrated that cells incubated with ChS-CS and FITC-BSA-loaded ChS-CS nanoparticles remained more than 95% viable at particle concentrations up to 0.1 mg/mL. Endocytosis of nanoparticles was confirmed by confocal laser scanning microscopy and measured by flow cytometry. Ex vivo transepithelial transport studies using Caco-2 cells indicated that the nanoparticles were effectively transported into Caco-2 cells via endocytosis. The uptake of positively charged FITC-BSA-loaded ChS-CS nanoparticles across the epithelial membrane was more efficient than that of the negatively charged nanoparticles.
Conclusion
The ChS-CS nanoparticles fabricated in this study were effectively endocytosed by Caco-2 fibroblasts without significant cytotoxicity at high nanoparticle concentrations. ChS-CS nanoparticles represent a potential novel delivery system for the transport of hydrophilic macromolecules.
Introduction
Recently, delivery systems for macromolecules (such as proteins, peptides, or genes) have been widely investigated to improve oral bioavailability,Citation1 sustain drug/gene effects in target tissues,Citation2 solubilize drugs for intravascular delivery, and improve the stability of therapeutic agents against enzymatic degradation by nucleases and proteases.Citation3,Citation4 Nanoparticles with a suitable nanosize may potentially penetrate into tissues by passing through fenestrations present in the epithelial lining of blood vessels and being taken up by cells in these tissues.Citation5–Citation7 This pathway involves the enhanced permeability and retention effect which allows the efficient delivery of therapeutic agents to specific target sites in the body. In addition, by modulating polymer characteristics, drug release from nanoparticles is controllable to achieve a desired therapeutic level at target sites and to optimize the beneficial effect for the required duration.Citation8–Citation12 While nanoparticles are in contact with cells, the attachment, adhesion, and spread related to the first phase of the nanoparticle-cell interaction influences cell proliferation and differentiation, which are critical factors in the development of nanoparticles.Citation2,Citation13,Citation14
Chitosan has been widely investigated as a drug carrier because of its special feature of adhering to the mucosal surface and transiently opening the tight junctions between epithelial cells.Citation15 Chitosan is produced by deacetylation of chitin, a naturally occurring and abundant polysaccharide. Chitosan is composed of 2-amino-2-deoxy-β-d -glucan subunits connected by glycosidic linkages. The primary amino groups confer special properties that make chitosan very useful in pharmaceutical applications. The hydrophilic chitosan nanoparticles usually have a longer retention time in the bloodstream. These systems could be applied to control the rate of drug release and extend the duration of action of a therapeutic agent.Citation16 More recent reports also indicate that chitosan nanoparticles can be taken up whole by human cells, resulting in significantly enhanced bioavailability of the bioactive molecules being transported. In our previous study, chondroitin sulfate-chitosan (ChS-CS) nanoparticles were successfully prepared using an ionic gelation method.Citation8 These nanoparticles have a narrow size distribution, potentially allowing them to be novel carriers for hydrophilic macromolecules. Furthermore, we have investigated the effects of the experimental conditions on the formation of ChS-CS nanoparticles using fluorescein isothiocyanate-conjugated bovine serum albumin (FITC-BSA) as a model protein drug. The particle size and zeta potential of these nanoparticles are greatly affected by the ratio of chondroitin sulfate to chitosan and their concentrations. Moreover, the preparation method achieved a very high encapsulation efficiency for loading FITC-BSA into the ChS-CS nanoparticles (>90%). The prepared FITC-BSA ChS-CS nanoparticles exhibited a small burst release followed by continuous controlled release for up to 4 days,Citation8 indicating that these nanoparticles would be highly suitable as carriers for protein-based drugs.
The aims of the present study were to prepare FITC-BSA- loaded ChS-CS nanoparticles with either positive or negative charges and evaluate their cytocompatibility and mechanisms of cellular uptake. In addition, Caco-2 cells were used to develop a theoretical basis for clarifying the effects of charge and size on the oral absorption of FITC-BSA-loaded ChS-CS nanoparticles and to characterize both their uptake and transepithelial transport across Caco-2 cells.
Materials and methods
Materials
Chitosan (molecular weight 64,000–67,000, viscosity 5 cps (5 g/L), degree of deacetylation 80.0%), was purchased from Wako Pure Chemical Industries Ltd (Osaka, Japan). Chondroitin 4-sulfate sodium salt from bovine trachea was provided by Fluka (Buchs, Switzerland). FITC-BSA was obtained from Sigma (St Louis, MO). Dulbecco’s Modified Eagle Medium, antibiotic solution (100 IU/mL penicillin and 100 μg/mL streptomycin), fetal bovine serum, and phosphate-buffered saline (pH 7.4) were supplied by Gibco BRL (Corning, NY). Glacial acetic acid was purchased from Merck (Darmstadt, Germany). Ultrapure water was obtained using Milli-Q equipment (Waters, Milford, MA).
Preparation of chitosan-based nanoparticles
Chitosan nanoparticles were prepared as described in our previous report with modifications.Citation8 Chitosan nanoparticles were prepared using ionotropic gelation of chitosan cations with chondroitin 4-sulfate anions. Chitosan was dissolved in 2% (w/v) aqueous acetic acid solution, adjusted to pH 6 with 2 N NaOH or HCl, and then diluted with Milli-Q water to the desired concentration (4 mg/mL in 1% (w/v) acetic acid). Chondroitin 4-sulfate was dissolved in Milli-Q water at a concentration of 4 mg/mL.
The FITC-BSA-loaded ChS-CS nanoparticles were prepared by adding the FITC-BSA solution to the chondroitin 4-sulfate solution and mixing the solutions well by magnetic stirring at room temperature. The nanoparticles were then obtained using identical concentrations of chitosan and chondroitin 4-sulfate solutions (4 mg/mL) at various ChS/CS volume ratios (2/4, 2.8/4, 4/4, 4/2.8, 4/2, 4/1.4 and 4/1) under magnetic stirring at room temperature. Agitation was maintained for 5 minutes. The final FITC-BSA-loaded nanoparticle suspensions were filtered through 0.45 μm membranes (Millipore, Boston, MA) twice. Using a deep freeze, the suspensions were prefrozen for 6 hours, reaching a terminal temperature of −80°C, and then dried at −86°C at 0.1 mbar for 48 hours in a vacuum freeze-drying system. The freeze-dried FITC-BSA-loaded nanoparticles were evaluated in terms of vesicle size and zeta potential.
Characterization of ChS-CS nanoparticles
The particle size of the nanoparticles was characterized by photon correlation spectroscopy (Zetasizer Nano-ZS, Malvern Instruments, Worcestershire, UK). All measurements were performed using a wavelength of 633 nm at room temperature with an angle detection of 173 degrees. Raw data were subsequently correlated to the mean hydrodynamic size by cumulant analysis (Z average mean). The zeta potentials of all the nanoparticles were analyzed by laser Doppler anemometry (Zetasizer Nano-ZS). All samples were run in pH 6.0 solution in triplicate, with calculation of the means and standard deviations.
Morphologic analysis of nanoparticles by FE-SEM and TEM
The nanoparticles were examined using field emission scanning electron microscopy (FE-SEM, JEOL JSM-1200EXII, Tokyo, Japan). Samples were mounted on a carbon adhesive tab and sputter-coated (10–15 nm) with platinum. For transmission electron microscopy (TEM), the nanoparticle solution (10 μL) was placed on a Formvar/carbon film-coated copper grid (Ted Pella, Redding, CA). After removing the excess sample with filter paper, the sample was air-dried for 10 minutes at room temperature. The nanoparticle vesicles were then visualized by negative staining using 1.0% uranyl acetate for one minute at room temperature and imaged by TEM (JEOL JSM-6390 LV, Tokyo, Japan). Images were taken at ×50,000 magnification.
Cell culture
The established human Caco-2 intestinal epithelial cell line was obtained from the American Type Culture Collection (Rockville, MD). Caco-2 cells from passage 30–50 were used in the experiments. Freshly isolated cells were cultured as previously described,Citation8 and cells at passage 2–4 were used. Caco-2 cells were routinely grown in cultured Dulbecco’s Modified Eagle Medium supplemented with 100 IU/mL penicillin, 100 mg/mL streptomycin, 1% nonessential amino acid, and 10% fetal bovine serum in 5% CO2 at 37°C. The cells were seeded on flat-bottomed 96-well tissue culture plates (Greiner Labortechnik, Frickenhausen, Germany) for cell toxicity assays, on 6-well tissue culture plates (Nalge Nunc, Elkhart, IN) for flow cytometry (Becton Dickinson, FACScan flow cytometer, Heidelberg, Germany) and confocal microscopy (Carl Zeiss, Göttingen, Germany),Citation17,Citation18 or on 6-Transwell tissue culture plates (Corning) for cell transmembrane assays.
In vitro cell viability and cytotoxicity studies
The cytotoxic effect of ChS-CS nanoparticles was evaluated using a commercial colorimetric WST-1 cell proliferation assay (Biochain, CA) as previously described.Citation8 The WST-1 assay is a simple, nonradioactive colorimetric assay for measuring cell cytotoxicity, proliferation, and viability. Aqueous nanoparticle suspensions at final concentrations of 0.0001, 0.001, 0.01, and 0.1 mg/mL were obtained by dispersing the dry particles in water with the aid of an ultrasonicator (40 kHz, 25°C). Cells (5.0 × 10³ cells/mL) were seeded on 96-well tissue culture plates in 100 μL of culture medium, allowed to adhere for 5 hours, and serum-starved in Dulbecco’s Modified Eagle Medium containing 0.1% bovine serum albumin for 24 hours prior to use. Five microliters of samples at various concentrations were added to each well, and the cells were incubated for 72 hours at 37°C. Caco-2 cells were treated with the samples described previously, and 5 μL of WST-1 (5 μg/mL) were added to each well for one hour at 37°C before terminating the incubation. Cells were washed and incubated with 100 μL of various diluted nanoparticles in 0.1% bovine serum albumin and Dulbecco’s Modified Eagle Medium solution for various times at 37°C. The ultimate concentration of nanoparticle suspension was 1/20. Absorbance was measured at 450 nm using a spectrophotometer. Cell viability was calculated using the following formula:
The viability of untreated cells was normalized to 100%. Six experimental sets were performed, and each set was performed in triplicate.
Cellular internalization of nanoparticles
Characterization by CLSM
To visualize the behavior of FITC-BSA-loaded ChS-CS nanoparticles in Caco-2 cells, confocal laser scanning microscopy (CLSM, Leica TCS SP5, Tokyo, Japan) was performed as previously described.Citation8 Cells were seeded from cover glasses (24 mm) onto 6-Transwell tissue culture plates for confocal microscopy. After incubation medium was removed, the cell monolayers were washed three times with 50 mM phosphate-buffered saline (pH 7.4). Suspensions of formulations (1.2 mL) containing FITC-BSA-loaded ChS-CS nanoparticles (0.01 mg/mL) were added to each well, and the plates were incubated again for one, 2, 4, and 6 hours. The cells were then fixed with 3.7% formaldehyde for 10 minutes and washed with 1 mL of phosphate-buffered saline three times. For immunofluorescence microscopy,Citation18 the nuclei of stained cell monolayers were further stained using TO-PRO-3 iodide, which was then replaced with BODIPY-phalloidin for 15 minutes to stain the membranes. CLSM was performed to obtain optical images of the distribution of FITC-BSA in Caco-2 cells. Images obtained from the bottom of the cover-slip to the top of the cells were recorded by CLSM.
Quantification by flow cytometry
Caco-2 cells were seeded in 6-well plates using Dulbecco’s Modified Eagle Medium at a cell density of 3 × 10⁵ cells per well and incubated for 24 hours to achieve 75% confluence. Before the uptake study, the culture medium was removed, and the cells were washed with phosphate-buffered saline. FITC-BSA solution and FITC-BSA-loaded ChS-CS nanoparticles (size 250 nm, zeta potential −30 and +16 mV) in 0.1 mL (0.1 mg/mL) of serum-free culture medium (pH 7.0) were then added. At various times, the cells were washed with phosphate-buffered saline three times, detached using 0.05% trypsin-0.02% ethylenediamine tetra-acetic acid, washed with phosphate-buffered saline, and resuspended in 1 mL of phosphate-buffered saline for flow cytometric analysis.
Fluorescence-activated cell sorting (FACS) quantification of BSA-FITC-loaded ChS-CS nanoparticle uptake by Caco-2 cells was performed using a flow cytometer (FACScan flow cytometer, Becton Dickinson, Heidelberg, Germany) as described previously.Citation17 The mean fluorescence channel and mean number of positive cells were derived using CellQuest software. To determine the levels of FITC-BSA, Caco-2 cells were analyzed with excitation at 488 nm and a 530 nm band-pass filter in the emission path. Forward and side light scatter was used to gate the desired scattered events of normal cells from dead cells and cell debris. The mean fluorescence channels and mean number of normal cells and dead cells representing internalization efficiency were derived using CellQuest software. For all FACS analyses, each experiment was performed in triplicate.
Nanoparticle transport studies
Caco-2 cells were seeded at a density of 1 × 10⁵ cells/cm2 onto a permeable polycarbonate insert (1.0 cm2, 0.4 μm pore size, Coster 3450, Corning) in 12-well tissue culture plates (Corning). On day 21, the Caco-2 cell monolayers were used for the transepithelial transport experiments. The integrity of the monolayers grown on the permeable membrane was assessed using the transepithelial electrical resistance of the monolayers through a Millicell-ERS apparatus (Millipore) and Phenol red transport. Caco-2 monolayers could only be used in the experiments when transepithelial electrical resistance values reached 700 Ω cm2 and Phenol red permeability was 0.5% per hour. The culture medium on both sides was removed by aspiration, and the Caco-2 cell monolayers were washed twice with the incubation medium. After washing, the monolayers were preincubated for 15 minutes at 37°C with 0.5 mL and 1.5 mL of the incubation medium on the apical and basolateral sides, respectively. After preincubation, the medium was removed immediately, and the incubation medium containing FITC-BSA solution or FITC-BSA-loaded nanoparticles (positively and negatively charged) was added to the apical side (0.5 mL). The unmodified incubation medium was then added to the opposite side (basolateral 1.5 mL, apical 0.5 mL). Next, 50 μL samples were taken from the receiver basolateral compartment at intervals of 10, 20, 30, 40, 50, 60, 90, 120, 150, 240, 300, and 360 minutes and replaced with fresh buffer. The cellular uptake of nanoparticles was evaluated using CLSM, and nanoparticle concentrations in the transepithelial transport samples were determined by measuring fluorescent intensity with a spectrophotometer (Fluorsklan Axcent FL, Thermo, Waltham, MA) as described in a previous report.Citation19 The excitation and emission wavelengths were 485 and 538 nm, respectively. The percentage cumulative release was calculated using the formula:
Statistical analysis
All data were reported as the mean ± standard deviation for at least three independent samples. Data were analyzed by the Student’s t-test using SPSS software (version 16.0, SPSS, Chicago, IL). The criteria for statistical significance were *P < 0.05 and **P < 0.01.
Results and discussion
Conditions for formation of nanoparticles
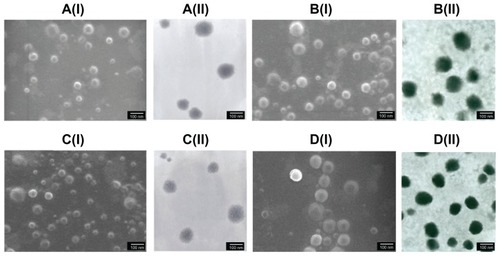
The influence of the weight ratio and final concentration on the size and zeta potential of ChS-CS nanoparticles is shown in . Nanoparticles were obtained using the same concentrations of chitosan and chondroitin 4-sulfate solution (4 mg/mL) at various ChS/CS volume ratios (2/4, 2.8/4, 4/4, 4/2.8, 4/2, 4/1.4, and 4/1). The size of the ChS-CS particles decreased as the ChS/CS ratio increased to a ratio of 2.8/4, dramatically increased (from nanoscale to microscale) at ratios between 4/4 and 4/1.4, and then significantly decreased (from microscale to nanoscale) at a ratio of 4/1. The zeta potential continuously decreased in a linear correlation as the ChS/CS volume ratio increased, as zeta potentials of 18, 16, 1, −10, −21, −25, and −30 mV were recorded at ChS/CS volume ratios of 2/4, 2.8/4, 4/4, 4/2.8, 4/2, 4/1.4, and 4/1, respectively. These phenomena might have occurred because chondroitin 4-sulfate has a surface negative charge, and thus increasing the amount of chondroitin 4-sulfate decreased the zeta potential of the nanoparticles. Chitosan is a cationic polyelectrolyte, and our study was based on inducing its gelation by controlling its interaction with the counter ion of chondroitin 4-sulfate. In addition, it is known that the intermolecular linkages created between the negatively charged sulfate and carboxylate groups of chondroitin 4-sulfate and the positively charged amino groups of chitosan are responsible for the success of the gelation process. The particles prepared showed a narrow size distribution, with a mean diameter of 250.0 ± 5.84 nm and a polydispersity index of 0.145 ± 0.005 at ChS/CS volume ratios of 2.8/4 and 4/1 (). According to FE-SEM and TEM photographs (×50,000), the positively and negatively charged ChS-CS nanoparticles and FITC-BSA-loaded ChS-CS nanoparticles displayed a narrow size distribution (). FE-SEM images for the FITC-BSA-loaded ChS-CS nanoparticles () revealed a smooth surface with a compact core. TEM images for the ChS-CS nanoparticles revealed a dense, well defined, spherical structure, which was consistent with the particle size as measured by photon correlation spectroscopy. Our previous studyCitation8 revealed a similar result in that the particle size showed a linear relationship with the amount of chondroitin 4-sulfate, as the particle size decreased by approximately 21.2, 33.6, and 77.5 nm at ChS/CS ratios of 1/1, 2/3, and 1/3, respectively. Accordingly, it could be estimated that the minimum diameter of the nanoparticles was approximately 213, 186, and 178 nm at ChS/CS ratios of 1/3, 2/3, and 1/1, respectively. Similar to our previous findings, the entrapment efficiency of the FITC-BSA-loaded nanoparticles was approximately 90%, and the amount of FITC-BSA released from the nanoparticles was approximately 80% in 6 hours, with only 25% of the drug released in the first hour.Citation8
Figure 1 Influence of log(MChS/MCS) on the particle size and the zeta potential of FITC-BSA-loaded ChS-CS nanoparticles. (◆) Particle size, (■) zeta potential (A), particle size distribution of the formulation with a ChS/CS volume ratio of 2.8/4 (B) and 4/1 (C). Initial concentrations were ChS (4 mg/mL) and CS (4 mg/mL).
Abbreviations: BSA, bovine serum albumin; ChS, chondroitin 4-sulfate sodium salt; CS, chitosan; FITC, fluorescein isothiocyanate.
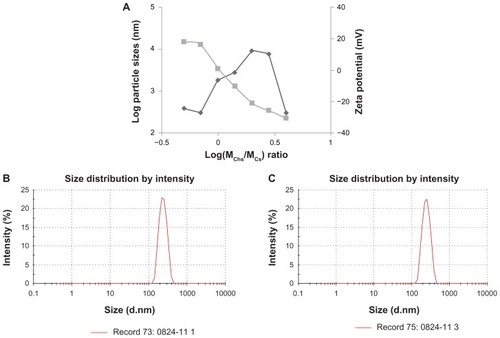
Figure 2 Images of FE-SEM (I) and TEM (II) micrographs of ChS-CS nanoparticles and FITC-BSA-loaded ChS-CS nanoparticles. (A) Blank ChS-CS nanoparticles (+). (B) FITC-BSA-loaded ChS-CS nanoparticles (+). (C) Blank ChS-CS nanoparticles (−). (D) FITC-BSA-loaded ChS-CS nanoparticles (−).
Note: Bar 100 nm.
Abbreviations: BSA, bovine serum albumin; ChS, chondroitin 4-sulfate sodium salt; CS, chitosan; FITC, fluorescein isothiocyanate; FE-SEM, field emission scanning electron microscopy; TEM, transmission electron microscopy.
In vitro cell viability and cytotoxicity studies
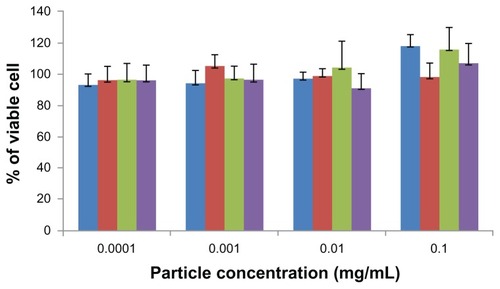
For years, the interaction of nanoparticles with a variety of cell systems has been investigated to explore the cell uptake mechanisms, intracellular distribution, and down-stream effects of nanoparticles, such as toxicity and cell cycle regulation.Citation9,Citation12 The WST assay has been widely used to assess the cytotoxicity of nanoparticles.Citation8 The cytotoxicity of ChS-CS and FITC-BSA-loaded ChS-CS nanoparticles was determined in Caco-2 cells by the WST-1 assay after culturing for 72 hours (). The nanoparticles showed no significant aggregation. The percentage of viable Caco-2 cells exceeded 95% when the cells were treated with positively and negatively charged ChS-CS nanoparticles and FITC-BSA-loaded ChS-CS nanoparticles at concentrations of 0.0001, 0.001, 0.01, and 0.1 mg/mL. The high percentage of cell viability relative to that observed in the controls indicates that the ChS-CS nanoparticles and FITC-BSA-loaded ChS-CS nanoparticles were not cytotoxic to Caco-2 cells under these conditions.
Figure 3 Cytotoxicity profile of positively (blue) and negatively (red) charged ChSCS nanoparticles, and of positively (green) and negatively (purple) charged FITC-BSA loaded ChS-CS nanoparticles after 72 hours of incubation with Caco-2 cells as determined by WST-1 assay.
Notes: Percent viability of fibroblasts is expressed relative to control cells (results are represented as the mean ± standard deviation, n = 6).
Abbreviations: BSA, bovine serum albumin; ChS, chondroitin 4-sulfate sodium salt; CS, chitosan; FITC, fluorescein isothiocyanate.
Ex vivo nanoparticle cell uptake studies
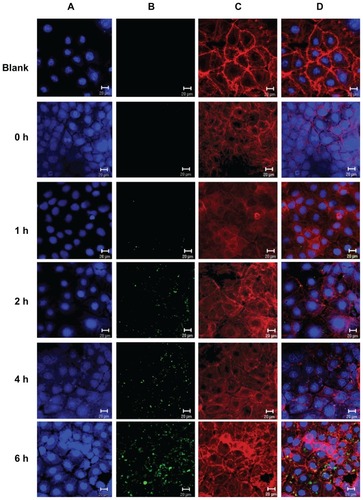
The intracellular uptake of FITC-BSA-loaded ChS-CS nanoparticles was studied in Caco-2 cells using confocal laser microscopy. Immunofluorescent images were taken by staining cell nuclei using TO-PRO-3 iodide (blue part) and cell membranes using BoDiPY-phalloidin (red part). Confocal micrographs () reveal colocalization of the positively charged FITC-BSA-loaded ChS-CS nanoparticle spheres (green part) with intrinsic fluorescence after incubating Caco-2 cells with FITC-BSA for 0, 1, 2, 4, and 6 hours. shows the surface of Caco-2 cells without any treatment. These control cells were flat and well spread, with small lamellipodia, and maintained their typical shape and surface morphology, suggesting cell motility. The microtubules also formed a dense and evenly distributed network around the nucleus. The confocal laser microscopy images of nanoparticle uptake indicate that untreated Caco-2 control cells retained their viability, shape, and structure over the 6-hour observation period. No autofluorescence was detectable in the untreated control cells during this period. also shows that the cells were well spread and there was no distinct change in morphology after 6 hours of incubation with nanoparticles relative to the findings in control cells. It was observed that a small degree of fluorescence was noticeable in a limited number of cells between 30 and 45 minutes (data not shown). The fluorescence obtained for FITC-BSA was the sum of that from the FITC-BSA entrapped in the nanoparticles and that from the FITC-BSA already released in the culture medium. However, this fluorescence disappeared after 45 minutes, and no additional fluorescence was observed through to the end of the observation period. FITC-BSA- loaded nanoparticle uptake was continuous over time, as the size, number, and fluorescent intensity of nanoparticle aggregates present in the cell increased over the 6-hour observation period. Immunofluorescence analyses indicated uptake of FITC-BSA-loaded nanoparticles by Caco-2 cells for all formulations tested after 2 hours of exposure. The FITC-BSA-loaded nanoparticles were well distributed in cells treated for 2 hours. However, large aggregates were present in the cells following 180 minutes of treatment, and remained in the cells for up to 6 hours (). Following 2 hours of coculture, FITC-BSA-loaded nanoparticles were observed in cells for all tested formulations, with the nanoparticles accumulated around the endothelial cell body and nucleus.
Figure 4 Uptake of positively charged nanoformulated FITC-BSA-loaded ChS-CS nanoparticles by Caco-2 cells following phagocyte cocultivation as described in the Methods section; confocal laser scanning imaging of Caco-2 incubated with FITC-BSA-loaded ChS-CS nanoparticles for 0, 1, 2, 4, and 6 hours (from top to bottom). (A) Cell nucleus stained with TO-PRO-3 iodide (blue part), (B) FITC-BSA-loaded ChS-CS nanoparticles (green part), (C) cell membranes stained with BoDiPY-phalloidin (red part), and (D) merged A, B, and C pictures.
Note: Bar 20 μm.
Abbreviations: BSA, bovine serum albumin; ChS, chondroitin 4-sulfate sodium salt; CS, chitosan; FITC, fluorescein isothiocyanate.
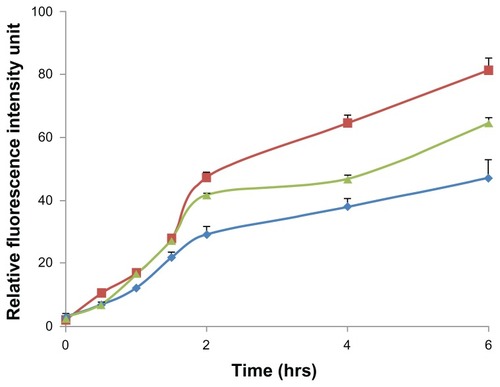
Flow cytometry was used to quantify the fluorescent intensity of nanoparticle uptake by Caco-2 cells (). The fluorescent intensity of FITC-BSA in each group of treated cells was quantitatively analyzed according to the number of nanoparticles per vesicle or cell using flow cytometric techniques,Citation17,Citation18 and the data revealed a constant increase in nanoparticle internalization over time, as indicated by the relative fluorescence value of 6–18 in Caco-2 cells. The average intracellular fluorescent intensity of cells treated with positively charged FITC-BSA-loaded ChS-CS nanoparticles (78 units) was significantly greater than that of cells treated with negatively charged FITC-BSA-loaded ChS-CS nanoparticles (58 units) and FITC-BSA solution only (42 units) at 6 hours (). Exposure of Caco-2 cells to nanoparticles with a positive zeta potential resulted in an increase in the fluorescent intensity of the cell population and generation of a positive fluorescent signal at 1, 1.5, and 2 hours. The fluorescent intensity of the positive cell population increased over time up to 6 hours. Analysis at 2 hours suggested an increase in the fluorescent intensity of the cell population compared with those at 0.5, 1, and 1.5 hours. A steady increase in the fluorescence intensity of cells was evident from 2 hours to 6 hours. Analysis of Caco-2 cells treated with negatively charged 250 nm FITC-BSA-loaded ChS-CS nanoparticles revealed the same trend as observed in cells exposed to the positively charged FITC-BSA-loaded ChS-CS nanoparticles, because increases in fluorescence were evident at both one and 1.5 hours compared with control fluorescence. However, both positively and negatively charged nanoparticles increased the level of cellular fluorescence slightly at 2 hours, and a steady increase in the fluorescent intensity was observed from 2 to 6 hours (). The results had good reproducibility.
Figure 5 Time course for uptake of FITC-BSA-loaded ChS-CS nanoparticles by Caco-2 cells quantified by fluorescence-activated cell sorting analysis using flow cytometry at hours 0, 0.5, 1, 1.5, 2, 4, and 6.
Abbreviations: BSA, bovine serum albumin; ChS, chondroitin 4-sulfate sodium salt; CS, chitosan; FITC, fluorescein isothiocyanate.
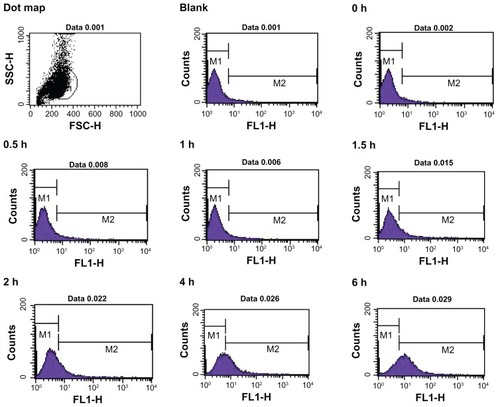
Figure 6 Fluorescent intensity according to flow cytometry data, elucidating the effect of charge modifications on the internalization efficiency of positively charged FITC-BSA-loaded ChS-CS nanoparticles (
 ), and FITC-BSA solution (0.1 mL; 0.1 mg/mL) (
 ) on Caco-2 cells at varied time incubations.
Note: Results are represented as the mean ± standard deviation, n = 6.
Abbreviations: BSA, bovine serum albumin; ChS, chondroitin 4-sulfate sodium salt; CS, chitosan; FITC, fluorescein isothiocyanate.
Ex vivo transepithelial transport nanoparticle studies
In recent years, the Caco-2 cell line has become a popular model of the intestinal mucosa because these cells have a colonic origin and express transporters that are normally found in the intestinal mucosa.Citation20 The intestinal transport mechanisms of positively and negatively charged FITC-BSA- loaded ChS-CS nanoparticles were also investigated in the present study using Caco-2 cells and evaluated by CLSM (). After incubating Caco-2 cells with 0.1 mL (100 μg/mL) of positively and negatively charged FITC-BSA-loaded ChS-CS nanoparticles for 0, 1, 2, 4, and 6 hours, the cells were fixed, and their nuclei and membranes were stained with TO-PRO-3 iodide and BODIPY-phalloidin, respectively.
Figure 7 Confocal laser scanning imaging of Transwell membrane of Caco-2 incubated with positively charged FITC-BSA-loaded ChS-CS nanoparticles at 37°C for hours 0, 1, 2, 4, and 6 (from top to bottom) as described in the Methods section. (A) Cell nucleus stained with TO-PRO-3 iodide (blue part), (B) FITC-BSA-loaded ChS-CS nanoparticles (green part), (C) cell membrane stained with BoDiPY-phalloidin (red part), and (D) merged A, B, and C pictures.
Note: Scale bar 20 μm.
Abbreviations: BSA, bovine serum albumin; ChS, chondroitin 4-sulfate sodium salt; CS, chitosan; FITC, fluorescein isothiocyanate.
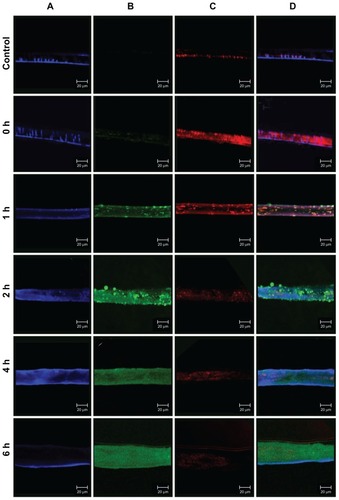
Exposure of Caco-2 cells to positively or negatively charged FITC-BSA-loaded ChS-CS nanoparticles resulted in fluorescent labeling as observed by CLSM. Rapid uptake of the nanoparticles via attachment to the Caco2 monolayer cell membrane surface was detected after 10 minutes, and fluorescent cells were observed within the first 20 minutes. At this early time point, a small number of aggregates were present in the Caco-2 monolayer surface. FITC-BSA-loaded ChS-CS nanoparticles were detected clearly on the cell surface and in the cytoplasm after 45 minutes, where they remained for up to 6 hours (). Over the initial 60-minute incubation period, a large positive charge of nanoparticles was found around the cell membrane, and the fluorescent intensity and number of nanoparticles increased over time. This was concurrent with an increase in the number of aggregates passing through the membrane and into the cell. Over the next 60 minutes, the cellular uptake of positively charged nanoparticles through the monolayer membrane was more rapid than that of the negatively charged nanoparticles and FITC-BSA solution. The uptake was continuous, with the aggregates present inside the cell increasing in size, fluorescent intensity, and number over time (, green fluorescence). For Caco-2 monolayer cells, after 2 hours of exposure to the FITC-BSA-loaded ChS-CS nanoparticles, bright fluorescence was also observed in the membranes of viable cells, and bright fluorescence due to FITC-BSA was observed inside the monolayer cells, even after 6 hours. Obviously, the cellular burden of the particles was so great that much of the cell area was often occupied by FITC-BSA-loaded ChS-CS nanoparticles. In addition, the cells formed many lamellipodia and filopodia that projected from the cell membranes over the glass surface. Upon phagocytosis, the particles may affect the overall cytoskeleton of the cells by forming vacuoles in the cell body, potentially resulting in cytoskeletal disruption and cell membrane protrusions.Citation15 However, the nanoparticles were phagocytosed by the cells within the first 60 minutes of exposure. In addition, the nanoparticle uptake studies utilizing the CLSM images taken at 6 hours provided further information on cell morphology in response to particle incubation, confirming subcellular distribution of the nanoparticles at an organelle level.Citation9,Citation14,Citation15
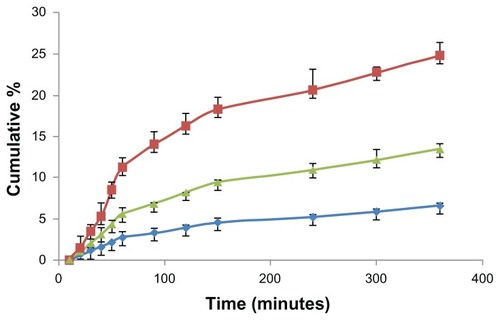
Endocytosis of FITC-BSA-loaded ChS-CS particles was confirmed by evaluating the basolateral side of FITC-BSA with a fluorometer. After incubating Caco-2 cells with 0.1 mL (100 μg/mL) of FITC-BSA-loaded ChS-CS nanoparticles for 10, 20, 30, 40, 50, 60, 90, 120, 150, 240, 300, and 360 minutes, the fluorescence intensity profiles of the basolateral side were assessed (). A linear relationship was observed from 0 to 60 minutes (). There were significant differences between uptake relative to the amount of positively and negatively charged FITC-BSA-loaded ChS-CS nanoparticles loaded into Caco-2 monolayers (14% versus 6.8% at 60 minutes, 27% versus 15% at 360 minutes, P < 0.05).
Figure 8 Time courses for the Caco-2 cell monolayer transepithelial transport efficiency study. The fluorescent intensity of FITC-BSA data; positive charge of FITC-BSA-loaded ChS-CS nanoparticles (
), and FITC-BSA solution (0.1 mL; 0.1 mg/mL) ().Notes: All values are shown as the mean ± standard deviation; n = 6.
Abbreviations: BSA, bovine serum albumin; ChS, chondroitin 4-sulfate sodium salt; CS, chitosan; FITC, fluorescein isothiocyanate.
The exploitation of particulate carrier systems for the delivery of hydrophilic macromolecules via the physiological absorption barrier route remains challenging. Apart from particle size, it has been reported that the surface charge is a very important factor influencing the efficiency and mechanism of cellular uptake and the in vivo fate of nanoparticles.Citation21–Citation24 However, the optimum surface charges (eg, positive, neutral, or negative) and charge densities are different for different nanoparticle systems. For example, Juliano et alCitation22 reported that neutral and positively charged liposomes are cleared less rapidly than negatively charged liposomes, which could be explained by the tendency of negatively charged liposomes to coalesce in the presence of proteins and calcium ions in blood plasma. Conversely, Yamamoto et alCitation23 demonstrated that neutral and negatively charged micelles exhibited no remarkable difference in their blood clearance kinetics; however, negatively charged micelles showed significantly reduced nonspecific uptake by the liver and spleen compared with uptake by neutral micelles, which is attributed to electrostatic repulsion between negatively charged micelles and the cell surface. The inconsistent results of the aforementioned studies may be due to differences in nanoparticle types, variation in the stability of nanoparticles resulting from surface charges, the nature of the charged groups, and other confounding factors, such as homogeneous particle sizes. He et alCitation21 systematically studied the effects of particle size (150–500 nm) and surface charge on the cellular uptake and biodistribution of chitosan derivative polymeric nanoparticles. Strategies for escaping phagocytic uptake included maintaining the particle size around 150 nm and the zeta potential below 15 mV. It is clear that relatively small physicochemical differences, such as 10 mV changes of the zeta potential, play a vital role in nonphagocytic cell uptake. Fluorescently labeled chitosan derivative nanoparticles with negative and positive charges indicate that cell line-dependent uptake and energy-dependent and actin-mediated endocytosis is involved in the endocytic process. These results are in accordance with those of inorganic nanoparticles and liposomes, demonstrating that the particle size and surface charge of nanoparticles are more important parameters than their composition. Xiao et alCitation24 demonstrated that positively charged nanoparticles had concentration-dependent hemolytic activity and cytotoxicity in RAW 264.7 cells proportional to their positive surface charge density, whereas negatively charged nanoparticles did not display obvious hemolytic and cytotoxic properties. In vivo biodistribution studies demonstrated that undesirable liver uptake is very high for highly positively or negatively charged nanoparticles, which is likely due to active phagocytosis by macrophages (Kupffer cells) in the liver.
Conclusion
This study demonstrates that nanosized positively and negatively charged spherical and monodispersed FITC- BSA-loaded ChS-CS nanoparticles can be prepared by an ionic gelation method. It is clear that physicochemical differences such as changes in zeta potential play a vital role in the internalization behavior of nanoparticles and on cell viability and compatibility. The ChS-CS nanoparticles and FITC-BSA-loaded ChS-CS nanoparticles were nontoxic to cells at concentrations up to 100 μg/mL. Furthermore, ex vivo cellular uptake studies using Caco-2 cells revealed that both positively and negatively charged FITC-BSA-loaded ChS-CS nanoparticles were phagocytosed within the cells, although the positively charged nanoparticles were taken up more efficiently by Caco-2 cells than the negatively charged nanoparticles. Ex vivo studies with human Caco-2 cells demonstrated that positively charged FITC-BSA-loaded ChS-CS nanoparticles were more suited to efficient delivery of biopharmaceuticals into cells than negatively charged FITC-BSA-loaded ChS-CS nanoparticles, and for increasing protein delivery across cell barriers. Our results are in agreement with those for polymeric nanoparticles, indicating that the surface charge of nanoparticles is a more important parameter than the composition of the nanoparticles.Citation5,Citation25 Our studies also clarify the interactions between FITC-BSA-loaded ChS-CS nanoparticles and human Caco-2 cells in ex vivo conditions in more detail prior to their use in ex vivo situations. These results are of potential value as guidelines for predicting the behavior of nanoparticles for specific desired applications in the biological and pharmaceutical fields, including the design of nanosized delivery vehicles. In conclusion, this new nanoparticle system offers potential as carriers of proteins, vaccines, and genes.
Acknowledgment
We would like to thank the National Science Council of the Republic of China (NSC 98-2320-B-016-003-MY3) for financially supporting this research.
Disclosure
The authors report no conflicts of interest in this work.
References
- ChadwickSKriegelCAmijiMNanotechnology solutions for mucosal immunizationAdv Drug Deliv Rev2010624–539440719931581
- KamphorstAOGuermonprezPDudziakDNussenzweigMCRoute of antigen uptake differentially impacts presentation by dendritic cells and activated monocytesJ Immunol201018563426343520729332
- CamargoJASapinADalozDMaincentPIvermectin-loaded microparticles for parenteral sustained release: in vitro characterization and effect of some formulation variablesJ Microencapsul201027760961720695833
- LiZZhangLSunWDingQHouYXuYArchaeosomes with encapsulated antigens for oral vaccine deliveryVaccine201129325260526621609747
- WinKYFengSSEffects of particle size and surface coating on cellular uptake of polymeric nanoparticles for oral delivery of anticancer drugsBiomaterials200526152713272215585275
- BilensoyESarisozenCEsendaglIGIntravesical cationic nanoparticles of chitosan and polycaprolactone for the delivery of mitomycin C to bladder tumorsInt J Pharm20093711–217017619135514
- WongHLChattopadhyayNWuXYBendayanRNanotechnology applications for improved delivery of antiretroviral drugs to the brainAdv Drug Deliv Rev2010624–550351719914319
- YehMKChengKMHuCSHuangYCYoungJJNovel protein-loaded chondroitin sulfate-chitosan nanoparticles: preparation and characterizationActa Biomater20117103804381221742066
- BrandenbergerCMühlfeldCAliZQuantitative evaluation of cellular uptake and trafficking of plain and polyethylene glycol-coated gold nanoparticlesSmall20106151669167820602428
- ChenCHanDCaiCTangXAn overview of liposome lyophilization and its future potentialJ Control Release2010142329931119874861
- ChristensenDKirbyDFogedC[alpha],[alpha]′-trehalose 6,6′-dibehenate in non-phospholipid-based liposomes enables direct interaction with trehalose, offering stability during freeze-dryingBiochim Biophys Acta2008177851365137318261458
- ChenHWangLYehJReducing non-specific binding and uptake of nanoparticles and improving cell targeting with an antifouling PEO-b-P[gamma]MPS copolymer coatingBiomaterials201031205397540720398933
- FosterKYazdanianMAudusKMicroparticulate uptake mechanisms of in-vitro cell culture models of the respiratory epitheliumJ Pharm Pharmacol200153576611206193
- GuptaAKGuptaMYarwoodSJCurtisASGEffect of cellular uptake of gelatin nanoparticles on adhesion, morphology and cytoskeleton organisation of human fibroblastsJ Control Release200495219720714980768
- DashBCRéthoréGMonaghanMFitzgeraldKGallagherWPanditAThe influence of size and charge of chitosan/polyglutamic acid hollow spheres on cellular internalization, viability and blood compatibilityBiomaterials201031328188819720701967
- LinAChenJLiuYPreparation and evaluation of N-caproyl chitosan nanoparticles surface modified with glycyrrhizin for hepatocyte targetingDrug Dev Ind Pharm200935111348135519832635
- ChenCWLuDWYehMKShiauCYChiangCHNovel RGD-lipid conjugate-modified liposomes for enhancing siRNA delivery in human retinal pigment epithelial cellsInt J Nanomedicine201162567258022128247
- ChangZYLuDWYehMKChiangCHA novel high-content flow cytometric method for assessing the viability and damage of rat retinal ganglion cellsPLoS One201273e3398322457807
- ChangWKTaiYJChiangCHHuCSHongPDYehMKThe comparison of protein-entrapped liposomes and lipoparticles: preparation, characterization, and efficacy of cellular uptakeInt J Nanomedicine201162403241722072876
- YeeSIn vitro permeability across Caco-2 cells (colonic) can predict in vivo (small intestinal) absorption in man – fact or mythPharm Res19971467637669210194
- HeCHuYYinLTangCYinCEffects of particle size and surface charge on cellular uptake and biodistribution of polymeric nanoparticlesBiomaterials201031133657366620138662
- JulianoRStampDThe effect of particle size and charge on the clearance rates of liposomes and liposome encapsulated drugsBiochem Biophys Res Commun19756336516581131256
- YamamotoYNagasakiYKatoYSugiyamaYKataokaKLong- circulating poly(ethylene glycol)-poly(D,L-lactide) block copolymer micelles with modulated surface chargeJ Control Release2001771–2273811689257
- XiaoKLiYLuoJThe effect of surface charge on in vivo biodistribution of PEG-oligocholic acid based micellar nanoparticlesBiomaterials201132133435344621295849
- WangZWangLZhangJLiYZhangDA study on the preparation and characterization of plasmid DNA and drug-containing magnetic nanoliposomes for the treatment of tumorsInt J Nanomedicine2011687187521720500