 ?Mathematical formulae have been encoded as MathML and are displayed in this HTML version using MathJax in order to improve their display. Uncheck the box to turn MathJax off. This feature requires Javascript. Click on a formula to zoom.
Abstract
S-CKD602 is a PEGylated liposomal formulation of CKD-602, a potent topoisomerase I inhibitor. The objective of this study was to characterize the bidirectional pharmacokinetic–pharmacodynamic (PK–PD) interaction between S-CKD602 and monocytes. Plasma concentrations of encapsulated CKD-602 and monocytes counts from 45 patients with solid tumors were collected following intravenous administration of S-CKD602 in the phase I study. The PK–PD models were developed and fit simultaneously to the PK–PD data, using NONMEM®. The monocytopenia after administration of S-CKD602 was described by direct toxicity to monocytes in a mechanism-based model, and by direct toxicity to progenitor cells in bone marrow in a myelosuppression-based model. The nonlinear PK disposition of S-CKD602 was described by linear degradation and irreversible binding to monocytes in the mechanism-based model, and Michaelis–Menten kinetics in the myelosuppression-based model. The mechanism-based PK–PD model characterized the nonlinear PK disposition, and the bidirectional PK–PD interaction between S-CKD602 and monocytes.
Introduction
S-CKD602 is a sterically stabilized PEGylated liposomal formulation of CKD-602. CKD-602 is a novel camptothecin analog which inhibits topoisomerase I.Citation1–Citation3 Nonliposomal CKD-602 administered intravenously (IV) at 0.5 mg/m2/day for five consecutive days every 3 weeks has been approved in Korea for the treatment of small cell lung cancer, and relapsed ovarian cancer.Citation4–Citation7 S-CKD602 STEALTH® liposomes are composed of the lipids distearoylphosphatidylcholine and distearoylphosphatidylethanolamine, covalently bound to N-(carbonylmethoxypolyethylene glycol 2000)-1,2-distearoyl- sn-glycero-3 phosphoethanolamine sodium salt (DSPE-MPEG-2000).Citation1,Citation8 The average particle size of the S-CKD602 liposomes is ~100 nm. In this formulation, CKD-602 lactone is encapsulated in the aqueous core of the liposome with an encapsulation efficiency of >85%.Citation1,Citation8 Encapsulation of the CKD-602 in the acidic core of a PEGylated liposome protects the biologically active lactone form of the drug from being converted to the inactive hydroxyacid form in the blood. The liposomal encapsulation also allows release of the active-lactone form into the tumor over a prolonged period of time, which is ideal for a cell-cycle-specific drug.Citation3,Citation9–Citation13
The pharmacokinetic (PK) disposition of carrier-mediated agents, such as nanoparticles, nanosomes, and conjugated agents, is dependent upon the carrier until the drug is released from the carrier. Unlike traditional anticancer agents, which are cleared by the liver and kidneys, the clearance of non-PEGylated and PEGylated liposomes occurs via the mononuclear phagocytic system (MPS), which include monocytes, macrophages, and dendritic cells located primarily in blood, liver, and spleen.Citation14 PEGylated liposomes are cleared much slower via MPS compared with non-PEGylated liposomes.Citation15,Citation16 Uptake of the liposomes, or nanoparticles, by the MPS usually results in sequestering of the encapsulated drug in the MPS. The sequestered drug in the MPS may cause acute and/or long-term cytotoxicity to the MPS. This toxicity to the MPS, in turn decreases clearance of the PEGylated liposomal anticancer agents, and alters the pharmacodynamics (PD) of the agents. Thus, there is a bidirectional interaction between PEGylated liposomal anticancer agents and MPS. Since a major portion of the liposomal-encapsulated drug molecules are confined primarily to the blood compartment due to their relative large size, this bidirectional interaction between PEGylated liposomal anticancer agents and monocytes in blood is very important in determining the PK and PD of PEGylated liposomal anticancer agents, and potentially other nanoparticle and conjugated agents.Citation17
As monocytes of the MPS play an important role in the PK disposition of liposomes, monocytopenia after administration of PEGylated liposomal anticancer agents was selected as a PD measure of these agents.Citation2,Citation16 Monocytopenia is also commonly observed after small-molecule chemotherapy, as a result of myelosuppression.Citation18,Citation19 However, the monocytopenia is greater and occurs earlier after administration of liposomal agents compared with nonliposomal agents.Citation2,Citation16 The results of our prior study suggest that monocytes are more sensitive to S-CKD602 as compared with neutrophils, and that this increased sensitivity is related to the liposomal formulation and not the encapsulated CKD-602.Citation16 Therefore, the monocytopenia following administration of PEGylated liposomal agents may have a different mechanism from monocytopenia following treatment with conventional small-molecule chemotherapeutic drugs. Incorporation of the bidirectional interaction between PEGylated liposomal formulation and monocytes is important to the characterization of this novel PK and PD of these agents.
Although a few physiologically-based PD models of chemotherapy-induced anemia, neutropenia, and thrombocytopenia have been developed, PD models of monocytopenia, especially as related to nanoparticle PK and PD, have not been reported.Citation20–Citation24 As monocytes are derived from the same granulocyte-macrophage progenitor cells as other leukocytes, PD models of leukocytopenia may be applicable to monocytopenia. A semiphysiological model proposed by Friberg et alCitation20,Citation21 for chemotherapy-related myelosuppression was chosen as a standard model to describe monocytopenia after S-CKD602. In this model, the cell maturation associated with myelopoiesis is described by multiple transit compartments with the same rate constant between each compartment, to account for the time delay for onset of response.Citation20,Citation21 In addition, a feedback loop was included to account for the rebound of leukocytes typically observed in myelosuppression profiles. This model has been widely applied to various anticancer agents to describe neutropenia, leukocytopenia, and thrombocytopenia because it involves minimum number of parameters.Citation21,Citation25–Citation29
The clinical results of the phase I and PK study of S-CKD602 have been previously published.Citation30 The PK study of S-CKD602 using the conventional compartment model has also been published, and the dose-dependent clearance of S-CKD602 was modeled using Michaelis–Menten kinetics.Citation31 This is the first study to evaluate the bidirectional interaction between a nanoparticle agent and the monocytes of the MPS in patients using PK–PD modeling. These findings and approach can be applied to the more than 300 other nanoparticle formulations of anticancer agents that are currently in development. Thus, this is a very novel study with a far-reaching impact.
The conventional theory is that the monocytopenia of small-molecule chemotherapy is due to cytotoxicity to the progenitor cells in the bone marrow. However, it is unclear whether the monocytopenia associated with liposomal agents is due to direct cytotoxicity to monocytes in the blood, or cytotoxicity to progenitor cells in bone marrow. We believe the bidirectional interaction between PEGylated liposomal anticancer drugs and monocytes in blood is important to characterize the monocytopenia after administration of these agents and how monocytopenia affects PK of these agents. We developed mechanism-based PK–PD models based on direct and on indirect cytotoxicity of S-CKD602 to monocytes, and compared the model fit of these two models. The objectives of this study were to develop a mechanism-based population PK–PD model to investigate the nature of nonlinear PK of S-CKD602, and to increase our understanding of the bidirectional interaction between PEGylated liposomal anticancer agents and monocytes in the blood of cancer patients.
Methods
Study design
The PK data were obtained from a Phase I study of S-CKD602 in patients with advanced solid tumors.Citation30,Citation31 The study design and clinical results have been reported elsewhere.Citation30,Citation31 Forty-five patients (21 males) received S-CKD602 at 0.1 to 2.5 mg/m2 IV × 1 over approximately 1 hour, every 3 weeks. No premedications were administered prior to S-CKD602. Written informed consent, which had been approved by the Institutional Review board of the University of Pittsburgh Medical Center, was obtained from all patients prior to study entry. Patients ≥ 18 years of age with histologically or cytologically confirmed malignancies for which no effective therapy was available, and with an Eastern Cooperative Oncology Group performance status of 0–2, were eligible for this study. Pertinent eligibility criteria included adequate bone marrow, as well as hepatic and renal function evidenced by the following laboratory parameters: (i) absolute neutrophil count ≥ 1,500/μL, (ii) platelet count ≥ 100,000/μL, (iii) total bilirubin ≤ 1.5 × upper limit of the institutional normal range, (iv) aspartate aminotransferase ≤ 1.5 × upper limit of the institutional normal range if liver metastases were not present and ≤4 × ULN if liver metastases were present, and (v) the absence of microscopic hematuria published.Citation30,Citation31 The mean age of the patients was 60.6 (range 33–79) years. In this study, serial plasma samples were obtained prior to drug administration; at the end of the infusion (at around 1 hour); and at 3, 5, 7, 24, 48, 72, 96, 168 (day 8), and 336 hours (day 15) after the start of the infusion. Total (lactone + hydroxyl acid) concentrations of encapsulated and released CKD-602 in plasma were determined by liquid chromatography-tandem mass spectrometry.Citation1 The lower limit of quantitation of the total form of encapsulated and released CKD-602 were 2 ng/mL and 0.05 ng/mL, respectively. Samples of peripheral blood were collected before dosing on days 7, 14, 21, and 28 and used to measure monocyte counts. Monocyte count in blood was determined by standard clinical hematology methods.Citation32
Population PK–PD analysis
Model development
The bidirectional interaction between PEGylated liposomal anticancer agents and monocytes plays a key role in the elimination of PEGylated liposomal anticancer agents and monocytopenia observed in our prior studies.Citation16 A mechanism-based model based on receptor binding kinetics was developed to describe the bidirectional interaction between the concentration versus time profile of encapsulated CKD-602, and the time course of monocytes. A myelosuppression-based model, in absence of the bidirectional interaction, was also developed to compare with the mechanism-based model. For each kind of model, a variety of model structures were tested. The best models were selected on the basis of Akaike’s information criterion, precision of estimates, and goodness-of-fit plots.Citation33
Model I: myelosuppression-based model
The PK–PD model of encapsulated CKD-602 and monocytes was built sequentially. One compartment model with Michaelis–Menten kinetics best described the PK data of encapsulated CKD-602 in our previous analysis. The individual PK parameters of encapsulated CKD-602 determined from the best PK model of encapsulated CKD-602 were used in the PD model of monocytes. In the PK modeling part, PK parameters were estimated for each individual. For the PD modeling of monocytopenia, all of the individual values of the PK parameters were fixed for each patient, and the predicted individual encapsulated CKD-602 concentration–time profiles were used as input functions into this PK–PD model. The PD parameters were estimated simultaneously in the PD modeling part. This sequential modeling approach was selected over a simultaneous PK–PD estimation, to expedite the PD modeling by using the existing individual estimates of PK parameters.
A chemotherapy-induced myelosuppression model developed by Friberg et alCitation21 was used to describe the monocytopenia after administration of S-CKD602 (). The model consists of a proliferating compartment (Prol) that represents progenitor cells, three transit compartments of maturing cells (Transit), and a compartment of circulating monocytes. A negative feedback mechanism (MONO0/MONO)γ from circulating cells on proliferating cells is included to describe the rebound of cells including an overshoot compared with the baseline value (MONO0). The drug concentration in plasma of the central compartment (Cp) is assumed to reduce the proliferation rate by the function EDrug, which was modeled to be a maximum-attainable effect (Emax) model. The differential equations were written as
Figure 1 The myelosuppression-based PK–PD model (A) and the mechanism-based PK–PD model (B) for encapsulated CKD-602 and monocytes.
Abbreviations: PK–PD, pharmacokinetic-pharmacodynamic; VEncap, volume of distribution; k0, infusion rate; Km, concentration at which half-maximum elimination rate is achieved; Vmax, maximum elimination rate; Imax, maximum capacity of inhibition; IC50, concentration at which half-maximum inhibition is achieved; kprol, proliferation rate constant; ktr, transit rate constant; kmono, removal rate constant of monocyte; Mono, monocyte count; Mono0, baseline monocyte count; γ, feedback constant; kdeg, degradation rate constant; kin, monocyte production rate constant; kout, monocyte removal rate constant; IV, intravenous.
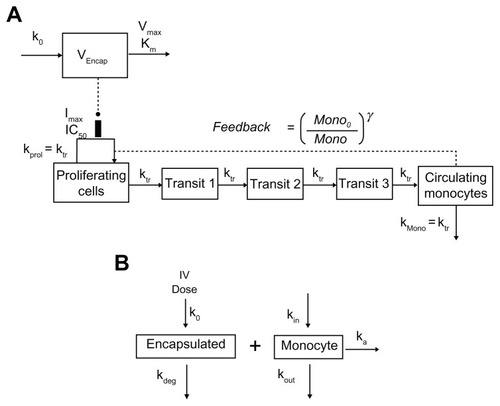
where dAEncap/dt is the elimination rate, Vmax is the maximum elimination rate or maximum velocity, Km is the concentration at which half-maximum elimination rate is achieved, VEncap is the volume of distribution, AEncap is encapsulated CKD-602 amount in plasma, CEncap is the plasma concentration of encapsulated CKD-602, k0 is the infusion rate and k0 is 0 after stop of infusion, ktr is the transit rate constant, Emax is the maximum attainable effect, EC50 is the concentration producing 50% of Emax, Mono0 is the baseline monocyte count, γ is the feedback constant, kprol is the proliferation rate constant, kmono is the removal rate constant of monocyte, Mono is the monocyte count. The drug concentration in the central compartment is assumed to reduce the proliferation rate by the function EDrug. At steady state, dProl/dt = 0, and therefore kprol = ktr. To minimize the number of parameters to be estimated, it was assumed in the modeling that kmono = ktr.
Model II: mechanism-based PK–PD model
A mechanism based PK–PD model that incorporates the interaction between PEGylated liposomal anticancer agents and monocytes was developed for S-CKD602 (). Concentration versus time data of encapsulated CKD-602 in plasma and monocyte count in blood were f it simultaneously by this model. Drug is dosed IV into the systemic circulation (blood compartment) at a zero-order rate (k0). The distribution of PEGylated liposome is described by a one-compartment model and the PEGylated liposome is eliminated by interacting with monocyte to form liposome-monocyte complex (ka), which represents the phagocytosis of S-CKD602 by the monocyte. PEGylated liposome is also degraded at a first-order rate (kdeg). This represents the elimination of the liposome through routes other than uptake by monocytes. The parameters describing the production and loss of monocytes are kin and kout. The production rate of monocytes kin is equal to kout multiplied by baseline monocyte value. The differential equations were written as:
where ka is the association rate constant, kdeg is the degradation rate constant of S-CKD602, and kout is the removal rate constant of monocyte. Since the unit of encapsulated CKD-602 is μg/L and the unit of monocyte count is 109/L, the drug amount-monocyte count conversion factor (SFactor) is a parameter used to bridge the unit gap.
Data analysis
Plasma concentrations of encapsulated CKD-602 and monocyte counts were obtained from 45 patients. A total of 292 plasma concentrations of encapsulated CKD-602 and 123 monocyte counts were used to develop the population PK–PD model. Encapsulated CKD-602 concentration versus time profile and monocyte count versus time data were analyzed using the nonlinear mixed-effects modeling approach, as implemented in NONMEM® (version 6; University of California, San Francisco, CA), for the mechanistic- and myelosuppression-based models. The first-order conditional estimation method was used in analyses. S-PLUS 8.0 (Version 8.0, Insightful Corporation, Seattle, WA) was used for graphical diagnostics.
Mean population PK–PD variables, interindividual variability (IIV), and residual error were assessed in the model development.Citation34,Citation35 IIV for each PK–PD variable was modeled with an exponential function. Residual error models of the additive, proportional, exponential, and combination methods were evaluated for the best structural PK–PD model. Individual PK–PD variables were obtained by posterior Bayesian estimation.Citation34,Citation35
Results
Model I: myelosuppression-based model
Goodness-of-fit plots from the myelosuppression-based PK–PD model in all patients are depicted in . The model adequately describes the PK profile of encapsulated CKD-602. The observed PK data correlated well with the population-predicted (R2 = 0.80) and individual-predicted (R2 = 0.98) data by this model. Although the PD data of monocytes were variable, the observed and model-predicted data agreed relatively well. The observed PD data better correlated with the individual-predicted PD data (R2 = 0.83) than with population-predicted PD data (R2 = 0.43). Representative individual PK profiles of encapsulated CKD-602 and time course of monocytopenia in patients are shown in . The observed data of encapsulated CKD-602 and monocytes were well described by the myelosuppression-based model.
Figure 2 Goodness-of-fit plots for the myelosuppression-based model (A); and representative individual plots of observed (○) and individual-predicted (—) values of encapsulated CKD-602 and monocytes from the myelosuppression-based model (B).
Note: The solid lines in Figure 2A are lines of identity.
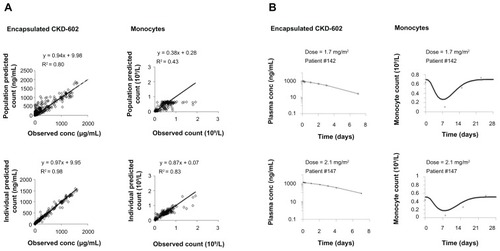
The encapsulated CKD-602 and monocytes were modeled sequentially for all patients. The distribution of residual variability was best described by a proportional error model. The PK and PD parameter estimates obtained from the final model are provided in . In the final model, the mean and IIV(coefficient of variation %) values for Vencap were 3.46 L and 78.6%, respectively. The estimated Vencap was very close to plasma volume in humans. The mean Michaelis–Menten constant was estimated to be 877 μg/L. The maximum velocity of encapsulated CKD-602 was estimated to be 95.5 (IIV 234%) μg/h. The mean transit compartment rate constant was estimated to be 0.0774 h−1. The mean maximum inhibition effect was estimated to be 0.64. The inhibition constant of S-CKD602 was estimated to be 355 (IIV 146%) μg/L. The baseline monocyte value was estimated to be 0.605 (IIV 35.5%) × 109/L. The mean feedback constant was estimated to be 0.0955.
Table 1 Population PK–PD parameters obtained from the myelosuppression-based model for encapsulated CKD-602 and monocytes
Model II: mechanism-based PK–PD model
Goodness-of-fit plots from the mechanism-based PK–PD model in all patients are depicted in . Similar to the myelosuppression-based model, the population-predicted and individual-predicted encapsulated CKD-602 concentrations were highly correlated with the observed values, and the observed and model-predicted data agreed relatively well. Representative individual PK profiles of encapsulated CKD-602 and time course of monocytopenia in patients are shown in . The observed data of encapsulated CKD-602 concentration and monocytes were well described by the mechanism-based model.
Figure 3 Goodness-of-fit plots for the mechanism-based model (A); and representative individual plots of observed (○) and individual-predicted (—) values of encapsulated CKD-602 and monocytes from the mechanism-based model (B).
Note: The solid lines in Figure 3A are lines of identity.
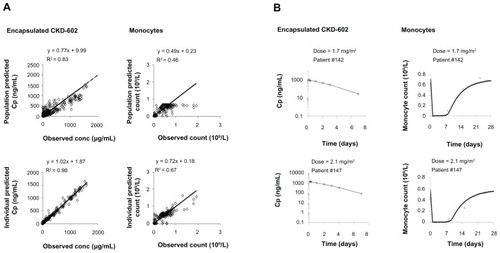
The encapsulated CKD-602 and monocytes were modeled simultaneously for all patients. The distribution of residual variability was best described by a proportional plus additive error model. The PK–PD parameter estimates obtained from the final model are provided in . The Vencap was estimated to be 4.1 L (IIV 58.9%). The estimated Vencap is close to the plasma volume in humans. The mean association rate constant was estimated to be 1.9 L · h−1. The kdeg was estimated to be 0.0178 (IIV 50.6%) h−1. The baseline monocyte value was estimated to be 0.671 (IIV 29.9%) × 109/L. The removal rate constant of monocytes was estimated to be 0.00677 (IIV 3.5%) h−1. The conversion factor was estimated to be 382 μg/109.
Table 2 Population PK–PD parameters obtained from the mechanism-based model for encapsulated CKD-602 and monocytes
Discussion
This is the first study to evaluate the bidirectional interaction between a nanoparticle agent and the monocytes of the MPS in patients using PK–PD modeling. These findings and approach can be applied to the more than 300 other nanoparticle formulations of anticancer agents that are currently in development. Thus, this is a very novel study with a far-reaching impact. The evaluation of the relationship between liposomal drug PK and PD and the involvement of monocytes is of the utmost importance because the nonlinear PK of the liposomal drug may be explained by the saturation of MPS. In addition, this relationship can also explain the bidirectional interaction between liposomal drugs and monocytes. We developed a mechanism-based population PK–PD model that described the relationship between PEGylated liposomal anticancer drugs and monocyte changes in patients with solid tumors, using S-CKD602 as a representative of this class. In this model, an irreversible binding of liposomal drug to monocyte was used to account for the bidirectional interaction between PEGylated liposomal anticancer drug and monocyte. This model adequately described the observed data, as illustrated in , and .
In the mechanism-based model, the mean Vencap was 4.1 L and is close to plasma volume in humans. The estimated Vencap is consistent with our prior PK study of S-CKD602, in which Vencap for patients with nonlinear clearance of encapsulated CKD-602 was estimated to be 2.1 ± 0.7 L/m2. In addition, the limited Vencap is consistent with other liposomal anticancer 2agents, as the size of liposomes limited their distribution to the normal tissue.Citation17,Citation36 The half-life of monocytes was estimated to be 102 hours, which is close to but longer than the reported half-life of monocytes in healthy humans (mean 72 hours, range 36–104 hours).Citation37,Citation38 This discrepancy might be explained by the limited number of PD data, and lack of information about removal rate constant in the data. In this model, S-CKD602 was eliminated via uptake by monocytes (as represented by ka · AEncap · Mono) and linear degradation (as represented by kdeg · AEncap). The association rate constant for uptake by monocytes (1.9 L · h−1) is much greater than the estimated kdeg (0.0178 h−1). This suggests the importance of the uptake of liposomal drugs by monocytes in blood in determining the elimination of S-CKD602 from the central compartment.
The conversion factor was introduced to the mechanism-based model to bridge the unit gap between amount of PEGylated liposomal drug and monocyte count. In our study, we have the monocyte absolute count data in units of number of cells per liter, and the encapsulated CKD-602 amount in micrograms. As the liposome interacts with monocyte via the receptor on the cell surface and the monocyte count is not equal to the concentration of receptors, it is not appropriate to convert the monocyte count data using molar unit. Therefore, we needed this conversion factor to address this issue in the model. We performed modeling on the data with encapsulated CKD-602 amount in micrograms and in moles separately. The results from these two different data sets were similar (data not shown).
Kdeg through routes other than uptake by monocytes was important in the mechanism-based model. We tested the model with and without kdeg. Deletion of kdeg from the final mechanism-based model resulted in an increase in Akaike’s information criterion of 86. It is known that the primary accumulation sites of liposomes are in the liver (eg, Kupffer cells) and spleen.Citation39,Citation40 Therefore, the contribution of other routes is also very important to PK of S-CKD602.
In the myelosuppression-based model, the half-life of monocytes was estimated to be 9.0 hours, which is much shorter than the half-life of monocytes estimated from the mechanism-based model and the reported value from literature. This may be due to direct cytotoxicity of liposomes on monocytes in blood. This may also be explained by the different structures between these two models. The myelosuppression-based model incorporated three transit compartments, and the rate constant between each compartment was the same and equal to the removal rate constant of monocytes from blood circulation. Thus, the offset of the toxic effect on monocyte was counted by three transit compartments in the myelosuppression-based model, whereas, it was counted by one step in the mechanism-based model.
The population prediction of PK data obtained from the mechanism-based model had a higher correlation with the observed PK data, compared with that from myelosuppression-based model. This may suggest that incorporation of bidirectional interaction between PEGylated liposomal anticancer agents and monocytes in the model helped to explain the interindividual variability in the PK of S-CKD602. The population prediction of PK data from the mechanism-based model was lower than the observed PK data at higher concentration level. This may suggest that the degradation of S-CKD602 through other routes was saturated at high concentration levels.
Both of the mechanism-based and myelosuppression-based PK–PD models described the observed PD data of monocytopenia. This suggests that both the chemotherapy-induced myelosuppression and the bidirectional interaction between PEGylated liposomal anticancer agents and monocytes are important to describe the PD profile of monocytes after administration of S-CKD602. However, these two models predicted two different time courses of monocyte count change after administration of S-CKD602. The myelosuppression-based model predicted a day of nadir at around the observed day of nadir, whereas the mechanism-based model predicted an earlier day of nadir compared with the observed. As no monocyte count was collected at the earlier time after administration of S-CKD602, the exact monocyte profile at earlier time points needs to be determined in future studies. Prior studies have reported early monocytes nadirs after administration of liposomal and nanoparticle agent. The PD profile of monocytes reached nadir at 2 days after administration of liposomal alendonate in rats.Citation41 The half-life of monocytes in rats is about 2 days, which is similar to the reported half-life of monocytes in humans.Citation37,Citation38 The PD profile of monocytopenia after administration of liposomal alendonate suggested that the day of monocyte nadir after administration of S-CKD602 may be earlier than the observed value (8.6 ± 3.3 days). Thus, cytotoxic effects in blood and in bone marrow may both explain the decrease in monocytes after administration of PEGylated liposomal anticancer agents.
The mechanism-based model overestimated the monocyte count at lower monocyte counts and underestimated the monocyte count at higher monocyte counts, compared with the myelosuppression-based model. This may be explained by the absence of a feedback loop in the mechanism-based model. We tested the myelosuppression-based model without the feedback loop, which produced a more serious overestimation of monocyte count at lower monocyte counts and underestimation of monocyte count at higher monocyte counts, than mechanism-based model (data not shown). No feedback mechanism has been reported for monocytes. The better PD fit of the myelosuppression-based model suggests that feedback loop may be applicable for monocytes. However, the addition of a feedback loop in the development of the mechanism-based model did not improve the PD fits.
The purpose of this study was to develop a model describing and predicting PK and PD of PEGylated liposomal drugs in patients. Development of a PK–PD model relies on sufficient data from a well-designed study. In the Phase I PK study of S-CKD602, monocyte counts were collected weekly as a measure of toxicity. A better description of monocytopenia requires at least one observation of monocyte counts before a nadir. However, in this Phase I PK study, data were not collected between time 0 and the apparent time to nadir, which was 7 days. In addition, monocyte counts were measured on the same time schedule for each patient. Due to limitations in the design of the clinical trial, we were unable to include all of the physiological components in the mechanism-based and myelosuppression-based models. Although these two models had a similar performance in describing the data in our study, they function differently to predict the PK and PD of PEGylated liposomal drugs. In the mechanism-based model, there is a bidirectional interaction where the PK drives PD and PD affects PK. In the myelosuppression-based model, PK drives PD but PD does not affect PK. Therefore, the mechanism-based model would be more appropriate than the myelosuppression-based model because the mechanism-based model would be able to predict a change in PK of PEGylated drug caused by a change in monocyte counts. Because monocytes play an important role in the clearance of PEGylated liposomes, the mechanism-based model would be a better model to predict the PK and PD of this class of drugs.Citation16
In conclusion, a mechanism-based PK–PD model was developed for encapsulated CKD-602 and monocyte counts in patients with advanced solid tumors. Comparison of this model and the myelosuppression-based model helped to explain the PK and PD of PEGylated liposomal anticancer agents, and the bidirectional interaction between PEGylated liposomal agents and the monocytes. The developed mechanism-based PK–PD model may be useful in predicting the PK and optimize dosing of PEGylated liposomal agents to achieve a target exposure for each patient with malignant diseases. This model could also be used to describe the bidirectional interaction between PK and monocytes for other nanoparticle and conjugated anticancer agents, as a method to profile and classify these agents. In the future, we will evaluate the bidirectional interaction between nonpegylated liposomal anticancer agents and monocytes, using the developed mechanism-based PK–PD model.
Acknowledgment
This work was supported by ALZA, Mountain View, CA and NIH/NCCR/GCRC grant 5M01 RR 00056.
Disclosure
The authors declare that there are no conflicts of interest in this work.
References
- ZamboniWCStrychorSJosephEPlasma, tumor, and tissue disposition of STEALTH liposomal CKD-602 (S-CKD602) and nonliposomal CKD-602 in mice bearing A375 human melanoma xenograftsClin Cancer Res200713237217722318056203
- ZamboniWCEisemanJLStrychorSTumor disposition of pegylated liposomal CKD-602 and the reticuloendothelial system in preclinical tumor modelsJ Liposome Res2011211708020528623
- ZamboniWCLiposomal, nanoparticle, and conjugated formulations of anticancer agentsClin Cancer Res200511238230823416322279
- CrulMCKD-602. Chong Kun DangCurr Opin Investig Drugs200341214551459
- LeeJHLeeJMLimKHPreclinical and phase I clinical studies with Ckd-602, a novel camptothecin derivativeAnn N Y Acad Sci200092232432511193913
- LeeDHKimSWSuhCBelotecan, new camptothecin analogue, is active in patients with small-cell lung cancer: results of a multicenter early phase II studyAnn Oncol200819112312717823384
- YuNYConwayCPenaRLChenJYSTEALTH liposomal CKD-602, a topoisomerase I inhibitor, improves the therapeutic index in human tumor xenograft modelsAnticancer Res2007274B2541254517695551
- ZamboniWCFriedlandDMRamalingamSFinal results of a phase I and pharmacokinetic study of STEALTH liposomal CKD-602 (S-CKD602) in patients with advanced solid tumorsJ Clin Oncol (Meeting Abstracts)200624Suppl 18S2013
- SlatterJGSchaafLJSamsJPPharmacokinetics, metabolism, and excretion of irinotecan (CPT-11) following I.V. infusion of [(14)C]CPT-11 in cancer patientsDrug Metab Dispos200028442343310725311
- ZamboniWCStewartCFThompsonJRelationship between topotecan systemic exposure and tumor response in human neuroblastoma xenograftsJ Natl Cancer Inst19989075055119539245
- StewartCFZamboniWCCromWRTopoisomerase I interactive drugs in children with cancerInvest New Drugs199614137478880392
- ZamboniWCConcept and clinical evaluation of carrier-mediated anticancer agentsOncologist200813324826018378535
- InnocentiFKroetzDLSchuetzEComprehensive pharmacogenetic analysis of irinotecan neutropenia and pharmacokineticsJ Clin Oncol200927162604261419349540
- AllenTMHansenCPharmacokinetics of stealth versus conventional liposomes: effect of doseBiochim Biophys Acta1991106821331411911826
- PapahadjopoulosDAllenTMGabizonASterically stabilized liposomes: improvements in pharmacokinetics and antitumor therapeutic efficacyProc Natl Acad Sci U S A1991882411460114641763060
- ZamboniWCMarucaLJStrychorSBidirectional pharmacodynamic interaction between pegylated liposomal CKD-602 (S-CKD602) and monocytes in patients with refractory solid tumorsJ Liposome Res201121215816520626314
- AllenTMCullisPRDrug delivery systems: entering the mainstreamScience200430356651818182215031496
- KondoMOshitaFKatoYYamadaKNomuraINodaKEarly monocytopenia after chemotherapy as a risk factor for neutropeniaAm J Clin Oncol199922110310510025393
- OshitaFYamadaKNomuraITanakaGIkeharaMNodaKProphylactic administration of granulocyte colony-stimulating factor when monocytopenia appears lessens neutropenia caused by chemotherapy for lung cancerAm J Clin Oncol200023327828210857893
- FribergLEFreijsASandströmMKarlssonMOSemiphysiological model for the time course of leukocytes after varying schedules of 5-fluorouracil in ratsJ Pharmacol Exp Ther2000295273474011046112
- FribergLEHenningssonAMaasHNguyenLKarlssonMOModel of chemotherapy-induced myelosuppression with parameter consistency across drugsJ Clin Oncol200220244713472112488418
- MinamiHSasakiYSaijoNIndirect-response model for the time course of leukopenia with anticancer drugsClin Pharmacol Ther19986455115219834043
- KrzyzanskiWJuskoWJMultiple-pool cell lifespan model of hematologic effects of anticancer agentsJ Pharmacokinet Pharmacodyn200229431133712518707
- WooSKrzyzanskiWJuskoWJPharmacodynamic model for chemotherapy-induced anemia in ratsCancer Chemother Pharmacol200862112313317891399
- KloftCWallinJHenningssonAChatelutEKarlssonMOPopulation pharmacokinetic-pharmacodynamic model for neutropenia with patient subgroup identification: comparison across anticancer drugsClin Cancer Res200612185481549017000683
- LégerFLoosWJBugatRMechanism-based models for topotecan-induced neutropeniaClin Pharmacol Ther200476656757815592328
- LatzJEKarlssonMORusthovenJJGhoshAJohnsonRDA semimechanistic-physiologic population pharmacokinetic/pharmacodynamic model for neutropenia following pemetrexed therapyCancer Chemother Pharmacol200657441242616322990
- FetterlyGJGraselaTHShermanJWPharmacokinetic/pharmacodynamic modeling and simulation of neutropenia during phase I development of liposome-entrapped paclitaxelClin Cancer Res200814185856586318794097
- van KesterenCZandvlietASKarlssonMOSemi-physiological model describing the hematological toxicity of the anti-cancer agent indisulamInvest New Drugs200523322523415868378
- ZamboniWCRamalingamSFriedlandDMPhase I and pharmacokinetic study of pegylated liposomal CKD-602 in patients with advanced malignanciesClin Cancer Res20091541466147219190127
- ZamboniWCStrychorSMarucaLPharmacokinetic study of pegylated liposomal CKD-602 (S-CKD602) in patients with advanced malignanciesClin Pharmacol Ther200986551952619675541
- McKenzieSBClinical Laboratory Hematology2nd edUpper Saddle River, NJPrentice Hall2010
- BonatePLPharmacokinetic-Pharmacodynamic Modeling and Simulation1st edNew York, NYSpringer Science and Business Media Inc2005
- SheinerLBBealSLEvaluation of methods for estimating population pharmacokinetics parameters. I. Michaelis-Menten model: routine clinical pharmacokinetic dataJ Pharmacokinet Biopharm1980865535717229908
- SheinerLBRosenbergBMaratheVVEstimation of population characteristics of pharmacokinetic parameters from routine clinical dataJ Pharmacokinet Biopharm197755445479925881
- HilgerRARichlyHGrubertMPharmacokinetics (PK) of a liposomal encapsulated fraction containing doxorubicin and of doxorubicin released from the liposomal capsule after intravenous infusion of Caelyx/DoxilInt J Clin Pharmacol Ther2005431258858916372528
- JainNCEssentials of Veterinary Hematology1st edHoboken, NJJohn Wiley and Sons1993
- WhitelawDMObservations on human monocyte kinetics after pulse labelingCell Tissue Kinet1972543113175044622
- KoningGAMorseltHWKampsJAScherphofGLUptake and intracellular processing of PEG-liposomes and PEG-immunoliposomes by kupffer cells in vitro 1*J Liposome Res2001112–319520919530933
- Van RooijenNSandersAKupffer cell depletion by liposome-delivered drugs: comparative activity of intracellular clodronate, propamidine, and ethylenediaminetetraacetic acidHepatology1996235123912438621159
- HaberEAferganEEpsteinHRoute of administration-dependent anti-inflammatory effect of liposomal alendronateJ Control Release2010148222623320813142