Abstract
Background
Graphene holds great promise for potential use in next-generation electronic and photonic devices due to its unique high carrier mobility, good optical transparency, large surface area, and biocompatibility. The aim of this study was to investigate the antibacterial effects of graphene oxide (GO) and reduced graphene oxide (rGO) in Pseudomonas aeruginosa. In this work, we used a novel reducing agent, betamercaptoethanol (BME), for synthesis of graphene to avoid the use of toxic materials. To uncover the impacts of GO and rGO on human health, the antibacterial activity of two types of graphene-based material toward a bacterial model P. aeruginosa was studied and compared.
Methods
The synthesized GO and rGO was characterized by ultraviolet-visible absorption spectroscopy, particle-size analyzer, X-ray diffraction, scanning electron microscopy and Raman spectroscopy. Further, to explain the antimicrobial activity of graphene oxide and reduced graphene oxide, we employed various assays, such as cell growth, cell viability, reactive oxygen species generation, and DNA fragmentation.
Results
Ultraviolet-visible spectra of the samples confirmed the transition of GO into graphene. Dynamic light-scattering analyses showed the average size among the two types of graphene materials. X-ray diffraction data validated the structure of graphene sheets, and high-resolution scanning electron microscopy was employed to investigate the morphologies of prepared graphene. Raman spectroscopy data indicated the removal of oxygen-containing functional groups from the surface of GO and the formation of graphene. The exposure of cells to GO and rGO induced the production of superoxide radical anion and loss of cell viability. Results suggest that the antibacterial activities are contributed to by loss of cell viability, induced oxidative stress, and DNA fragmentation.
Conclusion
The antibacterial activities of GO and rGO against P. aeruginosa were compared. The loss of P. aeruginosa viability increased in a dose- and time-dependent manner. Exposure to GO and rGO induced significant production of superoxide radical anion compared to control. GO and rGO showed dose-dependent antibacterial activity against P. aeruginosa cells through the generation of reactive oxygen species, leading to cell death, which was further confirmed through resulting nuclear fragmentation. The data presented here are novel in that they prove that GO and rGO are effective bactericidal agents against P. aeruginosa, which would be used as a future antibacterial agent.
Introduction
Nanotechnology involves the application of nano- or quantum-sized materials that possess unique properties in comparison to bulk materials of similar composition.Citation1 Environmental carbon-based nanotechnology is a promising area of research due to its potential applications in the fields of sensors, water treatment, and alternative energy.Citation2 These excellent properties may be relevant at the nanoscale if graphite can be exfoliated into thin nanoplatelets, and even down to the single graphene-sheet level.Citation3 Graphite nanoplatelets have often been made from expanded graphite, which basically is produced from graphite intercalation compounds via rapid evaporation of the intercalant at high temperatures.Citation3 Graphene is a single atomic plane of graphite (Gt)Citation4,Citation5 that was first obtained from the micromechanical exfoliation of Gt.Citation6 From the chemistry point of view, graphene oxide (GO) is a graphene sheet with carboxylic groups at its edges and phenol hydroxyl and epoxide groups on its basal plane.Citation7,Citation8 Accordingly, GO can be chemically exfoliated from GtO.Citation7 For production of reduced graphene oxide (rGO), thermal annealing or chemical treatment is needed to eliminate functional groups on GO.Citation9 These graphene-related materials exhibit unique electronic, thermal, and mechanical properties,Citation5,Citation10 and hold great promise in potential applications, such as nanoelectronics, conductive thin films, supercapacitors, nanosensors, and nanomedicine.Citation6,Citation11
In recent times, carbon nanotubes (CNTs) have been widely studied in the biomedical field for drug delivery, biosensing, and molecular imaging.Citation12–Citation14 Biomedical properties like pharmacokinetics, toxicity, and cytocompatibility of graphene and GO have not been systematically explored. Yang et alCitation15 have reported pharmacokinetics and biodistribution of graphene functionalized with polyethylene glycol (PEG) and examined its toxicity in mice. Their results revealed that graphene/PEG does not induce appreciable toxicity at an administered dose of 20 mg/kg for 3 months. PEGylated GO in a physiological solution has been employed in cell imaging and drug delivery.Citation16,Citation17 Wang et alCitation18 have suggested that dose- and time-dependent cytotoxicity of GO, which can enter the cytoplasm and nucleus, decreases cell adhesion and induces apoptosis. Recently, Akhavan et alCitation19 reported the biomedical application of biocompatible glucose-reduced GO in photothermal cancer therapy (without any PEGylation). In addition, other research groups have investigated the application of nanoscale reduced GO–quantum dot nanocomposites in magnetically targeted drug delivery, photothermal therapy, and fluorescence, photoacoustic, and magnetic resonance imaging.Citation20–Citation22
Several reports on graphene-related materials are currently available in comparison to other synthetic carbon nanomaterials, such as fullerenes and CNTs.Citation23–Citation27 There are some interesting studies explaining the possible mechanisms of graphene-sheet cytotoxicity, eg, the interaction of graphene-sheet sharp edges with the cell wall.Citation25 Accordingly, the potential and toxic effects of graphene-related materials should be thoroughly evaluated. Recently, there have been some reports describing the strong antibacterial activity of GO.Citation24,Citation25 This potent antibacterial has been attributed to membrane stress induced by sharp edges of graphene nanosheets, which may result in physical damage to cell membranes, leading to the loss of bacterial membrane integrity and the leakage of RNA.Citation25 Several studies have reported that most carbon-based nanomaterials are cytotoxic to bacteriaCitation28–Citation30 in a dose-dependent manner.Citation15,Citation26 Specifically, single-walled CNTs (SWNTs) show the strongest antimicrobial activity.Citation31–Citation34 Liao et alCitation35 reported a concentration-dependent toxicity of GO and graphene in human erythrocytes and skin fibroblasts. Involvement of the reactive oxygen species (ROS) generated by graphene was proposed as one of the main mechanisms for the cytotoxicity of graphene at high concentrations (100 mg/mL) in neural pheochromocytoma-derived PC12,Citation36 and the size of GO sheets has an effect on the toxicity of GO of high concentration, ie, larger sheets have better biocompatibility in A549 cells.Citation37 The direct-contact interaction of extremely sharp edges of graphene nanowalls with the membrane of cells is also known as one of the mechanisms effectively involved in the cytotoxicity of graphene sheets.Citation38 Trapping microorganisms within aggregate-reduced graphene sheets was also suggested as another mechanism for describing the cytotoxicity of graphene sheets, especially in a suspension.Citation38 The size-dependent cyto- and genotoxic effects of graphene sheets and nanoplates have been evaluated in human mesenchymal stem cells.Citation39
Taking this literature into account, we investigated the antibacterial activity of graphene materials in Pseudomonas aeruginosa, which is a common Gram-negative bacterium that can cause disease in humans and animals. Herein, a systematic study was carried out on the antibacterial activity of graphene materials against P. aeruginosa, using cell-growth and viability assays in both saline and rich media. Further, our results suggest that the mechanism of antibacterial activity of GO and rGO depends on oxidative stress, ROS generation, and DNA fragmentation.
Materials and methods
Materials
P. aeruginosa (GS1), a strain obtained from the GS Center for Life Sciences, Coimbatore, India, was characterized based on 16s rRNA technique, and the sequence has been submitted to GenBank with the accession number JQ968459. Gt powder was purchased from Sigma-Aldrich (St Louis, MO). Analytical-grade betamercaptoethanol (BME), NaOH, KMnO4, anhydrous ethanol, 98% H2SO4, 36% HCl, and 30% H2O2 aqueous solution were also purchased from Sigma-Aldrich and used directly without further purification. All aqueous solutions were prepared with deionized water. All other chemicals were purchased from Sigma-Aldrich unless stated otherwise.
Preparation of Gt
Gt was prepared as described earlier.Citation32,Citation40,Citation41 Briefly, Gt dispersion was obtained by sonication of Gt powders (synthetic, <20 μm) in deionized water using a sonicator for 1 hour.
Preparation of GtO
Preparation of GtO was carried out as described earlier. Citation42 Eight grams of K2S2O8, 8 g of P2O5, and 24 mL of 98% H2SO4 were mixed in a 200 mL beaker and then heated to 80°C in a water bath. One gram of Gt powder (synthetic, <20 μm) was added to the mixture and kept at 80°C for 6 hours. Then the mixture was diluted using distilled water and filtered through 0.20 μm nylon membrane, followed by thorough washing with water and drying. Afterwards, the as-treated dry Gt powder was added to 368 mL of H2SO4 in an ice bath. Sixty grams of KMnO4 were added slowly with stirring. The mixture was heated to 40°C under vigorous stirring and kept for 1 hour. Next, 736 mL of water was slowly added; 15 minutes later, 2240 mL of water and 40 mL H2O2 were added. Finally, GtO powder was suspended in distilled water, and metal ions and acids were removed by dialysis.
GO synthesis
GO was prepared from Gt powder using a modified method of Hummers and Offeman.Citation40–Citation43 Gt powder (2 g) was mixed with 80 mL H2SO4 and 20 mL HNO3 in an ice bath. KMnO4 (12 g) was slowly added to the mixture. The solution was heated at 35°C for 30 minutes, and then diluted with 160 mL of 18 MΩ water. In 1 hour, the solution was further diluted by adding 400 mL of 18 MΩ water, followed by the slow addition of 12.0 mL of H2O2 (30% v/v). After these steps, the black Gt suspension was converted into a bright-yellow GtO solution. The precipitate of GO was isolated by centrifugation at 3000 rpm/minute for 15 minutes and washed with and then re-suspended in 18-MΩ water. The aqueous GO solution was then sonicated for 2 hours to facilitate the exfoliation of stacked GtO sheets into monolayer or multilayered GO sheets. The as-prepared GO yellow-brown solution (mg/mL) was used for further experiments.
Reduction of GO
The reduction of GO was performed as described earlier,Citation40 with modification. Reduced GO was obtained from the reaction of BME with GO. Typically, the final concentration of 10 mM of BME was dissolved in 20 mL GO aqueous suspension (0.1 mg/mL), and then the mixture was kept in a tightly sealed glass bottle and stirred at 60°C for 2 hours. Firstly, the black product was isolated by centrifugation at 5000 rpm/minute for 10 minutes, and then 200 μL of 10 N NaOH aqueous solution was added into the product to dissolve black precipitate. Then the solution was centrifuged at 10,000 rpm/minute, and the obtained black slurry was washed with adequate deionized water and ethanol up to pH = 7.0. Finally, one part of the as-prepared product was dissolved in water to prepare the suspension of BME-rGO, and suspended rGO was used for further analysis.
Characterization
Ultraviolet-visible (UV-Vis) spectra were obtained using a WPA Biowave II (Biochrom Cambridge, UK). The aqueous suspension of GO and rGO was used as the UV-vis sample, and the deionized water was used as the reference. The particle size of dispersions was measured by a Zetasizer Nano ZS90 (Malvern Instruments, Malvern, UK). A refractive index (n = 1.3) matching bath of filtered (0.2 μm) surrounded the scattering cell, and the temperature was fixed at 25°C. X-ray diffraction (XRD) analyses were carried out on an X-ray diffractometer (Bruker D8 Discover; Bruker, Karlsruhe, Germany). The high-resolution XRD patterns were measured at 3 Kw with Cu target using a scintillation counter (λ = 1.5406°A) at 40 kV and 40 mA and recorded in the range of 2ϑ = 5°–80°. A JSM-6700F semi-in-lens field-emission scanning electron microscope (JEOL, Tokyo, Japan) operating at 10 kV was used to acquire scanning electron microscopy (SEM) images. The solid samples were transferred to a carbon tape and held in an SEM sample holder for analyses. The analyses of the samples were carried out at an average working distance of 6 mm. Raman spectra of GO and rGO were measured by an Alpha300 (WITec, Ulm, Germany) with a 532 nm laser and 100× objective lens mounted on an Olympus (Tokyo, Japan) optical microscope. The calibration was initially made using an internal silicon reference at 500 cm−1 and gave a peak-position resolution of less than 1 cm−1. The spectra were measured from 500 to 4500 cm−1. All samples were deposited on glass slides in powder form without using any solvent.
Media and bacterial growth analysis
Briefly, P. aeruginosa cultures were first grown aerobically at 37°C in Luria-Bertani (LB) broth containing tryptone 10 g, yeast extract 5 g, and NaCl 10 g/L. The cells were harvested by centrifugation, then washed twice with phosphate- buffered saline (PBS; pH 7.3) and resuspended in the appropriate fresh medium, such as the LB or saline, to bring the desired initial optical density. Inoculated cultures were grown in a shaker (120 rpm) in 50 mL tubes (medium volume/tube volume – 1/10) at 37°C until they reached the stationary phase. Growth was monitored spectrophotometrically by periodic measuring of the absorbance at 600 nm. The bacteria were routinely maintained on LB agar slants and preserved in glycerol stock solutions at −70°C. Unless otherwise stated, three independent runs were made for all experiments.
Turbidity assay
Bacterial growth was measured as turbidity at OD600 using the WPA Biowave II. The P. aeruginosa was treated with Gt, GtO, GO, and rGO in LB medium. The untreated sample was used as a control. The treated and untreated samples were measured at a single wavelength, 600 nm, at 3-hour intervals. After the incubation of cells with graphene materials, cells were spun down at 5000 rpm for 10 minutes and the supernatant (soluble graphene materials) removed and pellet (bacterial cells) redissolved in PBS. Three independent runs were made for all experiments.
Cell preparation
P. aeruginosa was grown in Luria-Bertani (LB) medium at 37°C and harvested in the midexponential growth phase. Cultures were centrifuged at 5000 rpm/minute for 10 minutes to pellet cells. Then cells were washed three times with isotonic saline solution to remove residual macromolecules and other growth-medium constituents. Then the pellets were resuspended in isotonic saline solution. Bacterial cell suspensions were diluted up to the desired concentration of 106 colony forming units/mL.
Cell-viability test
Bacterial growth after treatment was measured by quantifying cell viability after incubation with two different graphene materials. P. aeruginosa cells were incubated with fresh GO and rGO from 0, 25, 50, 75, 100, 125, and 150 μg/mL in isotonic saline solutions at 37°C under 200 rpm shaking speed for 2 hours. After the treatment, 100 μL of reaction mixture was made up to 1 mL, and then from 1 mL, 50 μL was taken for plating. Loss of viability was evaluated by the colony-counting method. Briefly, a series of 20-fold cell dilutions (100 μL each) were spread onto LB plates and left to grow overnight at 37°C. Colonies were counted and compared with those on control plates to calculate changes in cell-growth inhibition. For control, we used isotonic saline solution without graphene-based materials. All treatments were prepared in triplicate and repeated at least in three independent experiments.
Measurement of ROS generation
ROS generation was determined using nitro blue tetrazolium (NBT) reduction assay, as described previously,Citation44 with minor modifications. Briefly, ROS generation was determined in extracts from bacterial cells grown in liquid cultures. Bacteria (0.1 mL) suspension (OD600 1.0) in Hanks’ buffered salt solution was incubated with 0.1 mL of GO and rGO (100 μg/mL) for 2 hours and 0.5 mL of 1 mg/mL NBT for 30 minutes at 37°C. Then 0.1 mL of 0.1 M HCl was added and the tubes were centrifuged at 1500 g for 10 minutes. The blue color of the supernatants was measured at 560 nm (ROS extracellular). The separated pellets were treated with 0.6 mL dimethyl sulfoxide to extract the reduced NBT. Finally, 0.8 mL Hanks’ buffered salt solution was added, and the optical density was determined at 560 nm (ROS intracellular). Cells were pretreated with N-acetylcysteine (NAC) and reduced glutathione (GSH) to a final concentration of 1 mM. Positive control for ROS generation was obtained by the addition of H2O2 to a final concentration of 3 mM.
DNA fragmentation
P. aeruginosa cells were grown in LB medium, washed with PBS buffer, and resuspended in PBS at a concentration of 2 × 10⁸ viable cells. The cells were incubated with 100 μg/mL of GO, rGO, and silver nanoparticles (NPs) for 24 hours. Then the cells were lysed in 250 μL cell lysis buffer containing 50 mM Tris-HCl, pH 8.0, 10 mM ethylenediaminetetraacetic acid, 0.1 M NaCl, and 0.5% SDS. The lysate was incubated with 0.5 mg/mL RNase A at 37°C for 1 hour, and then with 0.2 mg/mL proteinase K at 50°C overnight. Phenol extraction of this mixture was performed, and DNA in the aqueous phase was precipitated by 25 mL (1/10 vol) of 7.5 M ammonium acetate and 250 mL (1/1 vol) isopropanol. DNA electrophoresis was performed in 1% agarose gel containing 1 mg/mL ethidium bromide at 70 V, and the DNA fragments were visualized by exposing the gel to UV light, followed by photography.
Results and discussion
Characterization of GO and rGO by UV-Vis spectroscopy
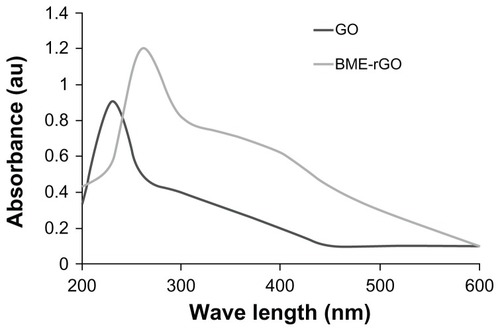
shows Gt, GtO, GO, and rGO produced by the modified method of Hummers and Offeman,Citation40 and shows the dispersion of Gt, GtO, GO, and rGO at a concentration of 600 μg/mL. The GO dispersion was obtained by the oxidation of GtO, and it is opaque yellow in color (); the resulting solution is clear and is a homogeneous yellow-brown GO dispersion. The obtained GO and rGO are appearing differently because of their distinct structural and physicochemical properties.Citation3,Citation32 The change of color from brown to dark indicates a reduction of GO. The aqueous dispersions of GO and the resulting rGO reveal a distinct color change from pale-yellow to black after chemical reduction. Such observations provide evidence to support the formation of rGO.Citation45,Citation46 The changing of color is due to the large amount of hydrophilic functional groups, such as carboxyl, hydroxyl, and epoxy groups, on GO nanosheets.Citation3,Citation32 After the visibility check, the reduction of GO was determined by UV-Vis spectroscopy. As shown in , a UV-Vis spectrum shows that pure GO shows two absorption peaks: one at <230 nm, presumably due to the π → π* transition of the C–C bonds, and another shoulder at <300 nm corresponds to the n → π* transition of the C=O bonds.Citation45–Citation47 While reducing by BME, the plasma peak gradually red-shifts to 260 nm, suggesting that GO is reduced and the electronic conjugation within graphene sheets is restored upon BME reduction, reflecting increased π-electron concentration and structural ordering, which is consistent with the restoration of sp2 carbon and possible rearrangement of atoms.Citation48,Citation49 Similar features and trends were observed for the reduction of GO with l-ascorbic acidCitation26,Citation50 and l-cysteine.Citation26,Citation42 In addition, UV-Vis spectra analysis shows a shoulder at 400 nm in rGO, which suggests an emission peak due to BME.
Figure 1 (A–D) Digital photograph of Gt, GtO, GO, and rGO at a concentration of 600 μg/mL. Gt, GtO, GO, and rGO were prepared as described in the Materials and methods section. Gt dispersion was obtained after sonication for 1 hour (A). The GtO dispersion was obtained by the oxidation of Gt, and it is opaque yellow in color (B). GO nanosheets were exfoliated from the GtO, resulting in the clearest and homogeneous yellow-brown GO dispersion (C). rGO was obtained from the reaction of BME with graphene oxide, resulting in the homogeneous dark color (D).
Abbreviations: Gt, graphite; GtO, graphite oxide; GO, graphene oxide; rGO, reduced graphene oxide; BME, betamercaptoethanol.
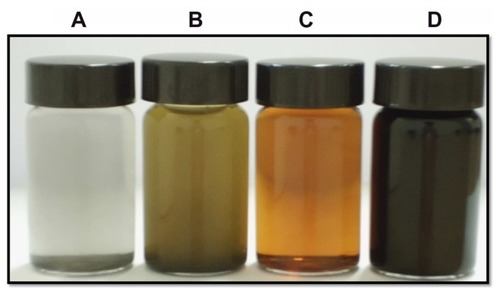
Figure 2 Ultraviolet-visible (UV-Vis) spectra of GO and rGO showing the restoration of electronic conjugation in the rGO.
Notes: The reduction was measured by UV-Vis spectroscopy at ambient temperature by using a UV-Vis spectrophotometer. GO shows two absorption peaks: one at ~230 nm and another shoulder at ~300 nm. After reduction by BME, the peak at 230 nm shifted to 260 nm.
Abbreviations: GO, graphene oxide; rGO, reduced graphene oxide; BME, betamercaptoethanol.
XRD analysis
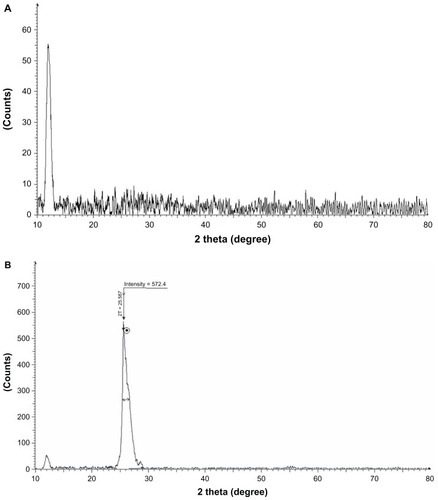
The distance between two layers is an important parameter to evaluate the structural information of the graphene. Citation42 The XRD patterns of GO and rGO reduced by BME are compared and shown in . Due to the presence of oxygen-containing functional groups attached on both sides of the graphene sheet and the atomic-scale roughness arising from structural defects (sp3 bonding) generated on the originally atomically flat graphene sheet,Citation3 the d-spacing of the GO () is about 0.76 nm (2ϑ ≈ 11.7°), after reduction of GO by BME, and the (002) peak of GO gradually disappears, whereas the broad diffraction peak was observed from 24° to 29° (d ≈ 0.35 nm). This shift in the interlayer spacing can be attributed to the reduction of the GO, where the reduction makes the rGO pack tighter than the GO ().Citation7 Though there is a decrease in the interlayer spacing compared with GO, the basal spacing of rGO is higher than that of well-ordered Gt (single-layer pristine graphene). The higher basal spacing may be due to the presence of residual oxygen functional groups, indicating incomplete reduction of GO. The fact that (002) reflection in these samples is very broad suggests that the samples are very poorly ordered along the stacking direction. It indicates that these samples comprise largely free rGO nanosheets.Citation51 Similarly, Shen et alCitation52 observed after reduction a gradual change in the patterns to finally accomplish a randomly ordered carbonaceous layered solid, with basal spacing of 0.34 nm instead of 0.78 nm for the parent GO, indicating that the bulk of the oxygen-containing functional groups is removed from GO. GO has a large interlayer distance due to the formation of hydroxyl, epoxy, and carboxyl groups. After reduction, the interlayer distance decreases due to the removal of some oxygen-containing functional groups. This suggests the conjugated graphene network (sp2 carbon) is reestablished during the reduction process, which is associated with the ring-opening of the epoxides. The changes of structure during the reduction process are also reflected in the Raman spectra of GO and rGO.
Figure 3 (A and B) X-ray diffraction (XRD) pattern of GO and rGO. In the XRD pattern of GO, the strong and sharp peak at 2θ = 11.7° corresponds to an interlayer distance of 7.6 Å (d002) (A). rGO shows two peaks: one small peak centered at 2θ = 11.7° and another broad peak at 2θ = 25.8°, corresponding to interlayer distances of 4.47 and 3.53 Å, respectively (B).
Note: These XRD results are related to the exfoliation and reduction processes of GO and the processes of removing intercalated water molecules and the oxide groups.
Abbreviations: GO, graphene oxide; rGO, reduced graphene oxide.
Particle-size distribution
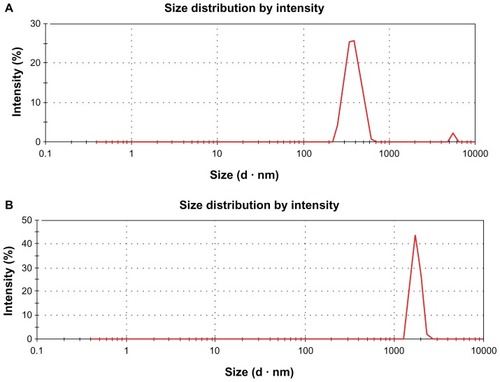
Furthermore, we characterized the aqueous dispersions of GO and rGO by using DLS at the scattering angle θ = 90°. The standard spherical particle models were used in DLS. The size of GO () and rGO () were 0.525 μm and 3.40 μm respectively. Our results are similar to the results obtained by Liu et alCitation32 regarding the size of GO and rGO. As described earlier, because most graphene-based materials are not spherical particles, the model-derived diameters are not their real sizes. DLS results only show the size differences between the two materials.
Figure 4 (A and B) Dynamic light-scattering (DLS) spectra of GO and rGO dispersions. At least 200 particles were measured for each sample to obtain the size distribution. The GO (A) and rGO (B) sizes were measured by a Zetasizer Nano ZS90 with a scattering angle θ = 90°.
Notes: The standard spherical particle models were used in DLS. DLS results provide a quick indication of their different solubility.
Abbreviations: GO, graphene oxide; rGO, reduced graphene oxide.
SEM analysis
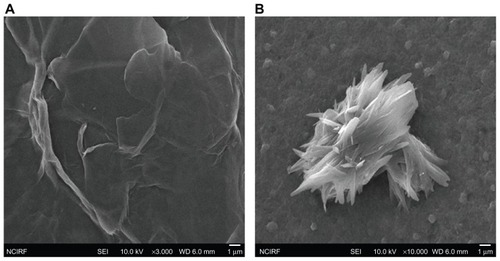
The dispersions were further dropped on aluminum foil, and dozens of SEM images were taken randomly for each sample. SEM images of GO () sheets are smooth with small wrinkles and folded at the edges, and SEM images of reduced GO revealed that the material consists of stacked and aggregated, thin, crumpled sheets closely associated with each other and forming a disordered solid () which also look rigid, with transparent plates and silk sheets.
Figure 5 (A and B) Scanning electron microscopy images of GO and rGO. 0.1 mg/mL of GO and rGO was dispersed in aluminum foil and dried, and then images were taken using scanning electron microscopy. GO sheets are smooth with small wrinkles and folded at the edges (A), and reduced GO material consists of stacked and aggregated, thin, crumpled sheets (B).
Abbreviations: GO, graphene oxide; rGO, reduced graphene oxide.
Raman spectral analysis
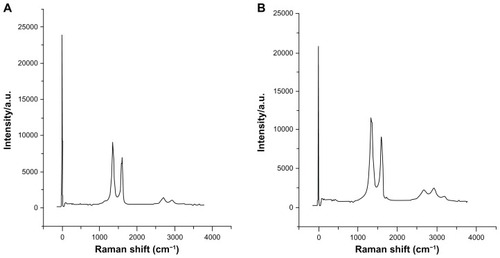
Raman spectroscopy is considered to be a popular technique for characterization of the structural and electronic properties of graphene, including disorder and defect structures, defect density, and doping levels.Citation53 Raman spectroscopy is highly sensitive to electronic structure, and has proven to be an essential tool for the characterization of carbon-based materials, especially C=C double bonds that lead to high Raman intensities.Citation54 Raman spectroscopy of graphene is generally characterized by two main features: the G-peak, which arises from first-order scattering of the E2g phonon from sp2 carbon atoms (generally observed at 1575 cm−1); and the D-peak (1355 cm−1), which arises from breathing mode of κ-point photons of A1g symmetry. Our results show that the G-band and D-band of GO appear at 1595 cm−1 and 1347 cm−1, respectively (). The Raman spectrum of GO, as expected, displays a prominent G (the E2g mode of sp2 carbon atoms) peak as the characteristic feature at 1595 cm−1. The Raman spectra further support the structural change before and after the reduction of GO by BME. In the Raman spectrum of GO after the reduction by BME, the D-band was broadened and shifted to around 1342 cm−1 and the G-band shifted to 1603 cm−1 (). The D-band at 1342 cm−1 of BME became prominent, indicating the reduction in size of the in-plane sp2 domains due to the extensive oxidation with BME. Interestingly, the Raman spectrum of GO after reduction by BME shows a higher D/G intensity ratio than GO. Compared to pure GO, the D/G ratio of the BME-reduced GO increased significantly (1.9), indicating the introduction of sp3 defects after functionalization and incomplete recovery of the structure of graphene.Citation55 The variation of relative intensities of the G-band and D-band in the Raman spectra of the GO during the reduction usually reveals the change of the electronic conjugation state. This change indicates an increase in the number of sp2 domains after reduction of GO.Citation49 This observation is in good agreement with previous findings,Citation42 which revealed that sulfur containing amino acid, namely l-cysteine, used as reducing agent from GO to rGO nanosheets. Additionally, another study developed a green and a facile approach to synthesis of graphene nanosheets using reducing sugars.Citation53
Figure 6 (A and B) Raman spectra of GO and rGO. The G-band and D-band of GO appear at 1595 cm−1 and 1347 cm−1, respectively (A). In the Raman spectrum of GO after the reduction by BME, (B) the D-band is broadened and shifted to around 1342 cm−1 and G band shifted to 1603 cm−1.
Note: rGO after reduction by BME shows a higher D/G intensity ratio than GO.
Abbreviations: GO, graphene oxide; rGO, reduced graphene oxide; BME, betamercaptoethanol.
Effect of Gt, GtO, GO, and rGO on bacterial growth
Regarding graphene materials, there have been lots of contradictory reports about biocompatibility and antimicrobial activity. Recently, Ruiz et alCitation56 showed that bacteria grew faster and to a higher optical density when GO was added to a bacterial culture at 25 μg/mL than cultures without GO, and also they explained bacterial growth on filters coated with 25 and 75 μg of GO grew two and three times better than on filters without GO. Liu et alCitation32 observed strong antibacterial activity of four types of graphene-based materials (Gt, GtO, GO, and rGO). In addition, Hu et alCitation24 employed a classic colony-counting method to measure the microbial viability of Escherichia coli treated with 85 μg/mL GO for 2 hours, and GO almost completely suppressed the growth of E. coli, leading to a significant loss of viability. In order to scrutinize efficient graphene materials for antibacterial activity in the presence of media components, we performed a systematic study with Gt, GtO, GO, and rGO in LB medium (rich medium) and LB medium without graphene material used as control.
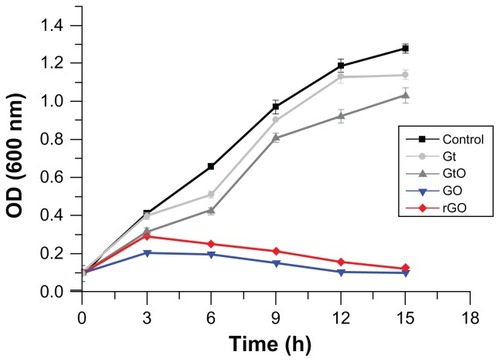
First, we evaluated the growth curve of P. aeruginosa under aerobic conditions in LB medium with and without Gt, GtO, GO, and rGO (75 μg/mL) for 15 hours. As a result, P. aeruginosa control strains displayed identical exponential growth trends. In the early period of growth, Gt- and GtO-treated P. aeruginosa displayed a similar trend; however this started to decline in the late exponential phase. GO and rGO had a negative effect on bacterial growth, as the turbidity measurements decreased steadily over a 6-hour period. Interestingly, there was significant growth inhibition up to 92% after 15 hours’ exposure to GO and rGO. As shown in , GO and rGO had a significant effect on bacterial growth when compared to the control. The growth of P. aeruginosa decreased after treatment with GO and rGO. However, the rate of antibacterial activity of GO was higher than rGO. Our results concluded that Gt and GtO show lower antibacterial activity in comparison to GO and rGO. Therefore, our further experiments focused on only two graphene materials: GO and rGO.
Figure 7 Effect of various graphene materials (Gt, GtO, GO, and rGO) on growth of Pseudomonas aeruginosa.
Notes: Cells were incubated with Gt, GtO, GO, and rGO (75 μg/mL) separately. Samples were withdrawn at different time points of growth, and cells were centrifuged, washed with distilled water, and analyzed for growth at 600 nm. Data are averages from triplicate experiments. Error bars represent standard deviations of triplicate incubations. The results represent the means of three separate experiments, and error bars represent the standard error of the mean. Treated groups showed statistically significant differences from the control group by Student’s t-test (P < 0.05).
Abbreviations: Gt, graphite; GtO, graphite oxide; GO, graphene oxide; rGO, reduced graphene oxide.
Concentration-dependent antibacterial activity of GO and rGO
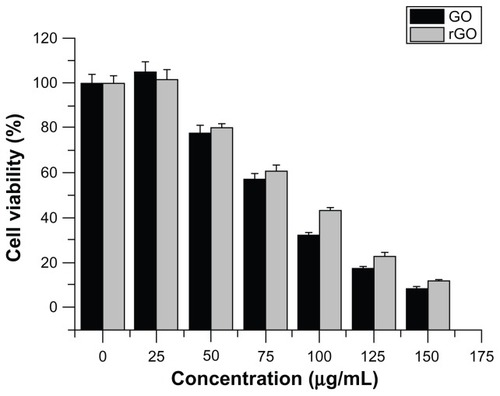
The concentration dependence of antibacterial activities on graphene-based materials were studied. GO or rGO dispersions at different concentrations (0, 25, 50, 75, 100, 125, 150, 175, and 200 μg/mL) were incubated with P. aeruginosa cells for 2 hours at 37°C. As shown in , the loss of P. aeruginosa viability progressively goes up with increases of GO or rGO concentration. When the cells were exposed to GO and rGO, significant loss of viability was observed at concentrations of 75 and 100 μg/mL, respectively. However, maximum loss of P. aeruginosa viability was detected after incubation with 150 μg/mL of GO and rGO. In both graphene materials, there was no colony observed over concentrations of 175 μg/mL. These results suggest that antibacterial activities of graphene-based materials are also concentration- and material-dependent. As suggested earlier, regarding the GO antibacterial mechanism, cellular damage of P. aeruginosa might arise from the effects of either oxidative stress or physical disruption that have been observed in the cellular effects of related carbon nanomaterial CNTs and fullerene. Citation24 Recently, Liu et alCitation32 demonstrated that most E. coli cells become flattened and lose their cellular integrity after exposure to GO or rGO dispersions. This highlights that irreversible damage can be induced in bacterial cells after direct contact with graphene-based materials. Our results further agree with previous findings by other research teams,Citation24,Citation25,Citation32 where it was proven that graphene materials exert the same effect on Gram-negative bacteria.
Figure 8 Effect of concentration-dependent GO and rGO in Pseudomonas aeruginosa cell viability.
Notes: Cells were incubated at 37°C with various concentrations of GO and rGO separately for 2 hours at 200 rpm shaking speed. Cell-viability rates were determined by the colony-counting method and expressed as a percentage of control. The results represent the means of three separate experiments, and error bars represent the standard error of the mean. Treated groups showed statistically significant differences from the control group by Student’s t-test (P < 0.05).
Abbreviations: GO, graphene oxide; rGO, reduced graphene oxide.
Time-dependent antibacterial activity of GO and rGO
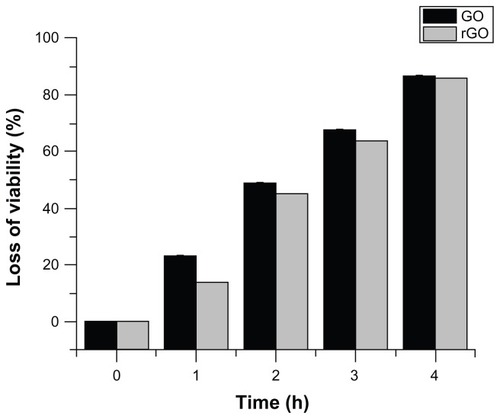
We examined the time-dependent antibacterial efficiency of GO and rGO. GO and rGO dispersions (75 μg/mL) were incubated with P. aeruginosa with equal concentration of cell biomass. The loss of P. aeruginosa viability was counted at different time points: 1, 2, 3, and 4 hours (). The loss of P. aeruginosa viability increased after 1-hour incubation with GO and rGO from 0% to 23% and 14%, respectively. By increasing the incubation time, the loss of viability increased to 49% and 40% for 2-hour incubation. Finally, after 4-hour incubation, the loss of P. aeruginosa viability was 87% and 86% treated with GO and rGO, respectively. The division of cell death occurred in all 4 hours of incubation; however, a large fraction of cell death occurred in the earlier hour of incubation. Our results revealed that comparing GO and rGO dispersions, GO dispersions have much higher antibacterial activity than rGO dispersions at all tested incubation intervals.
Figure 9 Time-dependent antibacterial activities of GO and rGO.
Notes:Pseudomonas aeruginosa (106–107 colony forming units/mL) cells were treated with GO or rGO (100 μg/mL) at 37°C for 4 hours at 200 rpm shaking speed. Cell-viability rates were determined by the colony-counting method and expressed as a percentage of control. The results represent the means of three separate experiments, and error bars represent the standard error of the mean. Treated groups showed statistically significant differences from the control group by Student’s t-test (P < 0.05).
Abbreviations: GO, graphene oxide; rGO, reduced graphene oxide.
Oxidative stress induced by GO and rGO
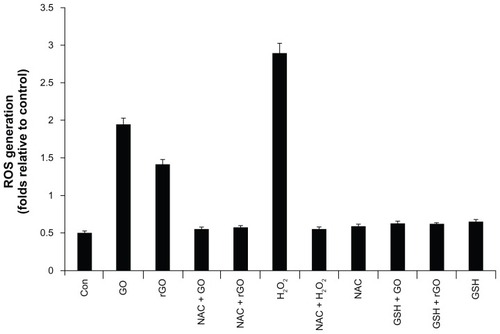
Oxidative stress is a highly recognized mechanism of various NPs. A systematic study was performed to evaluate the toxicity/biocompatibility of GO to A549 cells, a widely used model cell line for toxicity studies.Citation37 Recent studies have indicated that GO is highly biocompatible; however, some studies reported that GO has a higher toxicity to cells and animals at high concentrations,Citation24,Citation57,Citation58 and found that GO is toxic to human fibroblast cells at concentrations of 50 μg/mL and higher, which is due to the structural and physiochemical properties of carbon nanomaterials such as fullerene, which induce oxidative stress as a key antibacterial mechanism,Citation29 and CNTs.Citation59,Citation60 Liu et alCitation32 concluded that based on XTT (sodium 2,3,-bis[2-methoxy-4-nitro-5-sulfophenyl]-5-[phenylamino-carbonyl]-2H tetrazolium inner salt) results, graphene-based materials mediate a little superoxide anion production and a trace amount of ROS may be produced; this plays a minor role in the antibacterial activity of graphene-based materials. To investigate ROS production as one of the key factors for cell death, we measured ROS levels using NBT assay. The levels of ROS in GO and rGO treated cells were 3.8-fold and 2.7-fold higher, respectively, compared to the level of ROS in control cells throughout the experiment (). Since H2O2 induced ROS, it was employed as a positive control. H2O2 led to a 5.6-fold increase in ROS levels compared to the level of ROS in the control. Reduced GSH is an important molecule for protecting cells from toxic compounds, and intracellular GSH levels can be increased by the antioxidant compound NAC. Thus, we tested if pre-incubation of cells with GSH or NAC could prevent ROS generation by GO and rGO, and found that these intracellular antioxidants protected P. aeruginosa from GO and rGO () and reduced the levels of ROS in GO- and rGO-treated cells. Taken together, all these results indicate that cell death is mediated by ROS production, which might alter the cellular redox status. Akhavan and GhaderiCitation25 suggested that the higher bacterial toxicity of the reduced nanowalls was attributed to more sharpening of the edges of the nanowalls, providing stronger contact interaction with the cell membrane and/or better charge transfer between the bacteria and the reduced nanowalls, resulting in more cell membrane damage of the bacteria.
Figure 10 Effect of GO and rGO on ROS generation in Pseudomonas aeruginosa.
Notes: ROS generation was measured by nitro blue tetrazolium (NBT) assay. Cells were treated separately with GO and rGO (100 μg/mL) for 2 hours. Cells were pretreated with NAC and GSH to a final concentration of 1 mM. NBT reduction was stopped by adding acetic acid to the incubation medium. Reduced NBT was dissolved in dimethyl sulfoxide, and the absorbance was determined at 560 nm. The results represent the means of three separate experiments, and error bars represent the standard error of the mean. Treated groups showed statistically significant differences from the control group by Student’s t-test (P < 0.05). Positive control for ROS generation was obtained by the addition of H2O2 to a final concentration of 3 mM.
Abbreviations: GO, graphene oxide; rGO, reduced graphene oxide; ROS, reactive oxygen species; NBT, nitro blue tetrazolium; NAC, N-acetylcysteine; GSH, glutathione.
DNA fragmentation
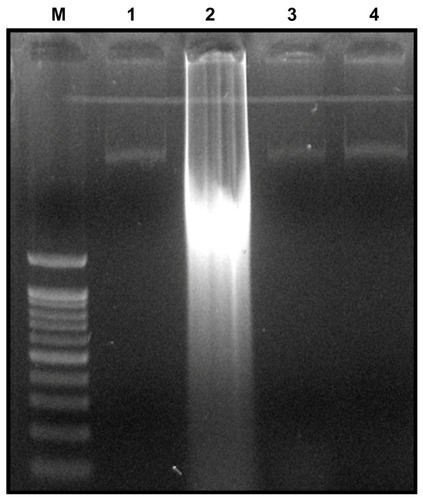
To elucidate the mechanism of cell death induced by GO and rGO, we chose DNA fragmentation assay, which is a good indicator of cellular dysfunction. Oxidative stress and ROS generation were revealed to be some of the key mechanisms in cellular defense after particle uptake. Intracellular oxidative stress could be hastened by NPs by disturbing the equilibrium between the oxidant and antioxidant processes. Citation59,Citation60 ROS typically include the superoxide radical (O2−), hydrogen peroxide (H2O2), and hydroxyl radical (OH), which cause damage to cellular components, including DNA and proteins.Citation61,Citation62 ROS generation is also an important factor in the apoptosis process, and the excess generation of ROS induces mitochondrial membrane permeability and damages the respiratory chain to trigger the apoptotic process.Citation63,Citation64 Specific DNA smearing is a characteristic feature of cell death. In order to examine whether ROS generation by graphene materials leads to DNA damage in P. aeruginosa, DNA was extracted from P. aeruginosa cells treated with 100 μg/mL GO and rGO for 24 hours and analyzed for the occurrence of DNA fragmentation. The results show that the cells treated with GO for 24 hours show laddering of DNA, but rGO and silver NPs did not show significant fragmentation (), which suggests that cells require longer time exposure of rGO to generate DNA fragmentation or that the mechanism of cell death caused by rGO could be different from GO. Recently, Akhavan et alCitation65 demonstrated that the reduced GO nanoplatelets-PEG exhibited concentration-dependent cyto- and genotoxicity (resulting in >72% cell destruction and >29% DNA fragmentation after 24 hours in the dark) in human glioblastoma cell line U87MG. The potential effect of GO on DNA fragmentation is due to irreversible damages that can be induced in bacterial cells after direct contact with GO. Liu et alCitation32 demonstrated that most E. coli cells were individually wrapped with thin layers of GO nanosheets. In contrast, E. coli cells were usually embedded in large rGO aggregates. The different behavior of GO and rGO suggests the aggregation/dispersion of graphene-based materials may play an important role in their antibacterial activities.Citation32 Akhavan and GhaderiCitation25 suggest that that the direct-contact interaction of the bacteria with the very sharp edge of the nanowalls resulted in more damage to the cell membrane of the Gram-positive Staphylococcus aureus bacteria lacking the outer membrane compared to the Gram-negative E. coli ones owning the outer membrane. From our results, we concluded that the antibacterial activity of GO and rGO not only depends on density of functional groups, size, conductivity, and the amount of cells deposited on graphene-based materials but also membrane oxidative stress caused by direct contact with sharp nanosheets, and the generation of ROS and DNA fragmentation consequently leads to cell death. Further studies are required to address which factors are playing an important role in the antibacterial activity of GO and rGO.
Figure 11 Detection of GO and rGO induced apoptosis by cellular DNA fragmentation.
Notes: For DNA fragmentation, cells were incubated with GO and rGO (100 μg/mL) for 24 hours. After incubation, DNA extracted from cells and resolved on agarose gel electrophoresis. Lane M, 1 kB ladder; lane 1, control; lane 2, GO; lane 3, rGO; lane 4, silver nanoparticles.
Abbreviations: GO, graphene oxide; rGO, reduced graphene oxide.
Conclusion
Among various nanomaterials, graphene is a novel carbon-based nanomaterial, and has attracted a great deal of attention due to its remarkable physical, chemical, and biological characteristics. The results presented here demonstrate the antibacterial activity of GO and rGO against P. aeruginosa. rGO was synthesized from GO using BME as a novel reducing agent, which is nontoxic when compared to hydrazine. The novelty of this work includes the antibacterial activity of GO and rGO being evaluated in systematic analysis of cell growth and cell viability using saline and rich medium and explored. GO and rGO showed significant antibacterial activity in a concentration- and time-dependent manner. Further, our results demonstrated that oxidative stress is a key mechanism for the antibacterial activity of GO and rGO through ROS generation. This study opens an exciting opportunity for the use of graphene materials as an antibacterial agent.
Acknowledgments
This paper was supported by the SMART-Research Professor Program of Konkuk University. Dr Sangiliyandi Gurunathan was supported by a Konkuk University SMART full-time professorship. This work was supported by the Woo Jang Choon Project (PJ009107) and the next generation of Biogreen 21 (PJ00816903) from the Rural Development Administration (RDA), South Korea.
Disclosure
The authors report no conflicts of interest in this work.
References
- KrotoHWHeathJRO’BrienSCCurlRFSmalleyRECC60: buck-minsterfullereneNature1985318162163
- MauterMSElimelechMEnvironmental applications of carbon-based nanomaterialsEnviron Sci Technol2008425843585918767635
- StankovichSDikinDAPinerRDSynthesis of graphene-based nanosheets via chemical reduction of exfoliated graphite oxideCarbon20074515581565
- GeimKANovoselovKSThe rise of grapheneNat Mater2007618319117330084
- GeimAKGraphene: status and prospectsScience20093241530153419541989
- NovoselovKSGeimAKMorozovSVJiangDZhangYDubonosSVElectric field effect in atomically thin carbon filmsScience200430666666915499015
- ParkSRuoffRSChemical methods for the production of graphenesNat Nanotechnol2009421722419350030
- ComptonOCNguyenSTGraphene oxide, highly reduced graphene oxide, and graphene: versatile building blocks for carbon-based materialsSmall2010671172320225186
- LuoZYuTShangJWangYLimSLiuLLarge-scale synthesis of bi-layer graphene in strongly coupled stacking orderAdv Funct Mater201121911917
- RaoCNRSoodAKSubrahmanyamKSGovindarajAGraphene: the new two-dimensional nanomaterialAngew Chem Int Ed Engl2009487752777719784976
- YangKZhangSZhangGSunXLeeSTLiuZGraphene in mice: ultrahigh in vivo tumor uptake and efficient photothermal therapyNano Lett2010103318332320684528
- KostarelosKBiancoAPratoMPromises, facts and challenges for carbon nanotubes in imaging and therapeuticsNat Nanotechnol2009462763319809452
- LiuZTabakmanSWelsherKDaiHCarbon nanotubes in biology and medicine: in vitro and in vivo detection, imaging and drug deliveryNano Res200928512020174481
- HuangYXPalkarPVLiLJZhangHChenPIntegrating carbon nanotubes and lipid bilayer for biosensingBiosens Bioelectron2010251834183720047826
- YangKWanJZhangSZhangYLeeSTLiuZIn vivo pharmacokinetics, long-term biodistribution, and toxicology of PEGylated graphene in miceACS Nano2010551652221162527
- SunXLiuZWelsherKNano-graphene oxide for cellular imaging and drug deliveryNano Res2008120321220216934
- LiuZRobinsonJTSunXMDaiHJPEGylated nanographene oxide for delivery of water-insoluble cancer drugsJ Am Chem Soc2008130108761087718661992
- WangKRuanJSongHBiocompatibility of graphene oxideNanoscale Res Lett2011108
- AkhavanOGhaderiEAghayeeSFereydooniYTalebiAThe use of a glucose-reduced graphene oxide suspension for photothermal cancer therapyJ Mater Chem2012221377313781
- YangKHuLMaXMultimodal imaging guided photothermal therapy using functionalized graphene nanosheets anchored with magnetic nanoparticlesAdv Mater2012241868187222378564
- HuSHChenYWHungWTChenIWChenSYQuantum-dot-tagged reduced graphene oxide nanocomposites for bright fluorescence bioimaging and photothermal therapy monitored in situAdv Mater2012241748175422422734
- MaXTaoHYangKA functionalized graphene oxide–iron oxide nanocomposite for magnetically targeted drug delivery, photothermal therapy, and magnetic resonance imagingNano Res20125199212
- ParkSMohantyNSukJWNagarajaAAnJHPinerRDBiocompatible, robust free-standing paper composed of a TWEEN/graphene compositeAdv Mater2010221736174020496406
- HuWBPengCLuoWJGraphene-based antibacterial paperACS Nano201044317432320593851
- AkhavanOGhaderiEToxicity of graphene and graphene oxide nanowalls against bacteriaACS Nano201045731573620925398
- ZhangJLYangHJShenGXChengPZhangJYGuoSWReduction of graphene oxide via L-ascorbic acidChem Commun20104611121114
- LiuJYangLHopfingerAJAffinity of drugs and small biologically active molecules to carbon nanotubes: a pharmacodynamics and nano-toxicity factor?Mol Pharm2009687388219281188
- KangXWangJWuHAksayILiuJLinYGlucose oxidase– graphene–chitosan modified electrode for direct electrochemistry and glucose sensingBiosens Bioelectron20092590190519800781
- LyonDYBrunetLHinkalGWWiesnerMRAlvarezPJJAntibacterial activity of fullerene water suspensions (nC(60)) is not due to ROS-mediated damageNano Lett200881539154318410152
- FangMZhangZLiJZhangHLuHYangYConstructing hierarchically structured interphases for strong and tough epoxy nanocomposites by amine-rich graphene surfacesJ Mater Chem20102096359643
- KangSPinaultMPfefferleLDElimelechMSingle-walled carbon nanotubes exhibit strong antimicrobial activityLangmuir2007238670867317658863
- LiuSZengTHHofmannMBurcombeEWeiJJiangRAntibacterial activity of graphite, graphite oxide, graphene oxide, and reduced graphene oxide: membrane and oxidative stressACS Nano201159697196980
- AriasLRYangLJInactivation of bacterial pathogens by carbon nanotubes in suspensionsLangmuir2009253003301219437709
- ObraztsovaEALukashevEPZarubinaAPParkhomenkoIMYaminskyIVBactericidal action of single-walled carbon nanotubesPhys Bull200964320323
- LiaoKHLinYSMacOskoCWHaynesCLCytotoxicity of graphene oxide and graphene in human erythrocytes and skin fibroblastsACS Appl Mater Interfaces201132607261521650218
- ZhangYAliSFDervishiECytotoxicity effects of graphene and single-wall carbon nanotubes in neural phaeochromocytoma-derived PC12 cellsACS Nano201043181318620481456
- ChangYYangSTLiuJHIn vitro toxicity evaluation of graphene oxide on A549 cellsToxicol Lett201120020121021130147
- AkhavanOGhaderiEEsfandiarAWrapping bacteria by graphene nanosheets for isolation from environment, reactivation by sonication and inactivation by near-infrared irradiationJ Phys Chem B20111156279628821513335
- AkhavanOGhaderiEAkhavanASize-dependent genotoxicity of graphene nanoplatelets in human stem cellsBiomaterials2012328017802522863381
- HummersWSOffemanREPreparation of graphitic oxideJ Am Chem Soc1958801339
- ChenDLiLGuoLEnvironment-friendly preparation of reduced graphene oxide nanosheets via amino acidNanotechnology201122325601
- LiuLLiuWHongTWengXZhaiQZhouXAg+ and cysteine detection by Ag+–guanine interaction based on graphene oxide and G-quadruplex DNAAnal Methods2012419351939
- WangGQianFSaltikovCWJiaoYLiYMicrobial reduction of graphene oxide byShewanella Nano Res20114563570
- BecerraMCAlbesaIOxidative stress induced by ciprofloxacin in Staphylococcus aureusBiochem Biophys Res Commun20022971003100712359254
- McAllisterMJLiLJAdamsonDHSingle sheet functionalized graphene by oxidation and thermal expansion of graphiteChem Mater20071943964404
- LuoZLuYSomersLAJohnsonATCHigh yield preparation of macroscopic graphene oxide membranesJ Am Chem Soc200913189889919128004
- KhanraTPKuilaTKimNBaeSYuDSLeeJHSimultaneous bio-functionalization and reduction of graphene oxide by baker’s yeastChem Eng J2012183526533
- KuilaTBoseSKhanraPMishraAKKimNHLeeJHRecent advances in graphene-based biosensorsBiosens Bioelectron2011264637464821683572
- Eda ChhowallaMChemically derived graphene oxide: towards large-area thin film electronics and opto-electronicsAdv Mater2010222392241520432408
- Fernandez-MerinoMJGuardiaLParedesJIVillar-RodilSSolis-FernandezPMartinez-AlonsoAVitamin C is an ideal substitute for hydrazine in the reduction of graphene oxide suspensionsJ Phys Chem C Nanomater Interfaces201011464266432
- NethravathiCRajamathiMChemically modified graphene sheets produced by the solvothermal reduction of colloidal dispersions of graphite oxideCarbon20084619941998
- ShenJHuYShiMFast and facile preparation of graphene oxide and reduced graphene oxide nanoplateletsChem Mater20092135143520
- ZhuCGuoSFangYDongSReducing sugar: new functional molecules for the green synthesis of graphene nanosheetsACS Nano201042429243720359169
- NiyogiSBekyarovaEItkisMEZhangHShepperdKHicksJSpectroscopy of covalently functionalized grapheneNano Lett2010104061406620738114
- KudinKNOzbasBSchnieppHCPrud’hommeRKAksayIACarRRaman spectra of graphite oxide and functionalized graphene sheetsNano Lett20088364118154315
- RuizONFernandoKAWangBBrownNALuoPGMcNamaraNDGraphene oxide: a nonspecific enhancer of cellular growthACS Nano201158100810721932790
- AgarwalSZhouXYeFHeQChenGCKSooJInterfacing live cells with nanocarbon substratesLangmuir2010262244224720099791
- VecitisCDZodrowKRKangSElimelechMElectronic-structure-dependent bacterial cytotoxicity of single-walled carbon nanotubesACS Nano201045471547920812689
- KangSHerzbergMRodriguesDFElimelechMAntibacterial effects of carbon nanotubes: size does matterLangmuir2008246409641318512881
- NelAXiaTMadlerLLiNToxic potential of materials at the nano levelScience200631162262716456071
- ParkEJChoiJParkYParkKOxidative stress induced by cerium oxide nanoparticles in cultured BEAS-2B cellsToxicology20082459010018243471
- FosterKAGaleffiFGerichFJTurnerDAMullerMOptical and pharmacological tools to investigate the role of mitochondria during oxidative stress and neurodegenerationProg Neurobiol20067913617116920246
- OttMGogvadzeVOrreniusSZhivotovskyBMitochondria, oxidative stress and cell deathApoptosis20071291392217453160
- ValkoMRhodesCJMoncolJIzakovicMMazurMFree radicals, metals and antioxidants in oxidative stress-induced cancerChem Biol Interact200616014016430879
- AkhavanOGhaderiEEmamyHNontoxic concentrations of PEGylated graphene nanoribbons for selective cancer cell imaging and photothermal therapyMater Chem2012222062620633