Abstract
Background
Determination of the fate of nanoparticles (NPs) in a biological system, or NP biodistribution, is critical in evaluating an NP formulation for nanomedicine. Current methods to determine NP biodistribution are greatly inadequate, due to their limited detection thresholds. Herein, proof of concept of a novel method for improved NP detection based on in situ polymerase chain reaction (ISPCR), coined “nanobarcoding,” is demonstrated.
Methods
Nanobarcoded superparamagnetic iron oxide nanoparticles (NB-SPIONs) were characterized by dynamic light scattering, zeta potential, and hyperspectral imaging measurements. Cellular uptake of Cy5-labeled NB-SPIONs (Cy5-NB-SPIONs) was imaged by confocal microscopy. The feasibility of the nanobarcoding method was first validated by solution-phase PCR and “pseudo”-ISPCR before implementation in the model in vitro system of HeLa human cervical adenocarcinoma cells, a cell line commonly used for ISPCR-mediated detection of human papilloma virus (HPV).
Results
Dynamic light-scattering measurements showed that NB conjugation stabilized SPION size in different dispersion media compared to that of its precursor, carboxylated SPIONs (COOH-SPIONs), while the zeta potential became more positive after NB conjugation. Hyperspectral imaging confirmed NB conjugation and showed that the NB completely covered the SPION surface. Solution-phase PCR and pseudo-ISPCR showed that the expected amplicons were exclusively generated from the NB-SPIONs in a dose-dependent manner. Although confocal microscopy revealed minimal cellular uptake of Cy5-NB-SPIONs at 50 nM over 24 hours in individual cells, ISPCR detected definitive NB-SPION signals inside HeLa cells over large sample areas.
Conclusion
Proof of concept of the nanobarcoding method has been demonstrated in in vitro systems, but the technique needs further development before its widespread use as a standardized assay.
Introduction
Nanomedicine is the application of nanotechnology toward the diagnosis and treatment of complex diseases. It involves the use of nanometer-sized particles (1–100 nm) that are precisely engineered to detect and monitor pathologies, deliver targeted therapy, or a combination of both modalities (“theragnosis” or “theranosis”) – all at the single-cell level. In essence, nanoparticles (NPs) can be programmed to perform a controlled sequence of molecular functions, especially in regards to treating malignant cells. Here, NPs can be designed to release a therapeutic agent based on the extent of the disease state in the single cell, repair single cells at the molecular level, or induce “ unrepairable” single cells to perish by apoptosis. The multifunctional features of NPs offer a continuous system to diagnose and treat diseases at the earliest possible stage, perhaps before symptoms actually appear.Citation1,Citation2
Given the extensive number of combinations possible on an engineered nanomedical system, it is obvious that any NP formulation possesses distinct physicochemical properties that influence their biological interaction with single cells and whole tissues. Moreover, the choice of route of administration, density, and dosage of NPs influences NP biodistribution profiles in targeted tissues and nontargeted systemic organs. There is a rapidly growing body of literature on the development of multifunctional NPs for theragnostic purposes, but direct comparisons between in vitro and in vivo studies of similar NP types may not be possible due to the lack of standardization in study design and data reporting.Citation3 Furthermore, current metrology to detect NPs is limited, making it difficult to evaluate NP biodistribution accurately. Citation3 Although NPs can be thoroughly characterized by their physicochemical properties, it remains difficult to predict NP biodistribution profiles and to assess such predictions empirically.
Current NP detection techniques can be classified as either bulk-cell, in which large numbers of cells or whole tissues are scanned for the presence of NPs, or single-cell, in which individual cells are probed for positive NP uptake. Such analysis methods are often called “sample preserving,” since they maintain the structure of the biological samples for NP detection by imaging modalities, which is attractive for NP biodistribution studies, since spatial location and NP-induced effects can be evaluated.Citation4 In contrast, there is also a special class of bulk-cell analysis methods – “sample-destructive” – that analyzes NP amounts after processing the biological sample into cell lysates or tissue homogenates.Citation4
Bulk-cell analysis employs imaging methods dependent on fluorescence labeling (eg, quantum dots),Citation5,Citation6 radiolabeling,Citation7,Citation8 or magnetic coresCitation9–Citation11 to determine NP locations in large tissues. For example, Gultepe et al synthesized magnetic cationic liposomes that incorporate superparamagnetic iron oxide NPs (SPIONs) and studied in vivo biodistribution in tumor-bearing mice with a combination of magnetic resonance imaging (MRI) and gamma counting of accumulated 111In-labeled magnetic cationic liposomes in systemic organs after sacrifice.Citation12 In another approach, Haglund et al prepared peptide-targeted fluorescent quantum dots, directly injected them into SkBr3 breast cancer tumors in athymic mice, and analyzed histological tissue sections by fluorescence microscopy.Citation13 In both instances, NPs can only be detected when they are present in large aggregates/agglomerates, or in other words, above the detection threshold of the fluorescence microscope, which is bound by the wavelength of light. Individual NPs are suboptical and can only be detected when they are aggregated or agglomerated in large numbers. Additionally, it is difficult to associate NP uptake with cell type, especially within histological tissue sections, due to the relatively large screening area and poor imaging resolution in bulk-cell analysis.
On the other hand, single-cell analysis techniques are ultrasensitive, with the capability of detecting small numbers of NPs in individual cells. These methods include flow cytometry (also known as fluorescence-activated cell sorting),Citation14–Citation17 electron microscopy (EM),Citation18–Citation20 and so-called super-resolution microscopy.Citation21–Citation24 For example, scanning EM (SEM) and transmission EM (TEM) are common methods for imaging NP uptake in vitro and ex vivo. Gupta et alCitation25 and Gupta and GuptaCitation26 showed the accumulation of SPIONs at the cell surface by SEM and the location of SPIONs inside single human fibroblasts by TEM. Even though these techniques can resolve and detect small numbers of NPs associated with individual cells, they are not practical for large-scale biodistribution studies, especially in regards to ex vivo analysis of systemic organs. Unless one knows where to look for NPs, analysis of NP biodistribution in this manner is extremely tedious and time-consuming.
As mentioned previously, there is also a special class of bulk-cell analysis techniques that requires the destruction of the biological sample before measuring the presence of NPs. Mass spectrometry, most notably inductively coupled plasma mass spectrometry,Citation27–Citation29 has been employed successfully in quantifying small amounts of NPs due to its very low detection limits (parts per trillion to parts per million). Field-flow fractionation is a separation technique that is gaining ground in quantifying NPs in biological analytes,Citation30 given the possibility of coupling with mass spectrometry. In addition, chromatography, notably high-performance liquid chromatography, has been used to identify, quantify, and purify NPs present in cell lysates and tissue homogenates.Citation31–Citation34 Although these sample-destructive techniques are sensitive enough to detect single NPs in cell lysates and tissue homogenates, these techniques assume that the cells in the original biological samples were homogeneous, meaning that every cell takes up an equal fraction of the measured NP amount. Usually, the NP quantification is normalized by starting cell number and/or cellular protein mass, classifying these methods as analyses at the bulk-cell level. This makes it difficult to discern whether the measured NP amount stemmed from small, homogeneous NP uptake from all cells or large NP uptake within a small subpopulation of cells.Citation35 Likewise, these techniques do not discriminate between internalized NPs and NPs fused to the outside of the cell membrane, because spatial information is lost.
In light of the current limitations, there is an obvious need for more sensitive and more efficient methods that (1) detect and measure small numbers of NPs of various types, ideally single NPs; (2) associate preferential NP uptake with histological cell type by preserving spatial information in samples; and (3) allow for relatively quick and accurate NP detection in in vitro and ex vivo samples for whole-body NP biodistribution studies. To achieve all of these specifications currently, one needs to perform complementary methods. For example, fluorescence microscopy (after fluorescence labeling) and TEM can be used in tandem for determining the cellular uptake efficiency and intracellular locations, respectively, of SPION conjugates.
One method that has the potential to fulfill the requirements of an improved NP detection strategy is in situ polymerase chain reaction (ISPCR). ISPCR combines the extreme sensitivity of PCR and the cell-localizing ability of in situ hybridization, and has been utilized for rapid detection of HIV-1 in CD4+ cells and human papilloma virus (HPV) in epithelial tumor tissue.Citation36 In ISPCR, cells or tissue sections are fixed and digested on glass slides to allow for penetration of PCR amplification cocktail inside single cells. Using specific primers, the gene of interest can be amplified in situ (inside the cell) with labeled nucleotides or primers, and the labeled PCR products, or amplicons, can then be detected using enzyme-linked antibodies that specifically bind to the labeled nucleotides and produce a colorimetric product (after exposure to a substrate) that can be visualized using a standard light microscope, or if fluorescently labeled nucleotides are used, direct imaging under a fluorescence microscope.Citation37,Citation38 The colorimetric or fluorescent signal generated by ISPCR provides the abilities to optically identify single cells carrying specific genes of interest in a tissue section and to correlate cellular genotype to aspects of normal or pathological tissue morphologies.
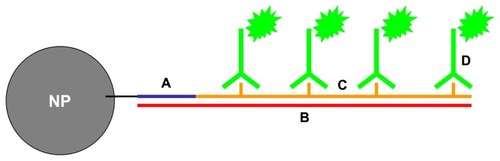
Since ISPCR has had success in detecting viral DNA at a low copy number inside single cells, which is analogous to the small numbers of NPs that can be present, the ISPCR technique can be adapted to the detection of single NPs inside cells. Thus, a novel method for single NP detection was conceived that incorporates a nonendogenous oligonucleotide (oligo, henceforth) on the NP surface for use as a unique “nanobarcode” (NB).Citation39–Citation41 After the nanobarcoded NPs (NB-NPs) are internalized by cells, the NB serves as a forward primer during ISPCR-mediated signal amplification inside the cells of fixed samples. As amplicons are generated, they drift away from the NP, forming a radius of labeled ISPCR products or amplicons that can be detected at the optical level (). One can quickly determine which individual cells in several biological samples contain internalized NPs, facilitating the quantification/qualification of NP uptake and the application of specific assays on the NP-positive cell subpopulation (). For the preliminary detection scheme, the development of optical signal is based on digoxigenin (DIG), which is a commonly used colorimetric detection system in in situ hybridization. A DIG-based detection system is advantageous over other detection systems (eg, biotin-streptavidin labeling), since DIG is derived from the foxglove plant and is not present in mammalian tissues, reducing nonspecific signals due to endogenous products.Citation36 shows a depiction of the NB system on an NP.
Figure 1 Depiction of detection of nanobarcoded nanoparticles (NB-NPs) by in situ polymerase chain reaction (ISPCR) in single cells and whole tissues. (A) NB-NPs present inside a single cell (gray circles) are subjected to ISPCR, and the resulting labeled amplicons form a radius of colorimetric or fluorescent signal around each NP, which is visible at the optical level (green circles) (B) Single cells exhibiting the colorimetric or fluorescent signal (green circles) are easily identifiable within a cell monolayer or histological tissue section, denoting the presence of NB-NPs within those cells.
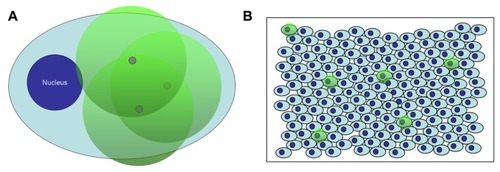
Figure 2 Depiction of nanobarcoded nanoparticles (NB-NP). (A) NB is conjugated to the surface of NPs; (B) the NB will anneal to a complementary, nonendogenous ssDNA “template;” (C) polymerase chain reaction amplification generates amplicons labeled with digoxigenin (DIG)-labeled deoxyuridine triphosphate; (D) anti-DIG horse radish peroxidase antibodies bind to DIG-labeled amplicons, and a colorimetric product is formed upon exposure to diaminobenzidine substrate by horseradish peroxidase.
In this paper, proof of concept of the nanobarcoding method was demonstrated using SPIONs as the model NP type. First, NB-SPIONs were synthesized and characterized by size, zeta potential, and hyperspectral imaging measurements. The nanobarcoding method was then tested in cell-free and cell-based systems, with the latter using HeLa (human cervical adenocarcinoma) as the in vitro model system.
Materials and methods
Cell culture
HeLa human cervical adenocarcinoma cells (American Type Culture Collection [ATCC], Manassas, VA) were cultured in Eagle’s minimum essential medium (EMEM) supplemented with 10% (v/v) fetal bovine serum (ATCC). Before SPION treatment, the medium was changed to Opti-MEM I reduced serum media (Life Technologies, Carlsbad, CA). All cells were maintained in T25 tissue-culture flasks at 37°C with 5% CO2/95% ambient air and subcultured every 3–4 days to maintain exponential growth.
NB-SPION synthesis
Water-soluble, carboxylated (COOH) SPIONs (10 nm core size measured by TEM) were acquired from Ocean NanoTech (Springdale, AK) and used as purchased. SPIONs (1 mg, 0.86 nmol Fe) were diluted in 0.22 mL of nanograde water. SPIONs were activated with 0.1 mL 1-ethyl-3-(3-dimethyl-aminopropyl) carbodiimide (~10 mM)/sulfo-N-hydroxysulfosuccinimide (~5 mM) solution for 10 minutes with continuous vortexing at room temperature. Activated SPIONs were diluted with 0.5 mL of nanograde water and 5′-amine-modified, 25-nt NB with sequence 5′-H2 N-(CH2)6-AAG CAC GGG GTC TAA CAC TAT CGC T-3′ (Integrated DNA Technologies [IDT], Coralville, IA) was added at 10 × molar excess (8.6 nmol) to a final reaction volume of 1 mL. For cellular uptake studies, 5′-amine modified NB with a 3′-Cy5 label (IDT) was conjugated to the COOH-SPIONs. The solution was allowed to react for 24 hours at room temperature with continuous vortexing. The reactions were quenched by addition of 20 mM final concentration of Tris-HCl in nanograde water (pH 7.0). The NB-SPIONs were washed three times with nanograde water via magnetic separation at 4°C and then diluted to 1 mg/mL stock concentration.
NB-SPION characterization
Size (hydrodynamic diameter by dynamic light scattering [DLS]) measurements were taken using the Zetasizer Nano ZS (Malvern Instruments, Malvern, UK). COOH-SPIONs and NB-SPIONs were diluted to 20 μg/mL in nanograde water, phosphate-buffered saline (PBS), Opti-MEM I, or serum-free EMEM and transferred to a disposable folded capillary cell for analysis by the Zetasizer Nano ZS. Three measurements were taken at room temperature (25°C) using the Zetasizer Nano software’s automatic mode to choose the appropriate settings for run length and number of runs per measurement. For size, the Z-averages are reported. The Z-average is the intensity weighted mean hydrodynamic size of the ensemble collection of particles, which is derived from cumulants analysis of the dynamic light scattering measured intensity autocorrelation function.
For hyperspectral imaging analysis, COOH-SPIONs and NB-SPIONs were diluted to 250 μg/mL in nanograde water. Free NB was diluted to 100 μM in nanograde water. Samples were submitted to CytoViva (Auburn, AL) for spectral analysis using the CytoViva Hyperspectral Imaging System. The mean spectral curves from each sample were used to characterize the surface chemistry on the NPs. To determine how much of the SPION surface was covered with conjugated NB, the spectral mapping function in the CytoViva Hyperspectral Image Analysis software was applied with respect to the NB spectral library.
Solution-phase PCR of NB-SPIONs
To test the feasibility of ISPCR, solution-phase PCR was first performed on the NB-SPION suspension and supernatant. The supernatant, after magnetically isolating the NB-SPIONs, was included in PCR reactions to demonstrate that the PCR products, or amplicons, were derived from conjugated NB and not free NB remaining in the SPION suspensions. A synthetic 99-nt single-stranded (ssDNA) DNA oligo was used as the amplification template (5′-AAG CAC GGG GTC TAA CAC TAT CGC TCG AAG GAC GTC CGT CGA TGC TAA GTT CCT AGA TTT ATA GCG CAT TCC CGT TTA GGG ATC TAC GTT AAG GCT-3′), and a corresponding synthetic 27-nt reverse primer (5′-AGC CTT AAC GTA GAT CCC TAA ACG GGA-3′) only amplified the complementary strand of the template after the first round of PCR (IDT). The NB (forward primer) and reverse primer were checked for nonspecificity for endogenous DNA sequences via BLAST (National Center for Biotechnology Information, Bethesda, MD).
Before NB-SPIONs can be applied to and detected in cells, it is wise to check for nontargeted amplification of genomic DNA by the conjugated NB. The model in vitro system for testing the in situ PCR-based detection method is HeLa, a human cervical cancer cell line often used to optimize in situ PCR conditions for detection of HPV. Thus, genomic DNA should be extracted from HeLa cells and subjected to solution-phase PCR against the NB. HeLa cells were grown in a T75 cell culture flask to ~90% confluence and harvested via trypsin treatment. The cells were centrifuged and washed twice with cold PBS and resuspended to a final concentration of 107 cells/mL in cold PBS. Using the Blood and Cell Culture Mini Kit (Qiagen, Valencia, CA), the cells were lysed and protease digested before purification and elution of genomic DNA from an anion-exchange resin column. The HeLa genomic DNA was then precipitated after the addition of isopropanol and quantified using the NanoDrop 2000 (Thermo Fisher Scientific, Waltham, MA). About 250 ng of HeLa genomic DNA was loaded into solution-phase PCR reactions with 10.5 μg NB-SPIONs (HeLa genomic DNA served as template). To check the integrity of the extracted DNA, primers (2.5 μM final concentration) for the HPV18 E7 (172 bp amplicon; forward 5′-CCG AGC ACG ACA GGA GAG GCT-3′, reverse 5′-TCG TTT TCT TCC TCT GAG TCG CTT) and β-actin (99 bp amplicon; forward 5′-CCA CAC TGT GCC CAT CTA CG-3′, reverse 5′-AGG ATC TTC ATG AGG TAG TCA GTC AG-3′) were used to amplify corresponding regions in the HeLa genomic DNA.Citation42
Solution-phase PCR was performed in a Thermo Hybaid Sprint Thermal Cycler PCR machine (Thermo Fisher Scientific) using 12.5 μL 2X GoTaq Colorless Master Mix (containing 400 μM deoxynucleotide triphosphate and 3 mM MgCl2, (Promega, Madison, WI), 1 μM reverse primer, 200 ng amplification template, NB-SPION suspension (1, 3, or 6 μg) or supernatant (1, 3, or 6 μL). Nuclease-free water was added to a final PCR reaction volume of 25 μL. For positive and negative amplification controls, either 1 μM free NB or 6 μL DNase-free water was added instead of SPION suspension or supernatant, respectively. After 1 minute of denaturation at 94°C, PCR amplification was then carried out in 30 cycles of 30 seconds at 94°C, 30 seconds at 55°C, and 1 minute at 72°C. In the last cycle, the elongation step at 72°C was prolonged to 5 minutes. The PCR reactions were then cooled to 4°C. Amplicons were detected by agarose gel electrophoresis using a 2% Divbio Synergel Agarose Additive (BioExpress, Kaysville, UT)/0.7% agarose gel with 0.5 μg/mL ethidium bromide (EtBr) in 1 × Tris-acetate-EDTA buffer (Sigma-Aldrich, St Louis, MO). NB-SPIONs (10 μg) that were not subjected to PCR were also loaded into the gel as a nonamplification control. Agarose gel electrophoresis was run at 50 V for 2 hours, and the gel was imaged under ultraviolet light using the Gel Documentation System (Bio-Rad, Hercules, CA). Semiquantitative analysis of band densities (also known as intensity peak size) was performed using ImageJ’s Gel Analysis Tool.
Cellular uptake of NB-SPIONs
HeLa cells were seeded at 5 × 10⁴ cells per cm2 onto 18 mm glass coverslips placed in a 12-well tissue-culture plate. After incubating at 37°C/5% CO2 overnight, cells were washed three times with PBS before the addition of Cy5-NB-SPIONs at 50 nM and 25 nM final concentrations in Opti-MEM I Reduced Serum Media. After 24-hour incubation at 37°C/5% CO2, cells were washed three times with PBS and fixed in 4% (w/v) paraformaldehyde in PBS for 10 minutes. After washing in PBS, cells were permeabilized with 0.1% (v/v) Triton X-100 in PBS for 5 minutes. After blocking cells in 1% (w/v) bovine serum albumin (BSA) in PBS for 20 minutes, the cells were stained with Alexa Fluor 488 phallotoxin (F-actin in cytoskeleton, 5 μL per coverslip) and Hoechst 33342 (cell nuclei, 2 μg/mL final) (Life Technologies) in PBS for 20 minutes. Coverslips were mounted onto glass microscope slides using VectaShield Mounting Medium for Fluorescence (Vector Labs, Burlingame, CA). Cells were imaged for Cy5 (Ex/Em 648/668), Alexa Fluor 488 phallotoxin (Ex/Em 488/499), and Hoechst 33342 (Ex/Em 350/461) at 60 × magnification on a Nikon A1R confocal microscope (Nikon Instruments, Melville, NY).
Pseudo-ISPCR of NB-SPIONs
To determine if NB-SPIONs can be detected inside single cells by ISPCR, “pseudo”-ISPCR was performed, in which NB-SPIONs were applied to cells after fixation and pretreatment to eliminate issues associated with NP incubation with live cells. HeLa cells in a T25 culture flask (~1 × 10⁶ cells) were washed in PBS, harvested, and seeded onto sterile APTES (3-aminopropyltriethoxysilane)-treated glass slides at 40,500 cells/25 μL in two 0.81 cm2 areas per slide (5 × 10⁴ cells per cm2), which were delineated with a hydrophobic Pap-Pen. Cells were seeded on the delineated areas and allowed to dry under sterile conditions. After incubation, the cells were washed in PBS and fixed in 4% paraformaldehyde in PBS for 30 minutes at 4°C. After washing three times in PBS, the cells were permeabilized with 0.1% (v/v) Triton X-100 in PBS for 5 minutes and then deproteinized with proteinase K (Sigma-Aldrich) in PBS for 10 minutes at room temperature. Deproteinization was stopped by washing cells in a 0.2% (w/v) glycine in PBS, and then the cells were postfixed in ice-cold ethanol for 10 minutes. Endogenous peroxidase activity was blocked by incubating the cells in 0.3% H2O2 in PBS for 10 minutes at room temperature and then washing quickly in PBS and then water. Frame-Seal Incubation Chambers (Bio-Rad) were applied to each cell area on the slide (two per slide). The ISPCR cocktail was prepared containing 15 μL 2 × GoTaq Colorless Master Mix (Promega), 200 nM amplification template, 2.5 μM reverse primer, 20 μM DIG-tagged deoxyuridine triphosphate (DIG-dUTP) (1:10 DIG-dUTP: deoxythymidine triphosphate [dTTP] ratio), 0.1% (w/v) BSA, and varying amounts of NB-SPIONs (0.5, 1, 2, 5, or 10 μg). Nuclease-free water was added to a final PCR reaction volume of 30 μL. For the negative ISPCR control, nuclease-free water was added in lieu of NB-SPIONs. For the positive ISPCR controls, free NB (2.5 μM final) was used in lieu of NB-SPIONs, and HPV18 E7 or β-actin primers were used in lieu of all NB reagents as “internal” positive controls. After heating the cocktails to 80°C, the cocktails were layered over the cells and then sealed using a plastic coverslip. The slides were then placed on the GeneAmp In Situ PCR System 1000 (PerkinElmer, Waltham, MA), which was preheated to 80°C. After 2 minutes of initial denaturation at 94°C, PCR amplification was then carried out in 30 cycles of 1 minute at 94°C, 1 minute at 55°C, and 1 minute at 72°C. In the last cycle, the elongation step at 72°C was prolonged to 5 minutes. The slides were then cooled to 4°C.
After thermocycling, the amplification cocktail was collected from the surface of cells for analysis by agarose gel electrophoresis. The slides were then washed three times in PBS for 5 minutes each. Nonspecific sites were blocked by incubating the slides 1% (w/v) BSA in 50 mM Tris-HCl/300 mM NaCl (blocking buffer) for 30 minutes. Anti- DIG antibody from sheep, Fab fragments, conjugated with polymerized horse radish peroxidase ([POD] Roche Applied Science, Indianapolis, IN) was added to blocking buffer at 1.5 U/mL final concentration. The slides were incubated in the antibody solution for 1 hour at room temperature and then washed three times with Tris-HCl/NaCl buffer for 10 minutes each. The POD substrate, diaminobenzidine (DAB), was diluted in peroxide buffer (Roche Applied Science), and the slides were incubated with the DAB working solution until cells developed a purple-brown color. The slides were washed in water, dried, and mounted in VectaShield Mounting Medium. Bright-field images of cell samples were obtained with a Nikon Eclipse 80i microscope (Nikon Instruments) equipped with a MicroPublisher 5.0 RTV camera (QImaging, Surrey, BC, Canada) at 20 × magnification.
ISPCR-mediated detection of NB-SPIONs
HeLa cells were seeded at 5 × 10⁴ cells/cm2 in a T25 tissue culture flask or multiwell tissue-culture plates. After incubating at 37°C/5% CO2 overnight, cells were washed three times with PBS before the addition of NB-SPIONs in Opti-MEM I Reduced Serum Media (Life Technologies, Carlsbad, CA). After 24 hours incubation at 37°C/5% CO2, the cells were washed three times with PBS before harvesting by trypsinization. Cells were centrifuged and then washed with PBS before counting. Cellular smears (40,500 cells/25 μL) were fixed and pretreated as described for pseudo-ISPCR. The ISPCR cocktail was prepared containing 15 μL 2 × GoTaq Colorless Master Mix, 200 nM amplification template, 2.5 μM reverse primer, 20 μM DIG- dUTP (1:10 DIG-dUTP:dTTP ratio), and 0.1% (w/v) BSA. Nuclease-free water was added to a final ISPCR reaction volume of 30 μL. For the negative ISPCR control, nuclease-free water was added in lieu of amplification template and reverse primer. Similarly, HPV18 E7 primers were used for positive ISPCR controls. ISPCR cocktails were added to cellular smears and sealed with Frame-Seal Incubation Chambers. ISPCR thermocycling conditions, revelation procedures, and imaging protocols were performed as described for pseudo-ISPCR.
Statistical analysis
Statistical significance between COOH- and NB-SPION data (size and zeta potential) was computed using Microsoft Excel’s (Microsoft Corporation, Redmond, WA) Student t-test function (two-tailed, two-sample unequal variance) using α = 0.05.
Results
NB-SPION characterization
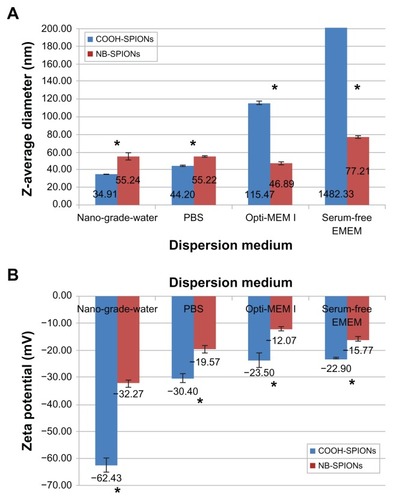
displays size and zeta potential measurements for COOH- and NB-SPIONs dispersed in different media. A significant increase in Z-average diameter was observed after NB conjugation when measured in nanograde water and PBS (P < 0.05). In general, the Z-average diameter increases and the zeta potential becomes more positive when the dispersion medium is composed of more solvent molecules (eg, counterions, amino acids) that can adsorb to the surface of the NPs. The adsorption of counterions and amino acids (eg, l-glutamine) to the surface of oligo-functionalized NPs has been observed previously.Citation43,Citation44 NP agglomeration is known to occur to some extent in biological and environmental solutions,Citation45 and Opti-MEM I and serum-free EMEM induce the formation of COOH-SPION agglomerates that are micron-sized. In contrast, the Z-average diameter of the NB-SPIONs remained in the nanoscale (). It is hypothesized that the increase in zeta potential, attributed to the conjugated NB, stabilizes the SPION size in different dispersion media. The NP surface becomes more negatively charged and attracts more positively charged counterions and/or amino acids to form a thicker boundary layer around the NP, resulting in a more positive zeta potential. The zeta potentials are most negative when the SPIONs are dispersed in nanograde water and most positive when the SPIONs are dispersed in serum-free EMEM, which was expected (). The zeta potentials of the COOH- and NB- SPIONs were statistically different in all dispersion media (P < 0.05). The difference is most apparent when the SPIONs were dispersed in nanograde water (−62.43 mV for COOH-SPIONs and −32.27 mV for NB-SPIONs).
Figure 3 Size (A) and zeta potential measurements (B) of carboxylated (COOH) and nanobarcoded (NB) superparamagnetic iron oxide nanoparticles (SPIONs) in different dispersion media.
Note: Asterisks indicate significant difference between NB-SPION and COOH-SPION samples in the same medium (P < 0.05).
Abbreviations: EMEM, Eagle’s minimum essential medium; PBS, phosphate-buffered saline.
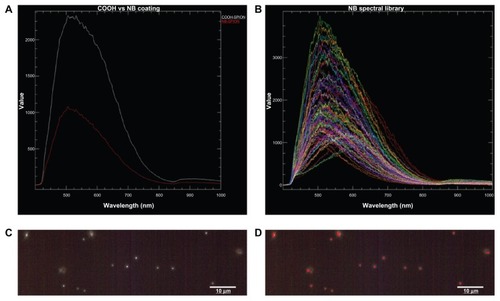
Hyperspectral imaging analysis was performed to confirm NB conjugation to the SPION surface. shows the mean spectral responses of COOH- and NB-SPIONs. The x-axis units are in wavelength in nm, and the y-axis units are counts of the relative intensity of the reflectance scatter within the spectral data. The peak intensity of NB-SPIONs is much lower than that of COOH-SPIONs, indicating that the light-scattering properties of NB-SPIONs were reduced. In general, metallic and metal oxide NPs experience a similar reduction in their reflectance peak when new chemistry is introduced onto the NPs (Leslie Krauss, CytoViva, email communication, May 31, 2012). These data show that NB has been successfully conjugated onto the surface of the COOH-SPIONs. To determine how much of the SPION surface was covered with conjugated NB, the spectral mapping function in the CytoViva Hyperspectral Image Analysis Software was applied, referencing the NB spectral library (). Each pixel in the hyperspectral scan of NB-SPIONs () that matches the NB spectral library is pseudo-colored red, and the results show that the NB seems to coat the SPION entirely ().
Figure 4 (A) Mean spectral responses of nanobarcoded superparamagnetic iron oxide nanoparticles (NB-SPIONs) (red trace) and carboxylated (COOH) SPIONs (white trace). (B) NB spectral library that was used to map pixels in the hyperspectral microscopy image of NB-SPIONs (C), pseudo-color red (D), indicating the presence of NB on the SPION surface.
Note: Scale bars are 10 μm. Images provided by CytoViva, Inc, Auburn, AL (http://www.cytoviva.com).
Solution-phase PCR of NB-SPIONs
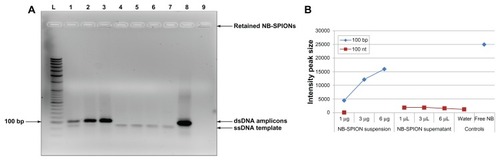
An image of the agarose gel is shown in . The upper band seen in most of the lanes represents 99-bp double-stranded DNA (dsDNA) amplicons, and the lower one is unamplified template, which is ssDNA. The identity of the upper band is confirmed by the positive amplification control of free NB in lane 8. The identity of the lower band is confirmed from the negative amplification control (water) in lane 7. As apparent in lanes 1–3, the amplification of the conjugated NB increases with the SPION amount added to the PCR reaction (). No amplicons were generated from the supernatants, as seen in lanes 4–6. Retention of the NB-SPIONs can be observed as thin fluorescent bands at the bottom of the wells in lanes 1–3 and 9, as expected. Since positive EtBr staining is observed and EtBr preferentially stains nucleic acids, this indicates the presence of NB conjugated to the NP surface. The fluorescence intensity from the retained NB-SPIONs increases with increasing SPION volume added to the PCR reaction. Although the NB-SPIONs were retained in the wells of the agarose gel, the electrophoretic mobility of the amplicons was not hindered.
Figure 5 Agarose gel electrophoresis of nanobarcoded superparamagnetic iron oxide nanoparticle (NB-SPION) suspension and supernatants. (A) Gel image: lane L, DNA ladder; lanes 1–3, polymerase chain reactions (PCR) with NB-SPIONs (1, 3, or 6 μg); lanes 4–6, PCRs with SPION-free supernatant (1, 3, or 6 μL); lane 7, PCR reactions without NB (negative water control); lane 8, PCR reactions with free NB (positive control); lane 9, 10 μg NB-SPIONs (nonamplification control). The 100-bp band has been indicated for reference. (B) Semiquantitative analysis of intensity peak size of 99 bp and 99 nt bands by ImageJ.
PCR performed against HeLa genomic DNA yielded no detectable amplicons, even for PCR reactions containing free NB and reverse primer. However, positive-control primers for HPV18 E7 and β-actin generated the expected amplicons (172 bp and 99 bp, respectively), indicating that the extracted DNA was of high integrity (data not shown). This demonstrates that the NB does not amplify nonspecific sequences in HeLa genomic DNA. Thus, detection via this NB sequence would be restricted to NB-SPIONs.
Cellular uptake of NB-SPIONs
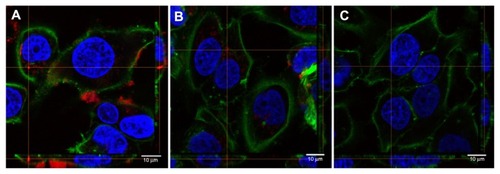
Cellular uptake studies were performed to investigate whether the in vitro model cell type, HeLa, was able to internalize NB-SPIONs despite their extremely negative zeta potential and the absence of a cell-targeting ligand, as demonstrated in previous studies of oligonucleotide-functionalized gold and iron oxide NPs.Citation46–Citation48 To determine if the NB-SPIONs are bound to the outside of cell membranes or actually internalized in cells, Cy5-labeled NB (3′ end) was conjugated to SPIONs to provide a means of fluorescence-mediated tracking. NB-SPION doses for confocal microscopy are based on elemental iron content of the NB-SPIONs (0.86 nmol/mg). Fluorescence confocal microscopy of HeLa cells treated with Cy5-NB-SPIONs show that some Cy5-NB-SPIONs are found inside the cells at 50 and 25 nM (, respectively) concentrations over a 24-hour incubation period, although most of the Cy5-NB-SPIONs were found on top of the cells (as seen in the cellular cross sections to the right and bottom of ).
Figure 6 Confocal microscopy images of Cy5-labeled nanobarcode conjugated to superparamagnetic iron oxide nanoparticles (Cy5-NB-SPIONs) inside HeLa cells with cross sections (bottom and right of images). (A) 50 nM Cy5-NB-SPIONs; (B) 25 nM Cy5-NB-SPIONs; (C) untreated control.
Notes: Green, Alexa Fluor 488 phallotoxin (F-actin); blue, Hoechst 33342 (nuclei); red, Cy5-NB-SPIONs. Scale bars are 10 μm.
Pseudo-ISPCR of NB-SPIONs
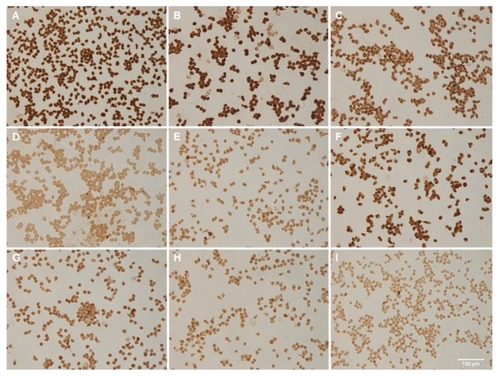
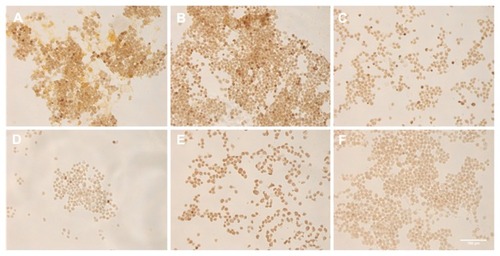
To show that the nanobarcoding method can be used to detect NB-SPIONs inside HeLa cells, pseudo-detection of NB-SPIONs by ISPCR was performed. The term “pseudo” means that the cells were not incubated with NB-SPIONs pre-ISPCR; instead, the NB-SPIONs were simply included in the ISPCR cocktail. Performing ISPCR in this manner eliminates any uncontrollable variables that are related to the effects of NP interaction with living cells. Panels A–E in show that the DAB signal intensity is directly proportional to the amount of NB-SPIONs present in the ISPCR cocktail, which was expected. NB-SPIONs at 10 μg exhibited the strongest signal, while NB-SPIONs at 0.5 μg exhibited the weakest signal. These extremes in DAB signal intensity were comparable to the signal intensities of panel F (free NB) and panel G (water), respectively. Interestingly, the DAB signal intensities from the “internal” positive controls of HPV18 E7 and β-actin (panels H and I) were not as intense as those arising from 10, 5, and 2 μg NB-SPIONs (panels A–C) and even that of the free NB (panel F).
Figure 7 Pseudo-in situ polymerase chain reaction performed with nanobarcoded superparamagnetic iron oxide nanoparticles (NB-SPIONs). (A) 10 μg NB-SPIONs; (B) 5 μg NB-SPIONs; (C) 2 μg NB-SPIONs; (D) 1 μg NB-SPIONs; (E) 0.5 μg NB-SPIONS; (F) 2.5 μM free NB; (G) HPV18 E7; (H) β-actin; (I) water.
Note: Scale bar is 100 μm.
ISPCR-mediated detection of NB-SPIONs
The first ISPCR experiment with HeLa cells incubated with NB-SPIONs resulted in all samples exhibiting positive DAB samples, including the negative water control. When the supernatants were electrophoresed on an agarose gel, all of the lanes had prominent smears that were not observed in previous control ISPCR experiments (data not shown). To avoid false positives in direct ISPCR, some groups suggest using only cellular smears or cytospin preparations, performing the hot-start ISPCR procedure, and avoiding the application of dry heat on the samples.Citation36,Citation49,Citation50 All of these suggestions have been followed in this experiment, as well as the previous control experiments. Two observations – positive signal in the negative control and DNA smears in the gel – point to NP-induced DNA damage as the culprit. The smears on the gel are most likely due to damage of genomic DNA induced by the NB-SPIONs,Citation51 and the false positives are most likely related to nonspecific incorporation of DIG-dUTP into the nicks and gaps in genomic DNA by primer-independent Taq polymerase- and cycling-dependent “DNA repair.” Thus, the short-term solution in avoiding false positives is to perform ISPCR twice: to repair nicks and gaps in genomic DNA first before attempting to detect the NB-SPIONs. This was done by using only GoTaq Colorless Master Mix diluted in nuclease-free water (no primers, no template, and especially no DIG-dUTP) in the first round, and using the usual ISPCR cocktail in the second round. This strategy was successful in differentiating between the positive and negative controls, as it eliminated the false-positive problem.
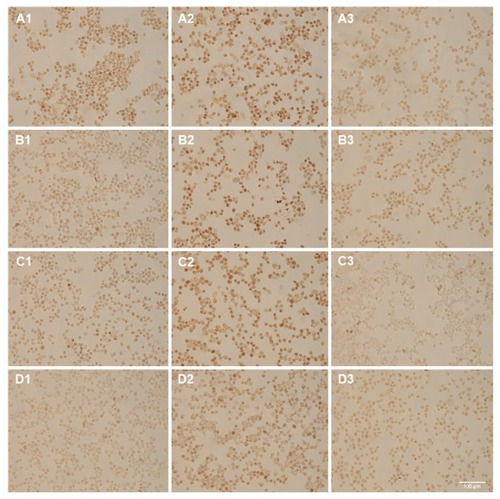
shows ISPCR samples that were incubated with (A) 50 nM, (B) 5 nM, (C) 500 pM, or (D) no NB-SPIONs and assayed for (1) NB, (2) HPV18 E7, and (3) nonspecific background (water). The control samples produced the expected results. Panels D1 and D3 did not produce intense DAB signals. In panel D2, the HPV18 E7 produced intense DAB signals and the expected 172-bp amplicons, which were validated by agarose gel electrophoresis (data not shown). The ISPCR samples that were incubated with ≤5 nM NB- SPIONs (B1 and C1) appear negative when compared to their corresponding negative controls (B3 and C3). However, the ISPCR sample that was incubated with 50 nM NB-SPIONs (panel A1) appears to exhibit some DAB signal intensity over background (panel A3).
Figure 8 In situ polymerase chain reaction (ISPCR) on samples that were incubated with nanobarcoded superparamagnetic iron oxide nanoparticles at (A) 50 nM, (B) 5 nM, (C) 500 pM, or (D) 0 final concentrations for 24 hours.
Notes: ISPCR cocktails contain reverse primer and template (1), HPV18 E7 primers (2), or water (negative control) (3). Scale bar is 100 μm.
Since incubation with 50 nM NB-SPIONs produced a visually detectable DAB signal, the next ISPCR experiment was performed with NB-SPION concentrations clustered around 50 nM (). It appears that 24-hour incubation with NB-SPIONs at concentrations ≥50 nM generates a visually detectable DAB signal (; data for 100 nM concentration not shown). However, it is surprising that the intensity of the DAB signal appears similar at both 50 nM and 200 nM, although the presence of the NB- SPIONs is more pronounced in the higher-concentration sample (orange coloration in ). It is speculated that 50 nM may be the saturation point for the NB system as it is designed.
Figure 9 In situ polymerase chain reaction (ISPCR) on samples that were incubated with nanobarcoded superparamagnetic iron oxide nanoparticles at (A) 200 nM, (B) 50 nM, (C) 25 nM, or (D) 0 final concentrations for 24 hours. The same ISPCR cocktail (containing reverse primer and template) was used for these samples. Control ISPCR samples were performed with (E) human papilloma virus 18 E7 primers or (F) water.
Note: Scale bar is 100 μm.
Discussion
Understanding the biodistribution of NPs is critical for the safe, effective application of nanomedicine. Current approaches to study NP biodistribution have been hampered by a large gap in existing NP detection methods: NPs can either be detected in small amounts in single cells (single-NP, single-cell) or in substantial agglomerates over relatively large areas of biological sample (bulk-NP, bulk-cell). To characterize the biological interactions of a given NP formulation, complementary NP detections need to be performed to gain a comprehensive picture. However, NP-induced effects are often difficult to evaluate as a function of the number of cell-associated NPs, because multiplexed studies are not informative enough due to the aforementioned threshold limitations. Such studies are instead expressed as a function of NP dose, which does not provide much information about the safety and effectiveness of NP components. This rationale paved the way for the development of the nanobarcoding method to close the gap between existing NP detection methods (single-NP, bulk-cell) and to facilitate a means for linking actual intracellular NP concentration to NP-induced effects.
This work demonstrates proof of concept of the nanobarcoding method. The feasibility of the nanobarcoding method was first demonstrated in cell-free systems. Solution-phase PCR of NB-SPIONs reveals specific amplification by the conjugated NB, and amplicons were allowed to migrate through the gel during electrophoresis. This demonstrates the ability of the amplicons to “drift away” from the NB-SPIONs, which is the key to creating the radius of amplified signal necessary for detection inside cells. Moreover, the conjugated NB does not amplify nonspecific sequences in genomic DNA from HeLa, the cell line that served as the in vitro model in this work, indicating that any observed signals are restricted to NB-SPIONs.
Despite these positive results, validation of the nanobarcoding method in cell-based systems was challenging. NB-SPIONs appeared to induce some DNA damage, since nonspecific signals were seen in ISPCR samples in which the reverse primer and template were omitted. It was speculated that the DIG-dUTP was incorporated into nicks and gaps in the damaged DNA, producing the high background signals. The short-term solution was to perform ISPCR thermocycling twice: the first time for Taq-mediated DNA repair and the second time for actual NB amplification. This solution helped differentiate between the positive HPV18 E7 and β-actin controls and the negative water control and allowed the NB-SPION detection signals to emerge. However, the current NB-SPION concentrations were too high to consider the observed threshold as single-NP detection, but further development beyond these feasibility studies may be able to improve the sensitivity. Nevertheless, these results represent a major advance in the difficult area of determining NP biodistributions at single-cell levels. The nanobarcoding method has been shown to rapidly detect NPs over relatively large areas with apparently greater sensitivity than confocal microscopy over smaller areas. This is demonstrated by comparing the ISPCR () and confocal microscopy () results for NB-SPIONs at 50 nM concentration over a 24-hour exposure period.
Although the basic feasibility of the nanobarcoding method has been confirmed, the sensitivity of the current design restricts its power in detecting small numbers of NPs inside single cells. Comparing the results from the pseudo-detection experiment to the actual ISPCR results provides some possible explanations for the lack of sensitivity seen thus far. Pseudo-detection of NB-SPIONs by ISPCR represents the desired results of the nanobarcoding method: the intensity of DAB signal is correlated with the amount of NB-SPIONs present. However, these results were not replicated in actual ISPCR experiments. The major difference between these two sets of experiments is applying the NB-SPIONs postfixation versus prefixation of the ISPCR samples. Nuclease activity within the cells is speculated to have a detrimental effect on NB integrity. Other possible reasons for the lack of sensitivity are inadequacies in the NB system itself, such as deficient NB conjugation, inefficient cellular uptake, and limitations in NB signal amplification.
Moreover, the ISPCR results need to be validated by complementary NP detection methods. Agarose gel electrophoresis of the ISPCR supernatants was performed after each ISPCR experiment, but the expected amplicons were never detected, even though a detection signal was observed in the cells (data not shown). In contrast, the expected amplicons for the HPV18 E7 and β-actin positive controls were always detected in both ISPCR and agarose gel electrophoresis. Since the SPION core is electron-dense, TEM, which is considered the gold standard in single-cell NP detection, should be performed after ISPCR experiments on NB-SPION-treated samples to approximate the amount of NB-SPIONs inside each cell. This is a logical choice, since many protocols have been written on performing ISPCR directly on TEM grids.Citation52,Citation53
The primary goal of future work should be increasing the sensitivity of NP detection. To our knowledge, there are two approaches to improving the sensitivity of the nanobarcoding method: (1) target amplification by optimizing NB on the NP itself; and (2) signal amplification by augmenting the design of the ISPCR protocol. For the first approach, there are multiple ways to amplify the “target,” which can be defined as higher amounts of conjugated NB per NP and/or higher amounts of internalized NPs per cell to increase the detection signal. First, the NP uptake efficiency can be improved by adding targeting ligands (eg, antibodies, peptides) to the NP surfaceCitation54 or maximizing the density of the NB on the NP surface by using different conjugation chemistries and/or reaction schemes.Citation47,Citation55 The former option will definitely decrease the potential density of the NB on the NP surface (and subsequently signal amplification), but will provide the option of targeted cellular uptake. The latter option may also help guard against digestion by endogenous nucleases.Citation43,Citation56 However, the NB may still be susceptible to some level of nuclease digestion to the point where it no longer resembles a functioning PCR primer. The simplest way to increase nuclease stability is to make the NB double-stranded via hybridization to a complementary oligo, since dsDNA is generally more stable than ssDNA.Citation57 Other ways of increasing nuclease stability involve applying chemical modifications most commonly used in the synthesis of antisense oligos. Examples include phosphorothioate, 2-O-methoxyethyl, 2-O-methyl, locked nucleic acid, morpholina, and peptide nucleic acid.Citation58–Citation61 However, it is not known if these chemical modifications can be introduced into the NB without hindering its function as a PCR primer.
The second approach, signal amplification, involves augmenting the design of the ISPCR protocol. Currently, revelation of ISPCR amplicons is mediated by direct DIG detection with POD-linked antibodies and DAB substrate. The most obvious way to amplify the detection signal from ISPCR amplicons is to switch over to indirect DIG detection with primary antibodies against DIG- and POD-linked secondary antibodies. Indirect detection is more sensitive, since each primary antibody can recruit many secondary antibodies for a more intense signal. Another way is to utilize different enzymes (eg, alkaline phosphatase) and/or chromogenic substrates that may be more sensitive and less interfering than DAB (eg, nitroblue-tetrazolium salt or Fast Red 1–5-naphethediol in combination with 5-bromo-4-chloro- 3 indolyl- phosphate).Citation62 In addition, fluorescence-based detection can be used with tyramide signal amplification,Citation50 which has been shown to amplify the detection signal on the order of 500- to 1000-fold when compared to biotin-avidin.Citation63–Citation65
Besides the revelation procedure, another possible way to amplify the detection signal is by lowering the final concentrations of the reverse primer and template in the ISPCR cocktail. This may provide more operational NB:reverse primer and NB:template ratios since the effective concentration of NB may be relatively low due to the small number of NB-NPs present inside the cells. In addition, the cell’s architecture already limits the interactions between the NB, reverse primer, template, and especially the large Taq polymerase molecules. Thus, lowering the concentrations of these reagents may facilitate increased diffusion throughout the cellular architecture, which ensures more targeted amplicon production.Citation66
Increasing the sensitivity of the nanobarcoding method has been stressed throughout this work, but improvements can also be made toward its specificity. Recall that the NB-SPIONs induced nicks and gaps in genomic DNA, allowing the incorporation of DIG-dUTP, which consequently generated high background signals. The short-term solution was performing ISPCR to repair the damaged DNA first and then again to generate NB amplicons. However, this made the sample more susceptible to injury, since the total number of heating cycles and the total time spent above 90°C were doubled. To work around these issues, a combination of PCR and in situ hybridization (PCR-ISH), also known as indirect ISPCR, can be used instead of ISPCR. Here, the detection is based on ISH of a labeled probe to the amplicons, in which revelation occurs in a sequence-specific manner. Although this method is theoretically less sensitive than ISPCR, there is less worry about nonspecific signals and sample damage. Furthermore, future efforts toward improving the sensitivity of the current ISPCR protocol could also help to improve the sensitivity threshold of PCR-ISH.
In addition to improving the specificity of the nanobarcoding method, PCR-ISH would permit the simultaneous detection of more than one NP type in the same sample. In fact, the term “nanobarcoding” itself implies the encoding of information on an NP. The information that can be gained is the amounts and locations of certain NPs based on the color and intensity of the amplified NP detection signal. For example, two NP types are nanobarcoded with unique NB sequences. After administration of these NPs, samples are harvested and prepared for PCR-ISH. After PCR-ISH, the samples are examined for the expected detection signals from each NP type. Depending on the application, the effects of physicochemical properties, targeting mechanisms, route of entry, and nanotoxicity can be studied simultaneously in one sample set. This allows for systematic evaluation of several NP parameters in a reduced sample size with the potential for less measurement error. Essentially, multiple NP biodistribution experiments can be performed on a single animal.
Since NP biodistribution studies are often performed in vivo, the possibility of ex vivo analysis of excised tissues and organs is quite advantageous. It is often difficult to correlate NP dose and administration route to preferential accumulation in relevant tissues or even distinct cell types within those tissues. Thus, future work should look into applying nanobarcoding to NP detection ex vivo in tissues. The basic steps of the nanobarcoding method are still applicable to ex vivo samples, but the required optimizations for tissue sections increase the overall complexity of the procedure. Ex vivo samples can be (1) fixed and then frozen or embedded in paraffin or (2) frozen and then fixed. In addition, the deproteinization step needs to be optimized for each tissue type, since the sample is no longer relatively uniform as it is in vitro. Moreover, other factors need to be considered, such as DNA integrity during tissue processing, presence of Taq polymerase inhibitors, and reduced retention of amplicons due to the loss of intact cell membranes. This stresses the importance of improving the sensitivity of the nanobarcoding method before tackling NP detection in ex vivo samples. Still, the use of the nanobarcoding method ex vivo would make it a disruptive technology that has the potential to qualify in vivo NP biodistribution on a single-cell level.
In summary, the power of the nanobarcoding method will be realized when its sensitivity and specificity can be optimized. First, the sensitivity of NP detection needs to be improved by applying the principles of both target and signal amplification. Second, the specificity can be increased by the introduction of a post-PCR hybridization step (PCR-ISH), which would allow for simultaneous detection of more than one NP type in a single biological sample. Finally, these improvements would pave the way for precise analysis of in vivo NP biodistribution via ex vivo samples, which would be the ultimate utility of the nanobarcoding method.
Conclusion
Today, nanomedicine is expanding the possibilities of controlling and monitoring complex diseases. NPs, the instruments of nanomedicine, are being developed at a rapid pace, with innovative formulations that are often programmed to perform a specific order of functions at the molecular level. However, some of the anticipated benefits of nanomedicine are hyped, due to the lack of predictive models for in vitro and in vivo NP behavior. This work endeavored to facilitate the establishment of such models through the development of the nanobarcoding method, which has the potential to track small numbers or even single NPs for improved NP biodistribution studies at the single-cell level. Herein, proof of concept of the nanobarcoding method has been demonstrated, but the technique needs further development before its widespread use as a standardized assay. Notwithstanding, the wealth of knowledge that can be gained from nanobarcoding has the potential to aid current NP design efforts and redefine regulatory science such that potentially life-saving NP formulations can be realized.
Acknowledgments
The authors thank Aaron B Taylor in the Bioscience Imaging Facility at Purdue University for technical assistance with confocal microscopy and Byron Cheatham and Leslie Krauss from CytoViva Inc, for the hyperspectral imaging data and analysis. They also thank the Christopher Columbus Fellowship Foundation for financial support of this work.
Disclosure
The authors report no conflicts of interest in this work.
References
- HaglundESeale-GoldsmithMMLearyJFDesign of multifunctional nanomedical systemsAnn Biomed Eng200937102048206319169822
- Seale-GoldsmithMMLearyJFNanobiosystemsWiley Interdiscip Rev Nanomed Nanobiotechnol20091555356720049817
- von EschenbachACNanotechnology: A Report of the US Food and Drug Administration Nanotechnology Task Force2007 Available from: http://www.fda.gov/downloads/ScienceResearch/SpecialTopics/Nanotechnology/ucm110856.pdfAccessed July 2, 2012
- ElsaesserATaylorAde YanesGSQuantification of nanoparticle uptake by cells using microscopical and analytical techniquesNanomedicine (Lond)2010591447145721128725
- AlivisatosAPGuWLarabellCQuantum dots as cellular probesAnnu Rev Biomed Eng20057557616004566
- BallouBQuantum dot surfaces for use in vivo and in vitroCurr Top Dev Biol20057010312016338339
- AvivHBartlingSKiesllingFMargelSRadiopaque iodinated copolymeric nanoparticles for X-ray imaging applicationsBiomaterials200930295610561619592085
- RahnHOdenbachSX-ray microcomputed tomography as a tool for the investigation of the biodistribution of magnetic nanoparticlesNanomedicine20094898199019958233
- ChoCFAblackALeongHSZijlstraALewisJEvaluation of nanoparticle uptake in tumors in real time using intravital imagingJ Vis Exp201152280821730939
- MüllerKSkepperJNTangTYAtorvastatin and uptake of ultra-small superparamagnetic iron oxide nanoparticles (Ferumoxtran-10) in human monocyte-macrophages: implications for magnetic resonance imagingBiomaterials200829172656266218377983
- RahimiMWadajkarASubramanianKIn vitro evaluation of novel polymer-coated magnetic nanoparticles for controlled drug deliveryNanomedicine20106567268020172050
- GultepeEReynosoFJJhaveriAMonitoring of magnetic targeting to tumor vasculature through MRI and biodistributionNanomedicine (Lond)2010581173118221039195
- HaglundEMSeale-GoldsmithMMDhawanDPeptide targeting of quantum dots to human breast cancer cellsProc SPIE2008686668660S168660S8
- Al-HajajNAMoquinANeibertKDSolimanGMWinnikFMMaysingerDShort ligands affect modes of QD uptake and elimination in human cellsACS Nano2011564909491821612298
- MengHYangSLiZAspect ratio determines the quantity of mesoporous silica nanoparticle uptake by a small GTPase-dependent macropinocytosis mechanismACS Nano2011564434444721563770
- KumarAPandeyAKSinghSSShankerRDhawanAA flow cytometric method to assess nanoparticle uptake in bacteriaCytometry A201179970771221638764
- ZuckerRMMassaroEJSandersKMDegnLLBoyesWKDetection of TiO2 nanoparticles in cells by flow cytometryCytometry A201077767768520564539
- ChoiJZhengQKatzHEGuilarteTRSilica-based nanoparticle uptake and cellular response by primary microgliaEnviron Health Perspect2010118558959520439179
- CorbalanJJMedinaCJacobyAMalinskiTRadomskiMWAmorphous silica nanoparticles trigger nitric oxide/peroxynitrite imbalance in human endothelial cells: inflammatory and cytotoxic effectsInt J Nanomedicine201162821283522131828
- PeckysDBde JongeNVisualizing gold nanoparticle uptake in live cells with liquid scanning transmission electron microscopyNano Lett20111141733173821410218
- ZhongLZengGLuXNSOM/QD-based direct visualization of CD3-induced and CD28-enhanced nanospatial coclustering of TCR and coreceptor in nanodomains in T cell activationPLoS One200946e594519536289
- ZhongLZhangZLuXNSOM/QD-based fluorescence-topographic image fusion directly reveals nano-spatial peak-valley polarities of CD69 and CD71 activation molecules on cell-membrane fluctuations during T-cell activationImmunol Lett20111401–2445121704079
- ChangBJLinSHChouLJChiangSYSubdiffraction scattered light imaging of gold nanoparticles using structured illuminationOpt Lett201136244773477522179879
- SchübbeSCaveliusCSchumannCKochMKraegelohASTED microscopy to monitor agglomeration of silica particles inside A549 cellsAdv Eng Mater2010125417422
- GuptaAKBerryCGuptaMCurtisAReceptor-mediated targeting of magnetic nanoparticles using insulin as a surface ligand to prevent endocytosisIEEE Trans Nanobioscience20032425526115376916
- GuptaAKGuptaMCytotoxicity suppression and cellular uptake enhancement of surface modified magnetic nanoparticlesBiomaterials200526131565157315522758
- HuangXPengXWangYShinDMEl-SayedMANieSA reexamination of active and passive tumor targeting by using rod-shaped gold nanocrystals and covalently conjugated peptide ligandsACS Nano20104105887589620863096
- ZhangXXingJZChenJEnhanced radiation sensitivity in prostate cancer by gold-nanoparticlesClin Invest Med2008313E160E16718544279
- ZhuZJGhoshPSMirandaORVachetRWRotelloVMMultiplexed screening of cellular uptake of gold nanoparticles using laser desorption/ionization mass spectrometryJ Am Chem Soc200813043141391414318826222
- DeeringCETadjikiSAssemiSMillerJDYostGSVeranthJMA novel method to detect unlabeled inorganic nanoparticles and submicron particles in tissue by sedimentation field-flow fractionationPart Fibre Toxicol200851819055780
- ChavanpatilMDKhdairAPanyamJSurfactant-polymer nanoparticles: a novel platform for sustained and enhanced cellular delivery of water-soluble moleculesPharm Res200724480381017318416
- DavdaJLabhasetwarVCharacterization of nanoparticle uptake by endothelial cellsInt J Pharm20022331–2515911897410
- Ece GamsizDShahLKDevalapallyHAmijiMMCarrierRLA model predicting delivery of saquinavir in nanoparticles to human monocyte/macrophage (Mo/Mac) cellsBiotechnol Bioeng200810151072108218553495
- LinAChenJLiuYPreparation and evaluation of N-caproyl chitosan nanoparticles surface modified with glycyrrhizin for hepatocyte targetingDrug Dev Ind Pharm200935111348135519832635
- DiCarloDLeeLPDynamic single cell analysis for quantitative biologyAnal Chem200678237918792517186633
- NuovoGJPCR in Situ Hybridization: Protocols and Applications3rd edPhiladelphiaLippincott-Raven1997
- BagasraOProtocols for the in situ PCR-amplification and detection of mRNA and DNA sequencesNat Protoc20072112782279518007614
- BagasraOIn situ polymerase chain reaction and hybridization to detect low-abundance nucleic acid targetsCurrent Protocols in Molecular BiologyHoboken, NJJohn Wiley & Sons, Inc2001
- EustaquioTLearyJFSingle nanoparticle detection by DNA barcoding for biodistribution studies in nanomedicine United States patent application 61/363.898; filed2010
- EustaquioTLearyJFNanobarcoding: a novel method of single nanoparticle detection in cells and tissues for nanomedical biodistribution studiesProc SPIE2011809980990V-180990V-13
- EustaquioTCooperCLLearyJFSingle-cell imaging detection of nanobarcoded nanoparticle biodistributions in tissues for nanomedicineProc SPIE2011791079100O-179100O-11
- LesnikovaILidangMHamilton-DutoitSKochJRapid, sensitive, type specific PCR detection of the E7 region of human papillomavirus type 16 and 18 from paraffin embedded sections of cervical carcinomaInfect Agent Cancer2010521520205796
- SeferosDSPrigodichAEGiljohannDAPatelPCMirkinCAPolyvalent DNA nanoparticle conjugates stabilize nucleic acidsNano Lett20099130831119099465
- LerouxJCDe JaeghereFAnnerBDoelkerEGurnyRAn investigation on the role of plasma and serum opsonins on the internalization of biodegradable poly(D,L-lactic acid) nanoparticles by human monocytesLife Sci19955776957037637541
- SharmaVKAggregation and toxicity of titanium dioxide nanoparticles in aquatic environment – a reviewJ Environ Sci Health A Tox Hazard Subst Environ Eng200944141485149520183505
- CutlerJIZhengDXuXYGiljohannDAMirkinCAPolyvalent oligonucleotide iron oxide nanoparticle “click” conjugatesNano Lett20101041477148020307079
- GiljohannDASeferosDSPatelPCMillstoneJERosiNLMirkinCAOligonucleotide loading determines cellular uptake of DNA-modified gold nanoparticlesNano Lett20077123818382117997588
- PatelPCGiljohannDADanielWLZhengDPrigodichAEMirkinCAScavenger receptors mediate cellular uptake of polyvalent oligonucleotide-functionalized gold nanoparticlesBioconjug Chem201021122250225621070003
- LongAAKomminothPLeeEWolfeHJComparison of indirect and direct in-situ polymerase chain reaction in cell preparations and tissue sections. Detection of viral DNA, gene rearrangements and chromosomal translocationsHistochemistry19939921511628386712
- WiedornKHKuhlHGalleJCaselitzJVollmerEComparison of in-situ hybridization, direct and indirect in-situ PCR as well as tyramide signal amplification for the detection of HPVHistochem Cell Biol19991112899510090569
- SinghNJenkinsGJAsadiRDoakSHPotential toxicity of super-paramagnetic iron oxide nanoparticles (SPION)Nano Rev20101
- MorelGRaccurtMPCR/RT-PCR in Situ Light and Electron MicroscopyBoca RatonCRC Press2003
- BagasraOHansenJIn-Situ PCR TechniquesNew YorkWiley-Liss1997
- SealeMMDesign of Targeted Nanoparticles for Multifunctional Nanomedical SystemsPhD thesisWest LafayetteBiomedical Engineering, Purdue University2009
- HurstSJLytton-JeanAKRMirkinCAMaximizing DNA loading on a range of gold nanoparticle sizesAnal Chem200678248313831817165821
- ZwanikkenJWGuoPJMirkinCAde la CruzMOLocal ionic environment around polyvalent nucleic acid-functionalized nanoparticlesJ Phys Chem C2011115331636816373
- EderPSDeVineRJDagleJMWalderJASubstrate specificity and kinetics of degradation of antisense oligonucleotides by a 3′ exonuclease in plasmaAntisense Res Dev1991121411511841656
- AkhtarSKoleRJulianoRLStability of antisense DNA oligodeoxy-nucleotide analogs in cellular extracts and seraLife Sci19914924179318011943483
- GleaveMEMoniaBPAntisense therapy for cancerNat Rev Cancer20055646847915905854
- KimDWKimJHParkMModulation of biological processes in the nucleus by delivery of DNA oligonucleotides conjugated with gold nanoparticlesBiomaterials201132102593260421251710
- RosiNLGiljohannDAThaxtonCSLytton-JeanAKHanMSMirkinCAOligonucleotide-modified gold nanoparticles for intracellular gene regulationScience200631257761027103016709779
- HurtadoRMikawaTEnhanced sensitivity and stability in two-color in situ hybridization by means of a novel chromagenic substrate combinationDev Dyn2006235102811281616894600
- AndrasSCPowerJBCockingECDaveyMRStrategies for signal amplification in nucleic acid detectionMol Biotechnol2001191294411697219
- WernerMVon WasielewskiRKomminothPAntigen retrieval, signal amplification and intensification in immunohistochemistryHistochem Cell Biol199610542532609072182
- MerzHMalisiusRMannweilerSImmunoMax. A maximized immunohistochemical method for the retrieval and enhancement of hidden antigensLab Invest19957311491567541493
- AltshulerMLPCR Troubleshooting: The Essential GuideHethersettCaister Academic Press2006