Abstract
Polarized surface-enhanced Raman scattering (SERS) spectroscopy was applied for obtaining biochemical information about the seminal plasma. The effect of different laser polarizations (nonpolarized, linear-polarized, right-handed circularly polarized, and left-handed circularly polarized) on seminal plasma SERS spectroscopy was explored for the first time. The diagnostic performance in differentiating abnormal seminal plasma (n = 37) from normal seminal plasma (n = 24) was evaluated. A combination of principal component analysis (PCA) and linear discriminant analysis (LDA) was employed to develop diagnostic algorithms. Classification results of different laser polarizations demonstrated different diagnostic sensitivities and specificities, among which, left-handed circularly polarized laser excitation showed the best diagnostic result (95.8% sensitivity and 64.9% specificity). Our exploratory study demonstrated that SERS spectroscopy with left-handed circularly polarized laser excitation has the potential for becoming a new diagnostic method in semen-quality assessment.
Introduction
In recent years, the infertility rate in married couples has been as high as 10%–15%, with male infertility comprising the majority of cases. Routine semen analysis based on microscopy and specialized software programs includes examination of such sperm parameters as concentration, motility, and vitality. However, this method is imprecise and subjective. In addition, advanced research involving gene technology on spermatozoa’s DNA/RNA analysis is time-consuming and labor-intensive, and thus not practical for routine clinical use.Citation1 It is known that semen consists of a cellular part and noncellular part, and seminal plasma (the noncellular part) has been found to be related to spermatozoa function. Moreover, seminal plasma could adjust spermatozoa tolerance, and even influence male fertility.Citation2 Thus, it is plausible to suggest that analysis of seminal plasma can predict sperm quality and has the potential to assess male fertility. We have conducted a pilot study and demonstrated the potential of Raman spectroscopy for characterizing and differentiating normal semen samples from abnormal subjects.Citation3 However, it is challenging to apply conventional Raman technique for clinical applications due to the inherent weakness of conventional Raman signals.
Surface-enhanced Raman scattering (SERS) was first discovered by Fleischman et al in 1974.Citation4 Instead of weak signals provided by regular Raman spectroscopy, the SERS technique demonstrates as much as 1013–1015 times the Raman signal enhancement, and simultaneously, the fluorescence background is greatly reduced.Citation5 The use of SERS has grown exponentially in the past three decades,Citation6 and has been widely applied to biochemical study. In recent years, the SERS applications were successfully used for detecting biological materials, with good stability and reproducibility (eg, SERS Raman spectra of DNA/RNA,Citation7 cells,Citation8 and glucoseCitation9). In our previous studies, we have successfully explored the application of SERS spectroscopy for cancer diagnosis based on blood plasma.Citation10–Citation12 Similar to blood plasma, the seminal plasma contains abundant information about the status of reproductive organs, and thus can be used to assess male fertility.
It is known that polarized SERS spectroscopy is a powerful and valuable technique for obtaining molecule-specific information.Citation13 Nanostructured substrates studied by SERS are expected to be anisotropic in terms of the local surface plasmon resonances, which imply that the enhancement factor should extrinsically depend on the incident polarization. Citation14 A nonpolarized or linear-polarization configuration had been used in most biomedical SERS studies. However, we performed one study on blood plasma under different polarization excitations and found that left-handed circularly polarized excitation led to the best result for gastric cancer detection.Citation10 Most biomolecules are chiral molecules, such as phosphatases, aminopeptidases, glycosidases, hyaluronidase, and mucin,Citation15 which are also present in the seminal plasma. This motivated us to consider a polarized SERS study on seminal plasma.
In this work, human seminal plasma was first inspected by using SERS spectroscopy with different polarized excitations, and specific Raman bands obtained in seminal plasma are discussed in detail. Then, the principal component analysis–linear discriminant analysis (PCA-LDA) method of multivariate statistical analysis was employed to compare the outcomes of SERS spectra under different polarized laser excitations (including nonpolarized, linear-polarized, and circularly polarized).
Materials and methods
Preparation of silver nanoparticles
Stable silver (Ag) nanoparticle solutions were prepared by a simple and fast chemical reduction method according to the report by Leopold and Lendl.Citation16 In short, 4.5 mL of 0.1 M sodium hydroxide solution was added to 5 mL hydroxylamine hydrochloride solution (6 × 10⁻² M). Then, the mixture was added rapidly to 90 mL AgNO3 solution (1.1 × 10⁻³ M) while stirring, until the colloid showed a milky gray color. The Ag colloids were concentrated by centrifugation at 10,000 rpm for 10 minutes and then were kept in the dark at room temperate.
Human semen sample collection and seminal plasma preparation
In this work, all 61 semen samples (24 normal and 37 abnormal) were obtained from the Fujian Provincial Hospital. The normal and abnormal samples were classified according to World Health Organization (WHO) examination of human semen criteria.Citation1 For the normal group, parameters such as sperm volume (between 2 mL and 6 mL), concentration (>20 × 106/mL), motility (>40%) in semen samples met the criteria. For the abnormal group, only those samples with low volume, low concentration, and weak motility (diagnosed by standard criteria) were selected in our study. All semen samples were kept at room temperature and immediately transported to our laboratory. Then, spermatozoa were removed by centrifugation at 3000 rpm for 10 minutes in an Eppendorf centrifuge to obtain the seminal plasma. A pipette tip was used to create a mixture containing the seminal plasma and the Ag colloids in 1:1 proportions. Then, the mixture was transferred to a rectangular aluminum plate for SERS measurements.
SERS measurements
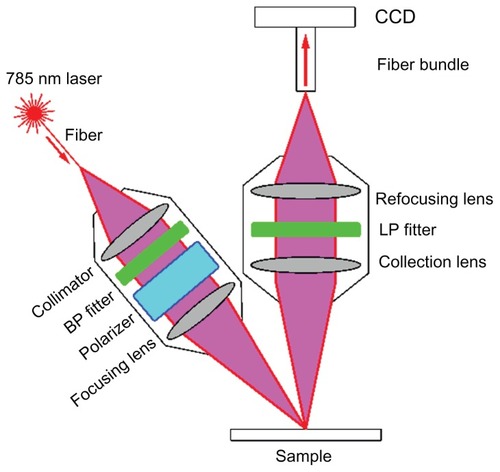
A fiber-optic Raman system was used for all SERS measurements. The SERS spectra collected were in the range of 600–1770 cm−1 under a 785 nm laser excitation with a spectral resolution of 8 cm−1. The details of this system were described by Feng et alCitation10 and Huang et al.Citation17 In short, we added different polarizers to the Raman probe to excite the sample with differently polarized laser light. shows the configuration of the polarized Raman probe. In order to obtain left-handed or right-handed circularly polarized excitations, a left-handed circular polarizer or right-handed circular polarizer (Meadowlark Optics Inc, Frederick, CO) was employed. As is known, flipping the circular polarizer and letting light pass through it in the opposite direction will produce linear-polarized light, and by removing, the polarizer we can obtain nonpolarized light. Once the mixture was prepared, the spectra were immediately collected with a 15-second integration time. WinSpec32 software (Princeton Instruments, Trenton, NJ) was used to remove any cosmic ray interference during data collection. Then, the fluorescence background was removed using a modified multipolynomial fitting algorithm program previously described by Zhao et al.Citation18 After that, each measured set of spectra were normalized to the integrated area under the curve in the range of 600–1770 cm−1.
Figure 1 The configuration of the polarized Raman probe.
Abbreviations: BP, band pass; CCD, charge-coupled device; LP, long pass.
Statistical analysis
PCA coupled with LDA was employed to analyze seminal plasma SERS spectra. PCA can simplify complex data sets and determine the key variables in multidimensional data sets, and is therefore frequently used in spectroscopic data analysis. LDA is a method used for maximizing the variance between groups and minimizing the variance within groups, by computing linear combinations of variables to determine directions in the spectral space. In our experiment, after background subtraction and normalization, all SERS-spectra data sets were loaded into the SPSS software package (IBM Inc, Armonk, NY) for PCA-LDA analysis. In brief, PCA was first initiated to define a few variables for the principal components (PCs), to represent the original data. Following that, independent-sample t-test was performed on all these PCs of the principal components. LDA was then used to generate diagnostic algorithms using these two most significant PCs. The performance of the diagnostic algorithms rendered by the LDA models for correctly predicting the seminal plasma status (ie, abnormal vs normal) underlying each spectrum was estimated with the leave-one-out, cross-validation method.
Results
SERS spectra
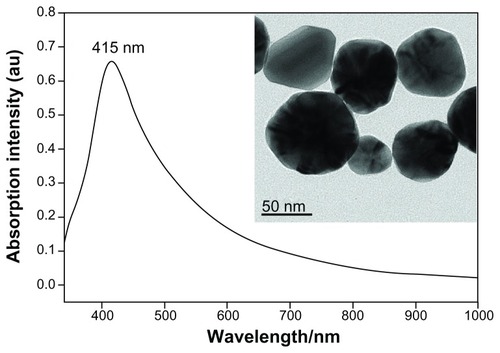
shows the UV/visible absorption spectrum of the Ag colloid, with the maximum absorption located at 415 nm. The photograph in the figure is a transmission electron microscopy photograph of the prepared Ag nanoparticles. These particles show a mean diameter of 45 nm, with a standard deviation of 6 nm.
Figure 2 The UV/visible absorption spectrum of the Ag colloid with a maximum absorption peak located at 415 nm.
Note: The inserted photograph shows the TEM micrograph of Ag nanoparticles.
Abbreviations: UV, ultraviolet; TEM, transmission electron microscopy.
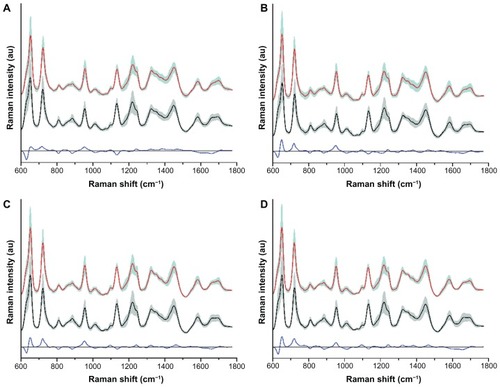
Shown in and are four SERS spectra obtained from the same seminal plasma sample under different types of excitation (nonpolarized laser, linear-polarized laser, right-handed circularly polarized laser, and lefthanded circularly polarized laser). By comparison, the five SERS peaks of 645, 720, 1220, 1445, and 1584 cm−1 showed clear differences under different polarized excitations. Therefore, it is interesting to study the differences between the spectra under the excitation of different laser polarizations. shows the comparison of the normalized mean SERS spectra obtained from the 24 normal and 37 abnormal seminal plasma samples under different polarized laser excitations. The standard deviations are shown in each subgraph of ; moreover, at the bottom of each subgraph are the difference spectra (normal minus abnormal). For the normal and abnormal seminal plasma, the SERS peaks at 649, 720, 809, 954, 1132, 1220, 1445, and 1584 cm−1 can be clearly identified. Through careful comparison, we found that the SERS peaks at 649, 720, and 954 and 1584 cm−1 were more intense in the normal group than those in abnormal group. In contrast, the peaks at 809 and 1132 cm−1 were more intense in the abnormal group, as shown in . shows a similar tendency of the SERS spectra under the excitation of different laser polarizations.
Table 1 The Raman intensities (au) at five peaks for each of the four spectral curves obtained at polarized excitations
Figure 3 Comparison of the SERS spectra from a seminal plasma sample under different types of excitation (nonpolarized laser, linear-polarized laser, right-handed circularly polarized laser, and left-handed circularly polarized laser).
Abbreviation: SERS, surface-enhanced Raman scattering.
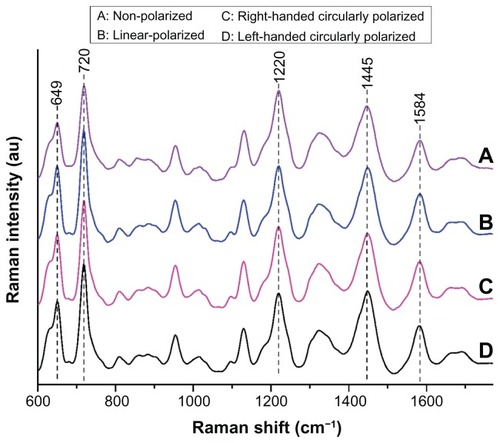
Figure 4 Comparison of the mean SERS spectra with different polarized laser excitations for the normal seminal plasma (red line, n = 24) versus that of the abnormal (black line, n = 37). (A) Excited by nonpolarized laser; (B) excited by linear polarization laser; (C) excited by right-handed circularly polarized laser; (D) excited by left-handed circularly polarized laser.
Notes: The shaded areas represent the standard deviations of the mean value. Also shown at the bottom of each graph are the difference spectra.
Abbreviation: SERS, surfaced-enhanced Raman scattering.
Results of statistical analysis
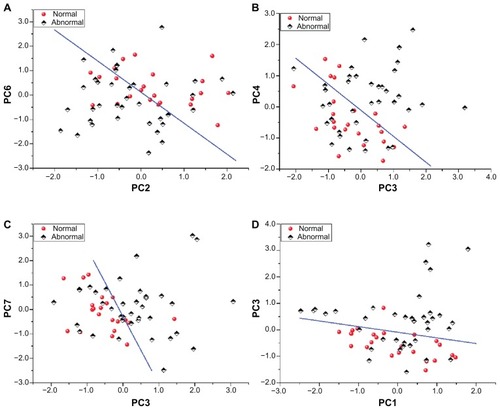
To discriminate normal and abnormal groups, two most significant PCs in each of the SERS data set were selected. Independent-sample t-tests on all the PC scores between the normal group and the abnormal group showed that there were always only two PCs in each of the four data sets that were significantly different for the two groups. They were (PC2 and PC6) for the non-polarized laser excitation data set, (PC3 and PC4) for the linear-polarized laser excitation, (PC3 and PC7) for the right-handed circularly polarized laser excitation, and (PC1 and PC3) for the left-handed circularly polarized laser excitation, respectively. shows scatterplots of the two PCs for the normal group and the abnormal group under different polarized laser excitations. The corresponding separation lines in each subgraph differentiate normal from abnormal seminal plasma with the optimal diagnostic results (shown in ).
Table 2 Comparison of the diagnostic sensitivity and specificity with different polarized laser excitations
Figure 5 Comparison of scatterplots of the two PCs for the normal group (red circle) and the abnormal group (black rhombus) under different polarized laser excitations. (A) Excited by nonpolarized laser. The solid line (PC6 = −1.27 PC2 + 0.118). (B) Excited by linear polarization laser. The solid line (PC4 = −0.84 PC3 − 0.112). (C) Excited by right-handed circularly polarized laser. The solid line (PC7 = −2.78 PC3 − 0.279). (D) Excited by left-handed circularly polarized laser. The solid line (PC3 = −0.212 PC1 + 0.439).
Abbreviation: PC, principal components.
Discussion
SERS spectra
The SERS spectra of seminal plasma reflected the biological molecular information, such as citric acid, guanine, and cellulose. In our exploratory study, in accord with the literature,Citation3,Citation19,Citation20 we tentatively assigned different SERS bands corresponding to different biological molecules. In the spectral range of 600–1770 cm−1, our assignments of SERS bands of seminal plasma are listed in . Distinctive SERS features and intensity differences between normal and abnormal seminal plasma could reflect molecular changes associated with the process of sperm abnormality. For example, the band at 649 cm−1 was attributed to the guanine ring breathing mode,Citation20 indicating higher content of guanine in the normal group than in the abnormal group. The relative SERS peak intensity at 720 cm−1 due to coenzyme A was found to be lower in the abnormal group than in the normal group. The peak at 954 cm−1, which can be attributed to the spermine phosphate hexahydrate, was higher in the normal group than that in the abnormal group, suggesting a lower percentage or low activity of spermine phosphate hexahydrate in abnormal seminal plasma. This zymoprotein produced by the prostate might affect spermatozoa activity, and has been related to the probability of fertilization.
Table 3 SERS bands of measured range and their peak assignmentsCitation3,Citation19,Citation20
In , different spectra are shown at the bottom of , revealing the band positions where significant differences exist. For example, when under the circularly polarized and linear-polarized excitation, the peak at 649 cm−1 of the different spectra appears to increase. The fact that biological molecules have chirality might explain this phenomenon. The tiny changes in the stereo structures of biomolecules might have changed the chiral property, which may be indistinguishable under nonpolarized laser excitation, but the stereo structures showed more differences under circularly polarized laser excitation.
Statistical analysis
Comparing the four scatterplots in and , it was found that the different diagnostic sensitivities and specificities were associated with different polarized laser excitations. As shown in , left-handed circularly polarized laser excitation had the best sensitivity (95.8%), and nonpolarized laser excitation had the highest specificity (67.6%); but left-handed circularly polarized laser excitation exhibited a magnitude of diagnostic specificity (64.9%) similar to that of nonpolarized laser excitation. Moreover, compared with our previous regular Raman result,Citation3 the diagnostic sensitivity was greatly improved, but the diagnostic specificity decreased. This means that by using these methods, identifying the true abnormal samples was not unsatisfactory, but the true normal seminal plasma sample could be detected well, especially when using left-handed circularly polarized laser excitation.
As described by Berova and NakanishiCitation21 and by Barron,Citation22 most biological molecules are chiral. Typical naturally occurring proteins made of L amino acids are known as left-handed proteins, whereas D amino acids produce right-handed proteins. Based on the theory of the polarization characteristics of Raman scattering by chiral molecules, the scattered signals excited by right-handed and left-handed circularly polarized light are slightly different.Citation23 When pathological changes occur in biomolecules, the stereo structures of biomolecules might be slightly altered, leading to possible changes in chirality, and once they have interacted with other chiral objects, such as a circularly polarized laser, the change in the biomolecules’ chirality becomes distinguishable. Circularly polarized lasers produce superhelical electromagnetic fields is chiral objects.Citation24 That means the change in biomolecular chirality would be amplified when interacting with the circularly polarized laser. Our data reveal that left-handed circularly polarization gives relatively better diagnostic results that do the alternatives. It seems that in normal seminal plasma, the left-handed proteins were relatively dominant in terms of content. However, determining the exact mechanisms involved requires further investigation.
Conclusion
To the best of our knowledge, this is the first time that polarized SERS was applied to analyze seminal plasma from normal and abnormal samples. Comparing the results of PCA-LDA multivariate analysis of the SERS spectra data obtained, the use of circularly polarized laser excitation improved diagnostic sensitivity. With nonpolarized laser excitation, both the sensitivity and specificity were around 70%, whereas high diagnostic performance was achieved by left-handed circularly polarized laser excitation (95.8% sensitivity, 64.9% specificity). Our results from this exploratory study demonstrate that SERS spectroscopy combined with left-handed circularly polarized laser excitation provides a promising alternative for semen-quality assessment.
Acknowledgment/disclosure
This work was supported by the National Natural Science Foundation of China (Grant No 61210016, 61178090, 81101110, and 11104030), Project of Fujian Provincial Department of Education (type B: JB11021) and Program for Changjiang Scholars and Innovative Research Team in University (IRT1115), the Science and Technology Project of Fujian Province (No 2012 J05004), the Project of the Educational Office of Fujian Province (No JA11055), and the Canadian Institutes of Health Research International Scientific Exchange Program. The authors report no conflicts of interest in this work.
References
- World Health OrganizationWHO Laboratory Manual for the Examination and Processing of Human SemenWorld Health Organization2010
- Rodríguez-MartínezHKvistUErnerudhJSanzLCalveteJJSeminal plasma proteins: what role do they play?Am J Reprod Immunol201166112221726334
- HuangZChenXChenYRaman spectroscopic characterization and differentiation of seminal plasmaJ Biomed Opt20111611050111050322112099
- FleischmannMHendraPMcQuillanARaman spectra of pyridine adsorbed at a silver electrodeChem Phys Lett1974262163166
- KneippKMoskovitsMKneippHSurface-enhanced Raman scatteringPhys Today200760114046
- SharmaBFrontieraRRHenryAIRingeEVan DuyneRPSERS: materials, applications, and the futureMater Today (Kidlington)20121511625
- BellSEJSirimuthuNMSSurface-enhanced Raman spectroscopy (SERS) for sub-micromolar detection of DNA/RNA mononucleotidesJournal of the American Chemical Society200612849155801558117147354
- NolanJPDugganELiuECondelloDDaveIStonerSASingle cell analysis using surface enhanced Raman scattering (SERS) tagsMethods201257327227922498143
- StuartDAYuenJMShahNIn vivo glucose measurement by surface-enhanced Raman spectroscopyAnal Chem200678207211721517037923
- FengSChenRLinJGastric cancer detection based on blood plasma surface-enhanced Raman spectroscopy excited by polarized laser lightBiosens Bioelectron20112673167317421227679
- FengSChenRLinJNasopharyngeal cancer detection based on blood plasma surface-enhanced Raman spectroscopy and multivariate analysisBiosens Bioelectron201025112414241920427174
- LinDFengSPanJColorectal cancer detection by gold nanoparticle based surface-enhanced Raman spectroscopy of blood serum and statistical analysisOpt Express20111914135651357721747512
- LeeSJBaikJMMoskovitsMPolarization-dependent surface-enhanced Raman scattering from a silver-nanoparticle-decorated single silver nanowireNano Lett20088103244324718767889
- XuHKällMPolarization-dependent surface-enhanced Raman spectroscopy of isolated silver nanoaggregatesChemphyschem2003491001100514562448
- DuncanMWThompsonHSProteomics of semen and its constituentsProteomics Clin Appl20071886187521136740
- LeopoldNLendlBA new method for fast preparation of highly surface-enhanced Raman scattering (SERS) active silver colloids at room temperature by reduction of silver nitrate with hydroxylamine hydrochlorideJ Phys Chem B20031072457235727
- HuangZZengHHamzaviIMcLeanDILuiHRapid near-infrared Raman spectroscopy system for real-time in vivo skin measurementsOpt Lett200126221782178418059697
- ZhaoJLuiHMcLeanDIZengHAutomated autofluorescence background subtraction algorithm for biomedical Raman spectroscopyAppl Spectrosc200761111225123218028702
- De GelderJDe GussemKVandenabeelePMoensLReference database of Raman spectra of biological moleculesJ Raman Spectrosc200738911331147
- OhWSKimMSSuhSWSurface-enhanced Raman scattering (SERS) of nucleic acid components in silver sol: guanine seriesJ Raman Spectrosc1987184253258
- BerovaNNakanishiKCircular Dichroism: Principles and ApplicationsNew YorkVch Verlagsgesellschaft Mbh2000
- BarronLDMolecular Light Scattering and Optical ActivityCambridge University Press2004
- Surface enhanced Raman optical activity (SEROA)2008 Available from: http://pubs.rsc.org/en/content/articlelanding/2008/cs/b707862pAccessed December, 1 2012
- YangNTangYCohenAESpectroscopy in sculpted fieldsNano Today200943269279