
Abstract
Introduction
The increasing use of gold nanoparticles (Au NPs) in the medical field has raised concerns about the potential adverse effect of Au NPs exposure. However, it is difficult to assess the health risks of Au NPs exposure at the individual organ level using current measurement techniques.
Methods
The physical and chemical properties of Au NPs were characterized by transmission electron microscope (TEM), Fourier transform infrared (FTIR), and zeta sizer. The RNA-seq data of Au NPs-exposed worms were analyzed. The food intake was measured by liquid culture and Pharyngeal pumping rate. The function of the smell and taste neurons was evaluated by the chemotaxis and avoidance assay. The activation of ASE neurons was analyzed by calcium imaging. The gene expression of ins-22 and egl-19 was obtained from the C. elegans single cell RNA-seq databases.
Results
Our data analysis indicated that 62.8% of the significantly altered genes were functional in the nervous system. Notably, developmental stage analysis demonstrated that exposure to Au NPs interfered with animal development by regulating foraging behavior. Also, our chemotaxis results showed that exposure to Au NPs reduced the sensation of C. elegans to NaCl, which was consistent with the decrease in calcium transit of ASEL. Further studies confirmed that the reduced calcium transit was dependent on voltage-gated calcium channel EGL-19. The neuropeptide INS-22 was partially involved in Au NPs-induced NaCl sensation defect. Therefore, we proposed that Au NPs reduced the calcium transit in the ASEL neuron through egl-19-dependent calcium channels. It was partially regulated by the DAF-16 targeting neuropeptide INS-22.
Discussion
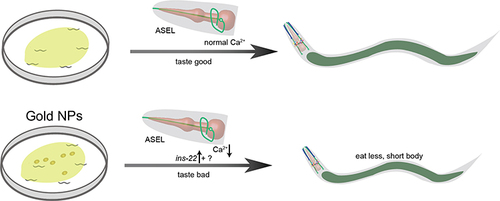
Our results demonstrate that Au NPs affect food sensation by reducing the calcium transit in ASEL neurons, which further leads to reduced pharynx pumping and feeding defects. The toxicology studies of Au NPs from worms have great potential to guide the usage of Au NPs in the medical field such as targeted drug delivery.
Graphical Abstract
Introduction
Au NPs have become one of the most studied nanomaterials in biomedical applications due to their physical/chemical stability and special optical properties. In recent decades, the interactions between engineered Au NPs and liver, kidney, blood vessels, and tumors have been studied.Citation1–4 Additionally, Au NPs can partially penetrate the blood-brain barrier in the brain, allowing them to function in the central nervous system.Citation5 Targeted drug delivery using Au NPs has been tested in tumors, the liver, lung, and inhalation.Citation6–9 Recent research showed specific modified Au NPs have antibacterial activityCitation10 antioxidant activities,Citation11 and detect SARS-CoV-2.Citation12 Although relatively low toxicity has been reported on Au NPs, most researchers agree that exposure to nano-scale materials can lead to chronic toxicity, which may be due to the responses at the gene and protein level.Citation13,Citation14
Biodistribution is a key factor in understanding how nanoparticles (NPs) accumulate and interact with each organ. Current quantification techniques require the isolation of each internal organ or the fluorescent/radio imaging modalities to modulate the entire animal. In addition to the biodistribution of the NPs, understanding how each organ responds to NPs in vivo is a huge challenge in humans, but it is possible in small animals. Studies on rabbits showed that 250 nm Polyethylene glycol (PEG) coated nanoparticles were mostly sequestered in the spleen and liver. However, 150 nm PEG coated nanoparticles were mostly found in the bone marrow.Citation15 The inhalation rat model showed that silver (Ag) NPs was accumulated in lung, liver, brain, the olfactory bulb, kidney, and spleen.Citation16–18 The laser-synthesized TiN NPs were mainly accumulated in the liver and spleen.Citation19 Au NPs show a similar biodistribution trend as PEG coated NPs or AgNPs. Studies on mice have shown that 13 nm Au NPs coated with PEG were mainly deposited in the liver, kuffer cells, and spleen.Citation20,Citation21 While some studies on rats have shown that 18 nm Au NPs accumulated in the liver and spleen, 1.4 nm NPs were mainly in the kidney.Citation22 The intestine of C. elegans, has the combined function of the liver, spleen, and kidney, accumulating most of the Au NPs.Citation23 Although these organs accumulate Au NPs, how each organ responds to the Au NPs and how the expression of genes in each tissue restores homeostasis is still largely unknown.
Although Au NPs did not accumulate in the nervous system, evidence has been reported that Au NPs modulate neural activity in multiple nervous systems.Citation24,Citation25 It has been shown that Au NPs increase neurite length, promote adhesion and proliferation, change the action potentials, and affect Ca2+ influx.Citation26–28 Furthermore, engineered Au NPs were able to bind to sodium channels, transient receptor potential vanilloid member 1 channels, and P2X3 receptor ion channel in dorsal root ganglion neurons, thereby affecting the neuron–neuron communication.Citation25
Despite the numerous in vivo and in vitro cytotoxicity studies that have been studied on Au NPs, the results vary depending on the cell type used, exposure time, the physical and chemical properties, and the surface modification of nanomaterials. In vitro studies using human oral cancer cells (HSC-3) have demonstrated that Au NPs enter the cytoplasm, mitochondria, and nucleus. Few publications claim toxicity of Au NPs at a lower concentration than 1 ppm.Citation29 However, when increased to 10 ppm or higher, increased expression of apoptosis, oxidative stress, and pro-inflammatory genes was reported.Citation30 Apoptosis, autophagy, DNA damage, and necrosis were also observed in HSC-3, HeLa cells, and BALB/c mice liver studies.Citation31–33 Furthermore, it has been shown that the higher levels of oxidative stress generated by the large surface of Au NPs could cause DNA and Mitochondrial damage, further destroying cellular homeostasis.Citation32
C. elegans is a small transparent animal with multiple important signaling pathways conserved in mammals, like autophagy, insulin, and apoptosis signaling pathways.Citation34 Here, we analyzed RNA sequencing data from Au NPs-exposed worms. However, different from the biodistribution data, the results indicated that the nerve system was the most affected when C. elegans were exposed to Au NPs. Further studies showed that the neuropeptide INS-22, a target gene of the transcription factor DAF-16, partially regulates the loss of food sensation induced by Au NPs. The calcium transit analysis indicated that the ASEL neurons reduced the calcium transit induced by Au NPs, which could be the dir way how Au NPs affect food sensation.
Materials and Methods
Characterization of Au NPs
Au NPs (40 nm) were purchased from Biotech (Jieyi, Shanghai). NPs were suspended in Milli-Q water (Millipore, 18MΩcm), and then diluted in S medium (1L H2O, 5.85g NaCl, 1g K2HPO4, 6g KH2PO4, 10mL 1M potassium citrate pH6, 0.0186g disodium EDTA, 0.0069g FeSO4 •7H2O, 0.002g MnCl2•4H2O, 0.0029g ZnSO4 •7H2O, 0.00025g CuSO4 •5H2O, 3mL 1M CaCl2, 3mL 1 M MgSO4), as detailed in supplementary appendix. All NPs suspensions were sonicated for 30 minutes before the following experiments. The TEM images were obtained using a transmission electron microscope Tecnai G2-12. Briefly, the diluted Au NPs solution was dropped onto carbon-coated copper grids and then dried at room temperature. At least 6 locations on the grid were measured as described.Citation35 The diameter was calculated considering a perfectly spherical shape by Fiji Image J. The FTIR samples were prepared as previously described.Citation36,Citation37 The FTIR spectroscopy of the sample was taken in the region between 0 and 4300 cm−1 (with Bruker, Alpha-T, USA). The size distribution and zeta potential were tested by a Malvern zeta sizer (HTS3000, Germany).
Nematode Maintenance and Exposures
All the nematode strains were obtained from the Caenorhabditis Genetics Center (St. Paul, MN) and listed in Table S1. The synchronized worms were cultured on nematode growth medium (NGM) agar plates seeded with Escherichia coli OP50 at 20°C according to standard methods.Citation31–33 The F45D3.2, gst-39, and W02B12.1 knockdown strains were generated by RNAi feeding as described.Citation38 P0 synchronized worms were exposed to Au NPs prepared in S basal liquid medium till they reach the young adults’ stage.
Measurement of Body Length and Developmental Stage
Briefly, the wild-type worms were let grow on NGM plates for 3 days. Then the adult worms were bleached to get the synchronized L1 worms. After that, the synchronized worms were cultured in NGM plates containing OP50 with 0, 1, 10, and 100 μg/mL of Au NPs, respectively. The worms were observed every 24 hours. Animals were anesthetized by 100 mM sodium azide on slides. The images were taken by Leica microscope with a 10× objective lens and the body length was measured by Image J. The developmental stage was determined by observing the phenotype of each organ and the body length as described.Citation39 At least 100 worms were counted for each condition. The graph was generated by R studio. The data in the manuscript were labeled as average ± standard error.
Measurement of Pharyngeal Pumping
The pharyngeal pumping rate was quantified by analyzing the 60-second video recording of the contraction of the pharyngeal bulb. The videos were recorded with a Dino-eye Eyepiece camera (Dino-eye, Taiwan) mounted on a stereomicroscope (Nikon, Tokyo). The contractions were carefully counted by monitoring the videos at 0.4 X playback speed as previously described.Citation40 Worms contracted less than 5 times per 10 seconds were considered as non-pumping and were excluded from the experiments.
Measurement of Food Intake
The amount of bacteria intake was measured as previously described.Citation38 Briefly, the food intake of live bacteria was measured by quantification of the florescence intensity of E. coli GFP in vivo. The young adult worms were transferred to NGM plates containing fresh OP50-GFP with or without Au NPs for 24 hours culture. Then the worms were rinsed 3 times and resuspended in M9 buffer (3 g KH2PO4, 6 g Na2HPO4, 5 g NaCl, 1 mL 1 M MgSO4, H2O to 1000 mL) for 15 minutes to wash off any OP50-GFP that might be attached to the body wall. Worms were immobilized with 100 mM NaN3 and mounted on 2% agarose pad. Images were captured using Zeiss LSM 800 confocal microscope with a 20 X HC PL objective lens. At least 20 nematodes were recorded for each group. The consumption of dead OP50 by worms was assessed in 96-well plates. Each well contains 5 to 10 young adult worms with 3 mg/mL of autoclave-killed OP50 in 150 μL S-complete liquid medium plus 50 µg/mL carbenicillin with or without Au NPs. The plates were shaken at 200 rpm for 15 mins and the absorbance at 600 nm was measured after 24 hrs incubation. The relative number of bacteria consumed was calculated by using the original absorbance at 600 nm to minus the absorbance at 600 nm after incubation and then normalized to the number of worms. The media with 50 µg/mL carbenicillin and 3 mg/mL of autoclaving killed OP50 with or without Au NPs was set as blank. At least 50 worms were recorded for each condition.
RNA Sequencing Data Analysis
RNA sequencing data of C. elegans exposed to Au NPs (GSE32521) was downloaded from Gene Expression Omnibus (GEO), National Center for Biotechnology Information (NCBI).Citation41 Age-synchronized L3 worms were exposed to Au NPs at a concentration of 5.9 mg/L in 50% K-Medium (1.23 g NaCl, 0.968 g KCl, H2O to 400 mL) for 12 hours, as detailed in the supplementary appendix. Then, they were cultured with 50% K-Medium and left for another 12h. The RNA was extracted from each of the replicates. Significantly changed genes with 1.5-fold and p<0.05 and FDR<0.1 were analyzed. The RNA sequencing data of daf-16 target genes, reference series GSE1762, was obtained from GEO.Citation42 The comparison between daf-2 (e1370) and the double mutant daf-2 (e1370); daf-16 (df50) was used to determine the target genes for transcription factor DAF-16. The single-cell sequencing data for all the ciliated neurons were obtained from VisCellO.Citation43 The data for all the sensory neurons were plotted using the log10 value of raw read numbers per million by R using package fmsb.
Gene Expression Analysis
The -log10 P value and the log2 fold change of each gene were plotted by package ggplot2 Of R (version 3.5.2) to generate the volcano plot. The cutoff was set as fold change more than 1.5-fold and p<0.05. For the genes with were 1.5-fold higher or lower expressed were marked in red. Gene expressions with less than 1.5-fold and p>0.05 were marked in blue. The tissue enrichment was measured by Gene Set Enrichment Analysis.Citation43 The sub-tissues were set as the same color as the major tissue. The Au NPs specific motif sequence was obtained using the motif discovery tool.Citation43 The 5000 bp before ATG of each enriched genes were selected as the promoter sequence input. The enriched motifs length was set between 6 and 50 bp.
Measurement of Neuron Numbers
The number of neurons was quantified by counting the number of GFP-expressed cells in the otIs672 [rab-3:: NLS::GCaMP6s + arrd-4:NLS:::GCaMP6s] strain. This strain has an ultra-pan-neuronal promoter containing four short pan-neuronal promoters fused. The worms were let grow to L4 stage, and then seeded to the 60 mm NGM plates containing OP50 with or without 100 mg/L Au NPs for 24 hours. At last, the worms were mounted on slides with sodium azide for imaging. The images were taken by Leica fluorescence microscope with a 20X objective lens as described. The cells with clear nucleus localization were counted and plotted by GraphPad 8.
Subcellular Localization of DAF-16
The subcellular localization of DAF-16 indicates the activation of insulin like receptor pathway. The daf-16p::daf-16a/b::GFP worms were let grow to L4 stage, then seeded to the 60 mm NGM plates containing OP50 with or without 100 mg/L Au NPs for 24 hours. Lastly, the worms were mounted on slides with sodium azide for imaging. The worms of positive control group were exposed to 37°C for 1 hour. The images were taken by a Leica fluorescence microscope with 20X objective lens. The number of cells with clear nucleus localization was counted as previously describedCitation40 and plotted by Graphpad 8. The data in the graph was labeled as average ± standard error.
Chemotaxis Assay
The chemotaxis assays were proceeded according to standard procedures as previously described.Citation40,Citation44–47 For isoamyl alcohol and diacetyl assays, 3 µL of odor at the indicated dilution was placed on one side of the plate. Three µL of the solvent ethanol was added to the other side of the plate. For NaCl assays, a chunk of agar around 1cm in diameter was removed from 10cm plates and soaked in the 0.2 M of NaCl for 3 hours. The chunks were put back in the plate overnight to allow the formation of a NaCl gradient. Fifty µL of 100 mM NaN3 were placed on both the control and the test spots to anesthetize animals once they reached the spot. The control group and 100 μg/mL Au NPs pre-exposed worms were placed in the middle of the 10 cm plate. The attraction index was calculated using the equation AI = (B-A)/(A+B). For 1-octanol assay, theworms were placed in a NGM plate with a thin layer of OP50. We dipped an eyelash hair tapped on a 1 mL tip and put in front of a forward moving worm. Then, we count the seconds of the animal starts backward movement as a result of responding to the octanol. The worm needs more than 10 seconds to response before it is considered unresponsive. All the assays were performed blind to the conditions.
The Morphology of ASEL and ASER Neurons
The morphology of ASEL and ASER neurons was monitored by using two strains that specifically expressed GFP in ASEL or ASER neurons. The young adult worms exposed to 0 or 100 mg/L Au NPs for 24 hours were anesthetized with 100mM sodium azide on glass slides covered with 2% agar. The optical section images were collected by EVOS FL auto 2 system using 20X, and 40X objective lens. The length of dendrite, the area of cilia and cell body were measured using Fiji Image J.Citation48
The Calcium Transit Assay
Calcium imaging recordings were performed in accordance with standard procedures with minor modifications.Citation49 Worms were immersed in bath solution containing 5 mM KPO4 buffer, 1 mM MgSO4, and 1 mM CaCl2, adjusted to pH6.0, and glued to a 2% agar pad settled on a glass covers lip using medical glue. The NaCl bath buffer was the above buffer containing 20 mM NaCl. The buffer was delivered to a recording chamber via gravity perfusion with the speed of perfusion was 10 mL/min. Images were acquired using MicroManager 2.0 softwareCitation50 at a frequency of 1 Hz with 100 ms exposure time and a spatial resolution of 1024×1024 pixels. Basal fluorescence prior to exposure to the chemicals was acquired for 15 seconds. The perfusion with the NaCl was for 20 seconds, followed by washing with the bath solution until the end of the recording. The fluorescence intensity was calculated by subtracting the background.
Protein’s Function and Subcellular Localization Analysis
The genes which are significantly increased in expression are selected for the protein–protein function analysis. For the interactions, we analyzed co-expression, genetic interactions and physical interactions using Genemania.Citation51 For the protein–protein interaction analysis, the top 20 genes which are significantly in expression were selected and analyzed by STRING.Citation52
Statistical Analysis
Statistical analysis with 3 groups or more was conducted using one-way ANOVA followed by Tukey’s. Analysis with 2 groups was conducted using Student’s test. The data were collected and graphed by ggplot2 package from R and GraphPad 8. Data are represented as mean ± SEM obtained from at least three independent experiments. P values are represented as *p<0.05, **p<0.01, ***p<0.001.
Results and Discussion
Characterization of Au NPs
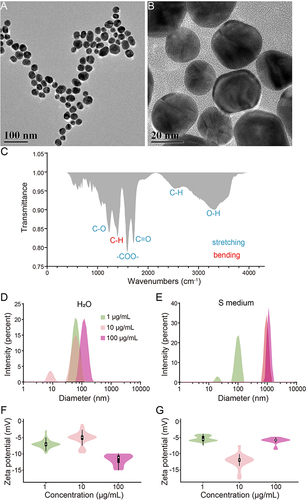
The size of nanoparticles is a key factor affecting their absorption, distribution, and toxicity.Citation53–56 Studies have shown that silica NPs (>80 nm) induced decreased cell viability and increased oxidative stress.Citation53 Smaller-sized silver NPs induce more severe apoptosis in mouse fibroblasts.Citation56 Uptake of 45 nm Au NPs has been reported to penetrate cells through clathrin-mediated endocytosis, whereas the smaller 13 nm enter cells mainly through phagocytosis.Citation55 Moreover, the smaller size of Au NPs reduced the colony formation efficiency of mouse fibroblasts.Citation54 Here, the size and coating characteristics were characterized by TEM and FTIR firstly. The TEM image showed the average size of the Au NPs was 26.67 ± 0.51 nm ( and ). FTIR suggested that the Au NPs were coated with citric acid to aid distribution (). Further, to understand the status of Au NPs in the solvent, we analyzed the size distribution and zeta potential in water and S medium (Supplementary Appendix). As shown in and , the hydrated size of Au NPs becomes larger with increasing concentration. However, the particle size of Au NPs at 10 and 100 mg/L did not differ significantly in S matrix medium, but there was a significant difference in the particle size in water (). Since the pH of S basal medium and water are very close, the possible explanation is the salt such as Fe2+, Mn2+, Zn2+, Cu2+, Cl−, and SO42- have impact on the aggregation of Au NPs. This is consistent with the observation that the aggregation of Au NPs in solution is influenced by cations and oligomers, which control the aggregation behavior of Au NPs. The zeta potentials for water and S basal medium are relatively consistent for three different concentrations. These results indicated that the size of Au NPs in S basal medium was larger than that in water, but the dispersion is stable after sonication.
Figure 1 Characterization of Physicochemical properties of Au NPs and stability in water and S medium. (A–B) The TEM images of Au NPs. The scale bars represent 100 nm and 20 nm respective ly.(C) FTIR of Au NPs. Stretching vibrations are labelled blue, bending vibration is labelled red. (D–G) Size distribution of 1, 10 and 100 μg/mL Au NPs in H2O or S medium. Green represents the 1 μg/mL Au NPs group, lemonade represents the 10 μg/mL Au NPs group, magenta represents the 100 μg/mL Au NPs group. Data are shown as mean ± SE.
Au NPs Delayed the Development of C. elegans Through Reducing the Food Intake
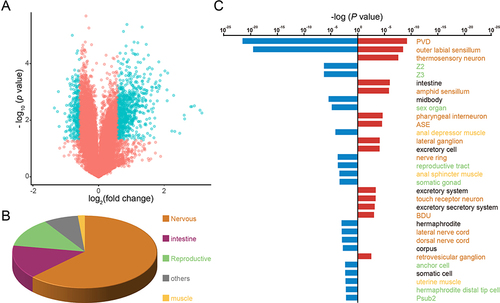
Recent studies on the effects of Au NPs on development have shown that embryonic exposure of Au NPs leads to the formation of several malformations and affects eye development during early developmental stages of zebrafish.Citation57,Citation58 Functional analysis indicated that genes enriched in the nervous system were strongly associated with development. It is generally believed that exposure starts from early stage is more reasonable for study the developmental effects of Au NPs. Therefore, we started to test from the L1 stage for 60 hours, when the worms were young adults. As shown in and , exposure to 10 and 100 mg/L Au NPs adversely influenced the early development of C. elegans. The average body length of 100 mg/L Au NPs-treated worms were around 30% short than control group. It is consistent to the measurement of developmental stage determination results (). For the worms fed with 10 mg/L Au NPs, 0.8% young adult observed compare to nearly 40% for control. For the fourth day of culture, less eggs observed in the 10 and 100 mg/L Au NPs plates than the 0 and 0.1 mg/L conditions (data not shown). These results indicated that Au NPs concentration higher than 10 mg/L will delay the development of C. elegans, and this phenomenon is in a concentration-dependent manner.
Figure 2 Au NPs induce development abnormality by reducing food intake. Images and body length quantification of worms exposed to 0, 1, 10 and 100 μg/mL Au NPs for 60 hours (A–B). Developmental stage analysis (C) and food intake measurement (D) of worms exposed to 0, 1, 10 and 100 μg/mL Au NPs. Body length analysis (E) and pumping rate quantification (F) of wild type and eat-2 mutant worms exposed to 0 and 100 μg/mL Au NPs for 60 hrs. Gray represents the 0 μg/mL Au NPs group. Data are shown as mean ± SE. The “ns” represents not significant. P values are represented as *p < 0.05, ***p < 0.001.
In view of the above findings, we hypothesized that the developmental defects might be related to foraging behavior. We tested the food intake of the worms with live OP50-GFP. By measuring the intensity of GFP, we observed that 100 mg/L Au NPs exposure caused a significant reduction of worms in food intake. To eliminate the possibility that Au NPs-treated OP50 produced some by-products causing abnormal development, we repeated the food intake experiments with dead OP50. As shown in , food intake was also significantly reduced in worms exposed to 100 mg/L Au NPs. These results confirmed that developmental abnormality of C. elegans caused by 100 mg/L Au NPs exposure was not related to the status of OP50. To conclude, 100 mg/L Au NPs exposure adversely influences the development of C. elegans by reducing food intake.
Foraging Behavior of C. elegans Depends Largely on the Pumping of Pharynx
The pharynx works as a tubular pump, sucking food into the intestine, concentrating and grinding them up.Citation59 The nicotinic acetylcholine receptor eat-2 is necessary for rapid pharynx pumping.Citation60 Eat-2 initiates the firing of motor neurons required for pumping action potential. Without eat-2, the pumping speed dropped to 10% of original rate.Citation60 To determine whether changes in food intake were related to pumping rate, we analyzed body length and pumping rate of wild-type and eat-2 mutants ( and ). Different from the wild type worms, the control and Au NPs-exposed eat-2 mutants did not change significantly in body length and pumping rate. The results suggested that the developmental abnormality in C. elegans caused by 100 mg/L Au NPs was associated with reduced food intake and pumping, which were dependent on nicotinic acetylcholine receptor eat-2.
The Nervous System is the Organ Most Affected by Au NPs
The bio-distribution analysis of Au NPs accumulation in mice showed that the liver and spleen are the organs with most Au NPs acculturated.Citation22,Citation61,Citation62 In C. elegans, there is no liver and spleen, but the intestine has the combined function of spleen, liver, kidney, and stomach. It is consistent with the observation in mice; the intestine has most Au NPs accumulated in Au NPs fed worms.Citation23 Correspondingly, most toxicological studies on animal models of Au NPs exposure were focused on the liver, spleen, and kidney.Citation63–65 Indeed, the presence of Au NPs altered hepatic metabolism, such as increased aspartate aminotransferase (AST) level and decreased the level of gamma-glutamyl transferase (GGT), alanine transaminase (ALT) and alkaline phosphatase (ALP).Citation66 Furthermore, the transcriptome analysis of liver samples showed that Au NPs caused down-regulation of many cytochrome P450-related genes and up-regulation of inflammation-associated genes.Citation63
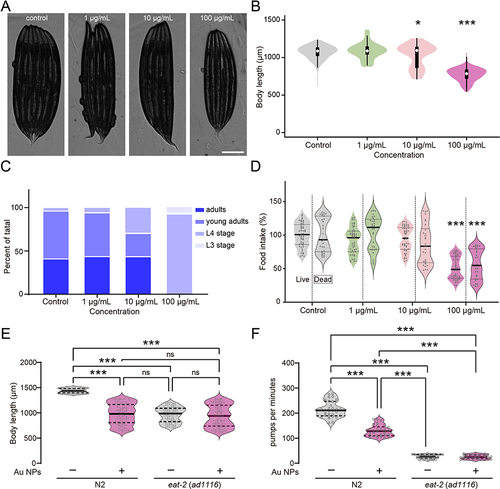
However, through analyzing the whole animal transcriptome, we found that the nervous system, instead of the intestine, was the organ with the most altered gene expression through Au NPs exposure in liquid culture (K-medium in supplementary appendix). By setting the cutoff at 1.5-fold change, we found a significant increase in nearly 800 genes and a significant decrease in 270 genes (). To analyze the organ-level mRNA expression induced by Au NPs, we performed tissue enrichment assays by inputting RNA-seq data. The results suggested that above 60% of the significantly altered genes were mainly functioning in the nervous system; around 15% were located to intestine, 8% in reproductive system, 15% in muscles and other tissues (). To check in detail, we investigated the sub-type of each category. For the nervous system, all its sub-type cells have both genes significantly up- and down-regulated, such as the outer labial sensillum. However, the intestinal cells show only up-regulated genes, the sub-types of reproductive system and muscle show only down-regulation (). To conclude, these results indicated that at transcriptome level, the nervous system is the major target organ of Au NPs.
Figure 3 The nervous system is the main target organ for Au NPs treatment. (A) Volcano plot of expression changes of approximately 20,000 genes in C. elegans after Au NPs treatment. Each gene was plotted by fold change and p-value. Genes that have increased or decreased expression with fold change>1.5 and P value <0.05 are marked as blue hollow circles. Genes with increased or decreased expression for fold changes <1.5 and P values >0.05 are labeled as red hollow circles. Tissue enrichment analysis of genes that were significantly increased (blue) and decreased (red) in the Au NPs-exposed C. elegans group is shown by pie charts (B) and bar graphs (C).
To further elucidate the interaction of Au NPs with the nervous system at the mRNA expression level, we performed protein–protein interaction assays. We focused on the top 20 up-regulated genes and analyzed their functions based on their co-expression, gene interactions, physical interactions and shared protein structural domains. The functions of these genes were focused on cellular component organization, reproduction, multicellular organism development, nematode larval development, and embryonic development at birth or egg hatching (Figure S1A and B). These results are highly consistent with the results of gene ontology analysis, which also showed that Au NPs-induced changes in mRNA expression of neurological genes are highly correlated with development, such as larval, embryonic, reproductive and dendritic development (Figure S1C). In addition, we analyzed the specific binding pattern of Au NPs by using the promoter sequences of the upregulated genes as input. The results showed that a conserved 43 bp sequence was the specific binding pattern of Au NPs with an e-value of 1.5−2Citation22 (Figure S1D). Since our study was more focused on neuronal toxicity caused by Au NPs, we performed developmental stage assays based on functional analysis of neuronal genes. These results suggest that Au NPs exposure regulates development mainly through the regulation of gene function in the nervous system.
Au NPs Cause Defects in ASE Sensory Neuron’s Function
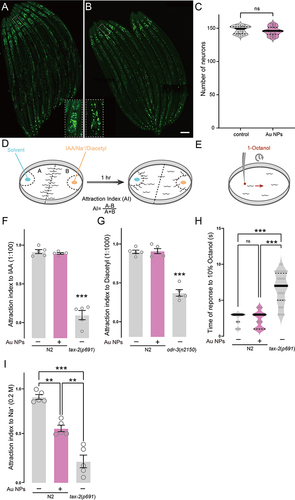
Previous RNA sequencing data suggested that Au NPs induce gene changes mainly in the nervous system. To investigate whether changes in the gene expression cause any effect on neurons, we monitored the number of all neurons in C. elegans. As a result, we did not observe any change in the total number of neurons (). Since the foraging behavior of C. elegans was triggered by the sensation of food, we tested the function of each sensory neuron through chemotaxis assay ( and ). As shown in , Au NPs-treated worms showed defects in NaCl sensation, but did not show any defect in IAA, diacetyl, and octanol sensation. These results suggested that the worms treated by Au NPs exhibited a defect in NaCl sensation, which indicated the functional defect in ASE. We know that defects in ASE neuron function could lead to the decrease in food intake and pumping rate.
Figure 4 Au NPs-treated worms have decreased sensation of NaCl. (A–B) Images of all neurons in 0 and 100 μg/mL Au NPs-exposed C. elegans. (C) The quantification of visible neuron numbers. (D–E) The cartoon for chemotaxis assay of IAA, NaCl, Diacetyl and 1-octanol. (F–H) The attraction index of 0 and 100 μg/mL Au NPs-exposed worms to IAA, Diacetyl, and NaCl. (I) The response time of 0 and 100 μg/mL Au NPs-exposed worms to 1-octanol. Gray represents the 0 μg/mL Au NPs group, magenta represents the 100 μg/mL Au NPs group. Data are shown as mean ± SE. The “ns” represents not significant. P values are represented as **p < 0.01, ***p < 0.001.
Au NPs Lead to Decreased Calcium Transit in ASEL Neurons
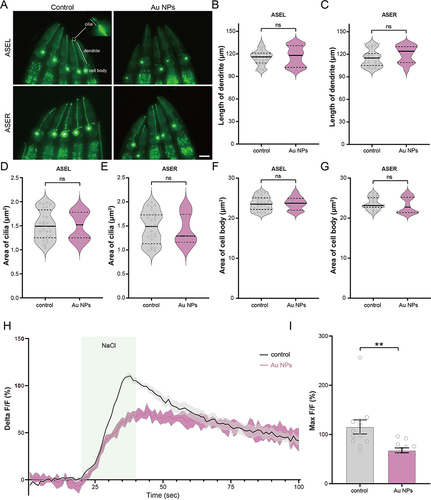
It is well known that ASEL and ASER neurons control the sensation of NaCl, and calcium is an essential intracellular messenger in neurons. The Green fluorescent protein/Calmodulin sensor (GCaMP) can reflect changes in Ca2+ influx facilitated by stimulation-evoked neuronal action potentials. For example, the calcium transits of ASEL increase when the NaCl concentration changes from low to high. On the contrary, when the NaCl concentration changes from high to low, the calcium transport of ASER showed an increasing trend. In addition, neuronal morphology has been shown to be an important factor affecting neuronal function. Altered morphology can lead to changes in neuron function, which further affects their behavior.Citation67,Citation68 Here, to investigate the mechanism of NaCl sensation reduction in worms exposed to Au NPs, we observed morphology and measured neuronal function. Firstly, we measured the length of dendrite, the area of cilia and cell body of both ASEL and ASER neurons. The morphology of ASEL and ASER showed no change (). Then, we generated the ASE GCaMP strain (Table S1) and checked the function of ASEL neurons by measuring the calcium transit. As shown in and , the max calcium transit was significantly reduced in Au NPs-treated worms. Figure S2 showed the calcium transit of each individual worm. However, we did not observe any changes in ASER neurons (Figure S3). The decay of ASEL calcium transit of Au NPs-treated worms lasted longer than wild type. These results indicated that Au NPs could induce decrease in ASEL calcium transit, leading to defect in food sensation.
Figure 5 Au NPs exposure does not affect the morphology of ASEL and ASER neurons but decreases the calcium transit of ASEL. (A) The image of ASEL and ASER in 0 and 100 μg/mL Au NPs-exposed worms. (B–G) The quantification of dendrite length, area of cilia, and area of cell body of ASEL and ASER neurons. (H) The calcium transit dynamics and (I) the max intensity of florescence signal of ASEL neuron of 0 and 100 μg/mL Au NPs-pre-exposed worms to 20 mM NaCl. Gray represents the 0 μg/mL Au NPs group, magenta represents the 100 μg/mL Au NPs group. Data are shown as mean ± SE. The “ns” represents not significant. P values are represented as **p < 0.01.
Food Sensation Defects Caused by Au NPs Partly Depend on the Neuropeptide INS-22
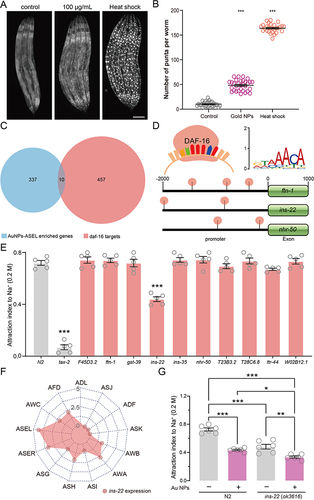
It has been reported that the sensation and adaption of NaCl are largely dependent on the insulin/IGF-1 signaling (IIS) pathway.Citation69 Prolonged NaCl exposure did not increase Ca2+ responses of ASER in IIS pathway mutants as much as that in wild-type worms.Citation70 High concentrations of NaCl may induce developmental arrest by inhibiting the IIS signaling pathway, resulting in the activation of the FOXO transcription factor DAF-16.Citation71 To test if Au NPs activate the IIS signaling pathway, we measured the subcellular localization of the transcription factor DAF-16 ( and ). Compared with wild-type worms, the observed number of DAF-16 in nucleus was significantly increased. To investigate the specific genes that regulate NaCl sensation in ASEL neurons, we compared the transcriptome of DAF-16 dependent genes and Au NPs-ASEL-enriched genes. As a result, we found that 10 DAF-16 dependent genes are also enriched in Au NPs-ASEL genes (). We further studied the specific motifs recognized by DAF-16, which are present in the promoter regions of all 10 discovered genes (). To determine which gene regulates the NaCl sensation, we screened the mutants of DAF-16 dependent and Au NPs-ASEL enriched genes. Among all these mutants, the neuropeptide INS-22 mutant showed NaCl sensation defects (). By analyzing the single-cell RNA sequencing data of all the sensory neurons, we found that ins-22 expression was enriched in ASEL, ASER, and AWC neurons ( and S4). Studies have shown that the insulin-type neuropeptide INS-22 is more secreted during active reproductive stages,Citation72 and it is usually secreted from dense core vesicles into the body cavity, where it is then taken up by coelomocytes.Citation73 To date, how INS-22 is involved in salt sensation remains largely unknown. Since it has been reported that AWC neurons can act as inter-neuron for NaCl sensation,Citation74 we confirmed that ins-22 is expressed in ASE and AWC neurons that sense NaCl. By testing the sensation of Au NPs-treated ins-22 mutants to NaCl, we found that the attraction index of NaCl was significantly reduced (). Meanwhile, compared with Au NPs-treated wild-type worms, the attraction index of NaCl in Au NPs-treated ins-22 mutants significantly decreased. So, we hypothesize that INS-22 partially regulates the NaCl sensation defect induced by Au NPs.
Figure 6 DAF-16 targeting the neuropeptide INS-22 partially modulates Au NPs-induced decrease in NaCl sensation. (A) The subcellular localization of DAF-16 in 0 and 100 μg/mL Au NPs-exposed and heat shock C. elegans. (B) The quantification of (A). (C) Venn diagram of genes enriched in Au NPs-ASEL genes and daf-16 target genes. (D) The locations of transcription factor DAF-16 binding DNA motif in the promoter regions of ftn-1, ins-22 and nhr-50. (E) The attraction index of Au NPs-ASEL enriched and daf-16 target gene mutants (punch) exposed to NaCl. (F) The expression of ins-22 (punch) in all sensory neurons. (G) The attraction index of 0 and 100 μg/mL Au NPs-exposed wild type and ins-22 mutant worms to NaCl. Gray represents the 0 μg/mL Au NPs group, magenta represents the 100 μg/mL Au NPs group. Data are shown as mean ± SE. The “ns” represents not significant. P values are represented as *p < 0.05, **p < 0.01, ***p < 0.001.
Food Sensation Defects Caused by Au NPs Depend on EGL-19
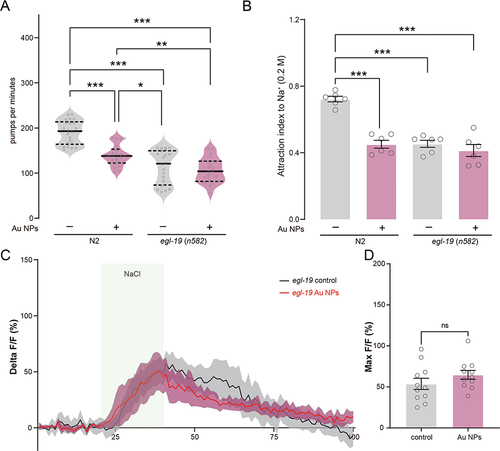
The L-type voltage-gated calcium channel egl-19 is essential for calcium transit in neurons and glial cells.Citation75,Citation76 Blocking or knockdown of egl-19 induces decreases in calcium transit in ASE neurons.Citation77 EGL-19 cooperates with EAT-2 and CCA-1 to regulate the neuron functions and initiates the action potential in neurons and muscles.Citation59,Citation78 The expression of egl-19 was observed in ASE, ASG, AWB, and other ciliated neurons (Figure S5). To confirm if egl-19 was involved in Au NPs-induced pumping and NaCl sensation defects, we measured the pumping rate and attraction index of egl-19 mutants. To elucidate the role of egl-19 in Au NPs-induced calcium transit defects, the one nucleotide mutant of egl-19 was used. This mutant ever proved a reduction in calcium transit to around 50% compared to wild type.Citation76 As shown in , the pumping rate and attraction index of Au NPs-treated egl-19 mutants were not changed compared with the worms without Au NPs treatment. These results indicated that the pumping and NaCl sensation defects induced by Au NPs were dependent on egl-19. We further tested the calcium transit of NaCl of egl-19 mutants treated with and without Au NPs. Consistent with the behavior assay, the real-time monitor curve of calcium transit was largely overlapped. There are no significant changes found in max florescence intensity of egl-19 mutants with and without Au NPs treatment. These results indicated that the pumping and NaCl sensation defects induced by Au NPs are dependent on the L-type voltage-gated calcium channel EGL-19.
Figure 7 The voltage-gated calcium channel EGL-19 is required for Au NPs-induced calcium transit change in ASEL neurons. (A) The pumping rate quantification of 0 and 100 μg/mL Au NPs-exposed wild type and egl-19 mutant worms. (B) The attraction index of 0 and 100 μg/mL Au NPs-exposed wild type and egl-19 mutant worms to NaCl. (C) The calcium transit dynamics of ASEL neuron of 0 and 100 μg/mL Au NPs-pre-exposed egl-19 worms to 20 mM NaCl. (D) The max intensity of the fluorescence signal of (C). Gray represents the 0 μg/mL Au NPs group, magenta represents the 100 μg/mL Au NPs group. Data are shown as mean ± SE. The “ns” represents not significant. P values are represented as *p < 0.05, **p < 0.01, ***p < 0.001.
Conclusions
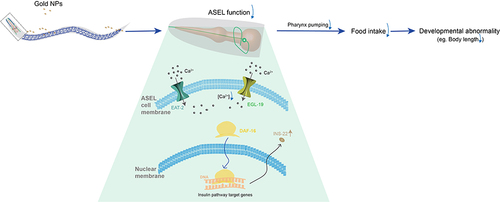
The study was focused on how the Au NPs induces neuronal gene expression changes, further causes developmental abnormality in C. elegans. The gene expression changes did not alter the number and morphology of neurons but affected the ASE sensory neurons’ function. From the behavioral and imaging data, we demonstrated that Au NPs causes decreased calcium transit in ASEL neurons via egl-19. In detail, with the decreased expression of ins-22 in ASEL neurons, the NaCl sensation was defected. Then, loss of food sensation induces less pharynx pumping. Reduced pumping rate causes less food intake. Less food intake finally causes developmental abnormality (). Our results suggested that Au NPs could change the taste of OP50, which leads to the decrease in food intake, further causes developmental abnormality in animals.
Figure 8 Schematic diagram of how egl-19 and eat-2 affect the functions of ASEL on chemosensation. When worms expose to a high concentration of Au NPs, it decreases the NaCl-induced intracellular calcium concentration through an egl-19 dependent pathway, further causing the reduction of pharynx pumping, and reduces the amount of food intake. The decreased food intake causes developmental abnormality, making the worm grows slow and smaller in size.
Disclosure
The authors report no conflicts of interest.
Acknowledgments
This work was supported in part by grants from National Natural Science Foundation of China (22176002); Young Scientists Fund of the National Natural Science Foundation of China (82201315). Anhui Provincial Natural Science Foundation (2008085MB49); Open Project Fund of the Key Laboratory of the Ministry of Education for the Birth Population (JKZD20202); Funded Project of Anhui Medical University’s Research Level Improvement Program (2021xkjT004) and Funded Project of Anhui Medical University Basic and Clinical Cooperative Research Promotion Program (2021xkjT041).
References
- Dragoni S, Franco G, Regoli M, et al. Gold nanoparticles uptake and cytotoxicity assessed on rat liver precision-cut slices. Toxicol Sci. 2012;128(1):186–197. doi:10.1093/toxsci/kfs150
- Zhao MX, Cai ZC, Zhu BJ, Zhang ZQ. The apoptosis effect on liver cancer cells of gold nanoparticles modified with lithocholic acid. Nanoscale Res Lett. 2018;13:304. doi:10.1186/s11671-018-2653-8
- Sereemaspun A, Rojanathanes R, Wiwanitkit V. Effect of gold nanoparticle on renal cell: an implication for exposure risk. Ren Fail. 2008;30:323–325. doi:10.1080/08860220701860914
- Nethi SK, Mukherjee S, Veeriah V, et al. Bioconjugated gold nanoparticles accelerate the growth of new blood vessels through redox signaling. Chem Commun (Camb). 2014;50(92):14367–14370. doi:10.1039/c4cc06996j
- Cheng Y, Dai Q, Morshed RA, et al. Blood-brain barrier permeable gold nanoparticles: an efficient delivery platform for enhanced malignant glioma therapy and imaging. Small. 2014;10(24):5137–5150. doi:10.1002/smll.201400654
- Kreyling WG, Möller W, Holzwarth U, et al. Age-dependent rat lung deposition patterns of inhaled 20 nanometer gold nanoparticles and their quantitative biokinetics in adult rats. ACS Nano. 2018;12(8):7771–7790. doi:10.1021/acsnano.8b01826
- Dixit S, Novak T, Miller K, et al. Transferrin receptor-targeted theranostic gold nanoparticles for photosensitizer delivery in brain tumors. Nanoscale. 2015;7(5):1782–1790. doi:10.1039/c4nr04853a
- Kim B, Han G, Toley BJ, et al. Tuning payload delivery in tumour cylindroids using gold nanoparticles. Nat Nanotechnol. 2010;5(6):465–472. doi:10.1038/nnano.2010.58
- Morshed RA, Muroski ME, Dai Q, et al. Cell-penetrating peptide-modified gold nanoparticles for the delivery of doxorubicin to brain metastatic breast cancer. Mol Pharm. 2016;13(6):1843–1854. doi:10.1021/acs.molpharmaceut.6b00004
- Al Hagbani T, Rizvi SMD, Hussain T, et al. Cefotaxime mediated synthesis of gold nanoparticles: characterization and antibacterial activity. Polymers. 2022;14(4):771. doi:10.3390/polym14040771
- Wang L, Zheng W, Li S, Zhong L, Jiang X. Aminophenol-decorated gold nanoparticles for curing bacterial infections. Nano Lett. 2022;22:3576–3582. doi:10.1021/acs.nanolett.1c04968
- Rodriguez Diaz C, Lafuente-Gómez N, Coutinho C, et al. Development of colorimetric sensors based on gold nanoparticles for SARS-CoV-2 RdRp, E and S genes detection. Talanta. 2022;243:123393. doi:10.1016/j.talanta.2022.123393
- Botha TL, Boodhia K, Wepener V. Adsorption, uptake and distribution of gold nanoparticles in Daphnia magna following long term exposure. Aquat Toxicol. 2016;170:104–111. doi:10.1016/j.aquatox.2015.11.022
- Pacheco A, Martins A, Guilhermino L. Toxicological interactions induced by chronic exposure to gold nanoparticles and microplastics mixtures in Daphnia magna. Sci Total Environ. 2018;628-629:474–483. doi:10.1016/j.scitotenv.2018.02.081
- Porter CJ, Moghimi SM, Illum L, Davis SS. The polyoxyethylene/polyoxypropylene block co-polymer poloxamer-407 selectively redirects intravenously injected microspheres to sinusoidal endothelial cells of rabbit bone marrow. FEBS Lett. 1992;305:62–66. doi:10.1016/0014-5793(92)80655-z
- Sung JH, Ji JH, Park JD, et al. Subchronic inhalation toxicity of silver nanoparticles. Toxicol Sci. 2009;108(2):452–461. doi:10.1093/toxsci/kfn246
- Wiemann M, Vennemann A, Blaske F, Sperling M, Karst U. Silver nanoparticles in the lung: toxic effects and focal accumulation of silver in remote organs. Nanomaterials. 2017;7(12):441. doi:10.3390/nano7120441
- Braakhuis HM, Gosens I, Krystek P, et al. Particle size dependent deposition and pulmonary inflammation after short-term inhalation of silver nanoparticles. Part Fibre Toxicol. 2014;11(1):49. doi:10.1186/s12989-014-0049-1
- Zelepukin IV, Popov AA, Shipunova VO, et al. Laser-synthesized TiN nanoparticles for biomedical applications: evaluation of safety, biodistribution and pharmacokinetics. Mater Sci Eng C Mater Biol Appl. 2021;120:111717. doi:10.1016/j.msec.2020.111717
- Cho WS, Cho M, Jeong J, et al. Acute toxicity and pharmacokinetics of 13 nm-sized PEG-coated gold nanoparticles. Toxicol Appl Pharmacol. 2009;236:16–24. doi:10.1016/j.taap.2008.12.023
- Li X, Hu Z, Ma J, et al. The systematic evaluation of size-dependent toxicity and multi-time biodistribution of gold nanoparticles. Colloids Surf B Biointerfaces. 2018;167:260–266. doi:10.1016/j.colsurfb.2018.04.005
- Semmler-Behnke M, Kreyling WG, Lipka J, et al. Biodistribution of 1.4- and 18-nm gold particles in rats. Small. 2008;4(12):2108–2111. doi:10.1002/smll.200800922
- Tsyusko OV, Unrine JM, Spurgeon D, et al. Toxicogenomic responses of the model organism Caenorhabditis elegans to gold nanoparticles. Environ Sci Technol. 2012;46(7):4115–4124. doi:10.1021/es2033108
- Papastefanaki F, Jakovcevski I, Poulia N, et al. Intraspinal delivery of polyethylene glycol-coated gold nanoparticles promotes functional recovery after spinal cord injury. Mol Ther. 2015;23(6):993–1002. doi:10.1038/mt.2015.50
- Lin YL, Jen JC, Hsu SH, Chiu IM. Sciatic nerve repair by microgrooved nerve conduits made of chitosan-gold nanocomposites. Surg Neurol. 2008;70:9–18. doi:10.1016/j.surneu.2008.01.057
- Bhang SH, Han J, Jang H-K, et al. pH-triggered release of manganese from MnAu nanoparticles that enables cellular neuronal differentiation without cellular toxicity. Biomaterials. 2015;55:33–43. doi:10.1016/j.biomaterials.2015.03.025
- Carvalho-de-Souza JL, Treger J, Dang B, et al. Photosensitivity of neurons enabled by cell-targeted gold nanoparticles. Neuron. 2015;86(1):207–217. doi:10.1016/j.neuron.2015.02.033
- Das S, Sharma M, Saharia D, et al. In vivo studies of silk based gold nano-composite conduits for functional peripheral nerve regeneration. Biomaterials. 2015;62:66–75. doi:10.1016/j.biomaterials.2015.04.047
- Das M, Shim KH, An SSA, Yi DK. Review on gold nanoparticles and their applications. Toxicol Environ Health Sci. 2011;3:193–205. doi:10.1007/s13530-011-0109-y
- Yen HJ, Hsu SH, Tsai CL. Cytotoxicity and immunological response of gold and silver nanoparticles of different sizes. Small. 2009;5:1553–1561. doi:10.1002/smll.200900126
- Kang B, Mackey MA, El-Sayed MA. Nuclear targeting of gold nanoparticles in cancer cells induces DNA damage, causing cytokinesis arrest and apoptosis. J Am Chem Soc. 2010;132:1517–1519. doi:10.1021/ja9102698
- Pan Y, Leifert A, Ruau D, et al. Gold nanoparticles of diameter 1.4 nm trigger necrosis by oxidative stress and mitochondrial damage. Small. 2009;5(18):2067–2076. doi:10.1002/smll.200900466
- Li JJ, Hartono D, Ong CN, Bay BH, Yung LYL. Autophagy and oxidative stress associated with gold nanoparticles. Biomaterials. 2010;31:5996–6003. doi:10.1016/j.biomaterials.2010.04.014
- Leung MC, Williams PL, Benedetto A, et al. Caenorhabditis elegans: an emerging model in biomedical and environmental toxicology. Toxicol Sci. 2008;106(1):5–28. doi:10.1093/toxsci/kfn121
- Wang J, Wang L, Zhao W, et al. The role of apoptosis pathway in the cytotoxicity induced by fresh and aged zinc oxide nanoparticles. Nanoscale Res Lett. 2021;16(1). doi:10.1186/s11671-021-03587-y
- Lei W, Min W, Hui D, Yun L, An X. Effect of surface modification on cellular internalization of fe3o4 nanoparticles in strong static magnetic field. J Nanosci Nanotechnol. 2015;15:5184–5192. doi:10.1166/jnn.2015.9841
- Wang L, Wang M, Du H, Liu Y, Xu A. Lipid metabolism was interfered by phosphatidylcholine-coated magnetic nanoparticles in C. elegans exposed to 0.5 T static magnetic field. J Nanosci Nanotechno. 2017;17:3172–3180. doi:10.1166/jnn.2017.13051
- Lei W, Beaudoin-Chabot C, Thibault G. Glucose increases the lifespan of post-reproductive C. elegans independently of FOXO. bioRxiv. 2018;347435.
- Wang L, Du H, Guo X, et al. Developmental abnormality induced by strong static magnetic field in Caenorhabditis elegans. Bioelectromagnetics. 2015;36(3):178–189. doi:10.1002/bem.21906
- Beaudoin-Chabot C, Wang L, Celik C, et al. The unfolded protein response reverses the effects of glucose on lifespan in chemically-sterilized C. elegans. Nat Commun. 2022;13(1):5889. doi:10.1038/s41467-022-33630-0
- Tsyusko OV, Unrine JM, Spurgeon D, et al. Toxicogenomic responses of the model organism Caenorhabditis elegans to gold nanoparticles. Environ Sci Technol. 2012;46(7):4115–4124. doi:10.1021/es2033108
- McElwee JJ, Schuster E, Blanc E, Thomas JH, Gems D. Shared transcriptional signature in Caenorhabditis elegans Dauer larvae and long-lived daf-2 mutants implicates detoxification system in longevity assurance. J Biol Chem. 2004;279:44533–44543. doi:10.1074/jbc.M406207200
- Qin Zhu JIM, Tan K, Kim J. qinzhu/VisCello: visCello v1.0.0 (v1.0.0). Science. 2019;365:eax1971. doi:10.5281/zenodo.3262313
- Bargmann CI, Horvitz HR. Chemosensory neurons with overlapping functions direct chemotaxis to multiple chemicals in C. elegans. Neuron. 1991;7:729–742. doi:10.1016/0896-6273(91)90276-6
- Bargmann CI, Hartwieg E, Horvitz HR. Odorant-selective genes and neurons mediate olfaction in C. elegans. Cell. 1993;74(3):515–527. doi:10.1016/0092-8674(93)80053-h
- Troemel ER, Chou JH, Dwyer ND, Colbert HA, Bargmann CI. Divergent seven transmembrane receptors are candidate chemosensory receptors in C. elegans. Cell. 1995;83(2):207–218. doi:10.1016/0092-8674(95)90162-0
- Wang L, Graziano B, Encalada N, et al. Glial regulators of ions and solutes required for specific chemosensory functions in Caenorhabditis elegans. iScience. 2022;25(12):105684. doi:10.1016/j.isci.2022.105684
- Rueden CT, Schindelin J, Hiner MC, et al. ImageJ2: imageJ for the next generation of scientific image data. BMC Bioinform. 2017;18(1):529. doi:10.1186/s12859-017-1934-z
- Lim JP, Fehlauer H, Das A, et al. Loss of CaMKI function disrupts salt aversive learning in C. elegans. J Neurosci. 2018;38(27):6114–6129. doi:10.1523/JNEUROSCI.1611-17.2018
- Edelstein AD, Tsuchida MA, Amodaj N, et al. Advanced methods of microscope control using muManager software. J Biol Methods. 2014;1(2):e10. doi:10.14440/jbm.2014.36
- Warde-Farley D, Donaldson SL, Comes O, et al. The GeneMANIA prediction server: biological network integration for gene prioritization and predicting gene function. Nucleic Acids Res. 2010;38(suppl_2):W214–220. doi:10.1093/nar/gkq537
- Szklarczyk D, Gable AL, Lyon D, et al. STRING v11: protein-protein association networks with increased coverage, supporting functional discovery in genome-wide experimental datasets. Nucleic Acids Res. 2019;47(D1):D607–D613. doi:10.1093/nar/gky1131
- Kim IY, Joachim E, Choi H, Kim K. Toxicity of silica nanoparticles depends on size, dose, and cell type. Nanomedicine. 2015;11:1407–1416. doi:10.1016/j.nano.2015.03.004
- Coradeghini R, Gioria S, García CP, et al. Size-dependent toxicity and cell interaction mechanisms of gold nanoparticles on mouse fibroblasts. Toxicol Lett. 2013;217(3):205–216. doi:10.1016/j.toxlet.2012.11.022
- Mironava T, Hadjiargyrou M, Simon M, Jurukovski V, Rafailovich MH. Gold nanoparticles cellular toxicity and recovery: effect of size, concentration and exposure time. Nanotoxicology. 2010;4:120–137. doi:10.3109/17435390903471463
- Kim TH, Kim M, Park H-S, et al. Size-dependent cellular toxicity of silver nanoparticles. J Biomed Mater Res A. 2012;100(4):1033–1043. doi:10.1002/jbm.a.34053
- Kim KT, Zaikova T, Hutchison JE, Tanguay RL. Gold nanoparticles disrupt zebrafish eye development and pigmentation. Toxicol Sci. 2013;133:275–288. doi:10.1093/toxsci/kft081
- Browning LM, Lee KJ, Huang T, et al. Random walk of single gold nanoparticles in zebrafish embryos leading to stochastic toxic effects on embryonic developments. Nanoscale. 2009;1(1):138–152. doi:10.1039/b9nr00053d
- Avery L, You YJC. Elegans feeding. WormBook. 2012;1–23. doi:10.1895/wormbook.1.150.1
- Raizen DM, Lee RY, Avery L. Interacting genes required for pharyngeal excitation by motor neuron MC in Caenorhabditis elegans. Genetics. 1995;141:1365–1382. doi:10.1093/genetics/141.4.1365
- Abdelhalim MA, Mady MM. Liver uptake of gold nanoparticles after intraperitoneal administration in vivo: a fluorescence study. Lipids Health Dis. 2011;10:195. doi:10.1186/1476-511X-10-195
- Balasubramanian SK, Jittiwat J, Manikandan J, et al. Biodistribution of gold nanoparticles and gene expression changes in the liver and spleen after intravenous administration in rats. Biomaterials. 2010;31(8):2034–2042. doi:10.1016/j.biomaterials.2009.11.079
- Li X, Wang B, Zhou S, et al. Surface chemistry governs the sub-organ transfer, clearance and toxicity of functional gold nanoparticles in the liver and kidney. J Nanobiotechnology. 2020;18(1):45. doi:10.1186/s12951-020-00599-1
- Isoda K, Tanaka A, Fuzimori C, et al. Toxicity of gold nanoparticles in mice due to nanoparticle/drug interaction induces acute kidney damage. Nanoscale Res Lett. 2020;15(1):141. doi:10.1186/s11671-020-03371-4
- Ibrahim KE, Al-Mutary MG, Bakhiet AO, Khan HA. Histopathology of the liver, kidney, and spleen of mice exposed to gold nanoparticles. Molecules. 2018;23:1848. doi:10.3390/Molecules23081848
- Abdelhalim MA, Abdelmottaleb Moussa SA. The gold nanoparticle size and exposure duration effect on the liver and kidney function of rats: in vivo. Saudi J Biol Sci. 2013;20:177–181. doi:10.1016/j.sjbs.2013.01.007
- Albeg A, Smith CJ, Chatzigeorgiou M, et al. C. elegans multi-dendritic sensory neurons: morphology and function. Mol Cell Neurosci. 2011;46(1):308–317. doi:10.1016/j.mcn.2010.10.001
- Singhvi A, Liu B, Friedman C, et al. A Glial K/Cl transporter controls neuronal receptive ending shape by chloride inhibition of an rGC. Cell. 2016;165(4):936–948. doi:10.1016/j.cell.2016.03.026
- Galletti F, Strazzullo P, Ferrara I, et al. NaCl sensitivity of essential hypertensive patients is related to insulin resistance. J Hypertens. 1997;15(12):1485–1491. doi:10.1097/00004872-199715120-00017
- Oda S, Tomioka M, Iino Y. Neuronal plasticity regulated by the insulin-like signaling pathway underlies salt chemotaxis learning in Caenorhabditis elegans. J Neurophysiol. 2011;106:301–308. doi:10.1152/jn.01029.2010
- Burton NO, Furuta T, Webster AK, et al. Insulin-like signalling to the maternal germline controls progeny response to osmotic stress. Nat Cell Biol. 2017;19(3):252–257. doi:10.1038/ncb3470
- Minniti AN, Arriagada H, Zúñiga S, et al. Temporal pattern of neuronal insulin release during Caenorhabditis elegans aging: role of redox homeostasis. Aging Cell. 2019;18(1):e12855. doi:10.1111/acel.12855
- Pierce SB, Costa M, Wisotzkey R, et al. Regulation of DAF-2 receptor signaling by human insulin and ins-1, a member of the unusually large and diverse C. elegans insulin gene family. Genes Dev. 2001;15(6):672–686. doi:10.1101/gad.867301
- Leinwand SG, Chalasani SH. Neuropeptide signaling remodels chemosensory circuit composition in Caenorhabditis elegans. Nat Neurosci. 2013;16:1461–1467. doi:10.1038/nn.3511
- Frokjaer-Jensen C, Kindt KS, Kerr RA, et al. Effects of voltage-gated calcium channel subunit genes on calcium influx in cultured C. elegans mechanosensory neurons. J Neurobiol. 2006;66(10):1125–1139. doi:10.1002/neu.20261
- Duan D, Zhang H, Yue X, et al. Sensory glia detect repulsive odorants and drive olfactory adaptation. Neuron. 2020;108(4):707–721 e708. doi:10.1016/j.neuron.2020.08.026
- Shindou T, Ochi-Shindou M, Murayama T, et al. Active propagation of dendritic electrical signals in C. elegans. Sci Rep. 2019;9(1):3430. doi:10.1038/s41598-019-40158-9
- Shtonda B, Avery L. CCA-1, EGL-19 and EXP-2 currents shape action potentials in the Caenorhabditis elegans pharynx. J Exp Biol. 2005;208:2177–2190. doi:10.1242/jeb.01615