Abstract
We present here comparative assessments of murine lung toxicity (biocompatibility) after in vitro and in vivo exposures to carbon (C–SiO2-etched), carbon–silica (C–SiO2), carbon–cobalt–silica (C–Co–SiO2), and carbon–cobalt oxide–silica (C–Co3O4–SiO2) nanoparticles. These nanoparticles have potential applications in clinical medicine and bioimaging, and thus their possible adverse events require thorough investigation. The primary aim of this work was to explore whether the nanoparticles are biocompatible with pneumatocyte bioenergetics (cellular respiration and adenosine triphosphate content). Other objectives included assessments of caspase activity, lung structure, and cellular organelles. Pneumatocyte bioenergetics of murine lung remained preserved after treatment with C–SiO2-etched or C–SiO2 nanoparticles. C–SiO2-etched nanoparticles, however, increased caspase activity and altered lung structure more than C–SiO2 did. Consistent with the known mitochondrial toxicity of cobalt, both C–Co–SiO2 and C–Co3O4–SiO2 impaired lung tissue bioenergetics. C–Co–SiO2, however, increased caspase activity and altered lung structure more than C–Co3O4–SiO2. The results indicate that silica shell is essential for biocompatibility. Furthermore, cobalt oxide is the preferred phase over the zerovalent Co(0) phase to impart biocompatibility to cobalt-based nanoparticles.
Introduction
The potential adverse effects of nano- and micromaterials on human health are of great concern and contemporary interest. The burgeoning need for being vigilant with nanomaterials has increased in the last few decades, as many of them have been considered for a diverse range of applications. These functions include drug delivery, biomedical imaging, catalysis, and sensors. Some nanomaterials have actually obtained commercial use already, a trend that is likely to continue for many more nanomaterials in areas such as renewable energy, environmental remediation, and nanomedicine. The potential toxicities of many nanomaterials, however, remain not fully addressed.
Owing to their structural, chemical, and physical properties, carbon-based nanomaterials have received special interest in biomedical applications.Citation1–Citation3 Furthermore, they are good light absorbers as a result of their extensive conjugated sp2–sp2 linkages and π-orbital electron delocalization.Citation4 Consequently, carbon nanomaterials can serve as heating agents for treatment of cancer via photothermal heating of tumor tissue using near-infrared light.Citation5 In addition, they exhibit high mechanical stiffness and chemical stability due to their carbon atoms’ unique geometric arrangements. This property, along with their high electrical conductivity, makes carbon nanomaterials important building blocks for development of efficient nanosensors for early detection of various human diseases.
Similarly, silica represents another class of nanomaterials that possesses interesting properties suitable for biomedical, biosensing, and drug-delivery applications.Citation6 Furthermore, when used as a nanoshell, silica can serve as a protecting layer, making nanomaterials biologically compatible and water-dispersible. For example, silica was successfully utilized as a shell to coat Fe-based magnetic nanoparticles and reduced direct toxicities associated with the metal.Citation7 Such magnetic metal nanoparticles – typically composed of iron and cobalt – are more suitable for bioimaging.Citation8 Even though cobalt is reported to have mitochondrial toxicity,Citation9 the use of cobalt in nanomedicine is desired, because cobalt nanoparticles boost sensitivity and edge detection on magnetic resonance imaging due to their enhanced magnetic properties.Citation10,Citation11
The use of silica as nanoshell on other nanomaterials is also appealing because the silica shell makes the chemical modification of nanomaterials (eg, with cell-targeting groups) possible due to the reactivity of silanol groups on the silica surfaces.Citation12,Citation13 In addition, silica-based materials and nanoshells are easy to synthesize and remain stable under various biological conditions. These features make silica nanostructures versatile systems for immobilization of diverse types of bioactive molecules, such as cell-targeting groups and antibodies for biological and medical applications.Citation12–Citation14
We recently reported an in vitro method for assessing murine tissue (lung, liver, kidney, spleen, and pancreas) and human cell (lymphocyte and fibroblast) bioenergetics and other biomarkers.Citation15–Citation18 Using the method, for instance, lung tissue was maintained viable in vitro for several hours, allowing its accurate analyses. The same method was employed to show biocompatibility of mesoporous silica nanoparticles in various murine tissues.Citation19
It is known that monitoring mitochondrial function (e.g., measuring oxygen consumption and ATP content) can also serve as a highly sensitive method for assessing apoptosis – the mechanism responsible for initiation and execution of cellular response to injury. The “initiation” phase requires leakage of cytochrome c from the mitochondrial intermembrane to the cytosol. In the cytosol, cytochrome c binds to the apoptotic protease activating factor-1, triggering the caspase cascade (a series of cysteine, aspartate-specific proteases). Caspase activation executes mitochondrial dysfunction and DNA fragmentation. The mitochondrial perturbation involves two processes: 1) the opening up of permeability transition pores, accelerating oxidations in the mitochondrial respiratory chain, and 2) the collapse of the electrochemical potential Δψ.Citation20 Cytochrome c- and apoptosome-independent pathways for caspase activation are also reported.Citation21 Thus, induction and execution of apoptosis are both linked to the mitochondria. Therefore, monitoring mitochondrial function (eg, measuring O2 consumption and adenosine triphosphate [ATP] content) is highly sensitive in assessing apoptosis. Synthetic cell-permeable substrates, such as N-acetyl-DEVD-7-amino-4-methyl coumarin (Ac-DEVD-AMC), have been used to investigate caspase activities. For example, cleavage of Ac-DEVD-AMC by specific caspases releases the fluorogenic AMC; the latter can be separated on high-performance liquid chromatography (HPLC) and detected by fluorescence with great sensitivity.Citation22 We here employed the biomarkers generated by murine lung upon treatment with carbon (C–SiO2-etched), carbon–silica (C–SiO2), carbon–cobalt–silica (C–Co–SiO2), and carbon–cobalt oxide–silica (C–Co3O4–SiO2) nanoparticles to assess in vitro and in vivo biocompatibilities of these nanomaterials.
Materials and methods
Reagents
Pd(II) complex of meso-tetra-(4-sulfonatophenyl)-tetrabenzoporphyrin (Pd phosphor) was purchased from Porphyrin Products (Logan, UT, USA). Ac-DEVD-AMC (MW 729.6) was obtained from Axxora (San Diego, CA, USA). A lyophilized powder of caspase inhibitor I (zVAD-fmk, MW ≈ 467.5) was purchased from Calbiochem (La Jolla, CA, USA). Glucose (anhydrous), bovine serum albumin (free of endotoxins and fatty acids), and the remaining reagents were all received from Sigma-Aldrich (St Louis, MO, USA).
The caspase-3 substrate Ac-DEVD-AMC was dissolved in dimethyl sulfoxide at 6.85 mM and stored at −20°C in small aliquots. The zVAD-fmk solution (2.14 mM) was made by dissolving 1.0 mg of zVAD-fmk in 1.0 mL of dimethyl sulfoxide and stored at −20°C. A freshly prepared Krebs– Henseleit (KH) buffer (115 mM NaCl, 25 mM NaHCO3, 1.23 mM NaH2PO4, 1.2 mM Na2SO4, 5.9 mM KCL, 1.25 mM CaCl2, 1.18 mM MgCl2, and 6 mM glucose, pH ~7.3) was used for the experiments. Pd phosphor solution (2.5 mg/mL = 2 mM) was prepared in dH2O and stored in aliquots at −20°C. NaCN solution (1.0 M) was prepared in dH2O; its pH was adjusted to ~7.0 with 12 N HCl and the solution was then stored at −20°C.
Mice
Male Taylor outbred mice (8–12-wk-old; weight ≈18–22 g) used in this study were maintained at an animal facility that was in compliance with National Institutes of Health guidelines (http://grants.nih.gov/grants/olaw/references/phspol.htm). The mice were purchased from the Jackson Laboratory (Bar Harbor, ME, USA). All mice were housed in rooms maintained at 22°C with ~60% relative humidity and a 12-hour light/dark cycle. All mice had ad libitum access to standard rodent chow and filtered water. All the protocols used in the studies here received approval from the Animal Ethics Committee, United Arab Emirates University College of Medicine and Health Sciences.
In vitro incubation
Lung specimens (about 20 mg each) were excised from anesthetized (urethane, 100 μL/10 g body weight, using 25% solution, in 0.9% NaCl) mice using sharp scissors. The specimens were immediately immersed in ice-cold KH buffer continuously gassed with 95% O2:5% CO2. The incubation mixture (50 mL) contained the same buffer with and without 0.2 or 1.0 mg/mL nanoparticles.Citation15
Intratracheal instillation
Particles were intratracheally instilled as previously described with minor modifications.Citation23 Briefly, mice were anesthetized with an intraperitoneal injection of 70 μg/g pentobarbital. Particles were suspended in 150 μL of 0.9% NaCl and instilled using a 20-gauge cannula (Venflon; BD, Franklin Lakes, NJ, USA). The control mice had 150 μL of 0.9% NaCl instilled in their trachea. One hour after treatment, the mice were killed, and lung specimens were collected and processed as above.
Histology
Tissue was fixed using 10% neutral formalin, dehydrated using increasing concentrations (50%, 70%, 90%, and 100%) of ethanol, cleared with xylene and embedded in paraffin. Three-micrometer sections were prepared from paraffin blocks and stained with hematoxylin and eosin.
Staining for apoptosis was performed using a method involving avidin-biotin immunoperoxidase that can detect activated caspase-3 (Cell Signaling Technology, Boston, MA, USA). The procedure was performed on 5-μm paraffin sections, using rabbit anti-cleaved caspase-3 antibodies; positive control was human breast cancer.
Electron microscopy
Tissue was immersed in McDowell and Trump fixative for 3 hours at 25°C. The tissue was then rinsed with phosphate buffer saline and fixed with 1% osmium tetroxide for 1 hour. Samples were washed with dH2O, dehydrated in graded ethanol and propylene oxide, infiltrated, embedded in agar-100 epoxy resin and polymerized at 65°C for 24 hours. Blocks were trimmed, and semithin and ultrathin sections were cut with a Reichert–Jung Ultracut Ultramicrotome (Leica Microsystems, Wetzlar, Germany). The semithin sections (1 μm) were placed on glass slides and stained with 1% aqueous toluidine blue. The ultrathin sections (95 nm) on 200-mesh Cu grids were contrasted with uranyl acetate followed by lead citrate double stain. The grids were examined and imaged using a CM10 transmission electron microscope (Philips, Amsterdam, Netherlands).
Oxygen measurement
A phosphorescence O2 analyzer was used to monitor O2 consumption by lung specimens, as reported previously. Briefly, O2 detection was performed with the aid of Pd phosphor, which had an absorption maximum at 625 nm and a phosphorescence maximum at 800 nm. Samples were exposed to light flashes (600 per minute) from a pulsed lightemitting diode array with peak output at 625 nm (OTL630A-5-10-66-E; Opto Technology, Wheeling, IL, USA). The emitted phosphorescent light was detected by a Hamamatsu Photonics (Hamamatsu, Japan) photomultiplier tube (R928) after first passing the light through a wide-band interference filter centered at 800 nm. The amplified phosphorescence decay was digitized at 1.0 MHz by a 20 MHz A/D converter (Computer Boards, Inc.).
A program was developed using Microsoft Visual Basic 6, Microsoft Access Database 2007, and Universal Library components (Universal Library for Measurements Computing Devices, http://www.mccdaq.com/daq-software/universal-library.aspx). This allowed direct reading from the PCI-DAS 4020/12 I/O Board (PCI-DAS 4020/12 I/O Board, http://www.mccdaq.com/pci-data-acquisition/PCI-DAS4020-12.aspx). Pulse detection was accomplished by searching for ten phosphorescence intensities > 1.0 V (by default). Peak detection was accomplished by searching for the highest ten data points of a pulse and choosing the data point closest to the pulse-decay curve.Citation17
The phosphorescence decay rate (1/τ) was characterized by a single exponential, ie, I = Ae−t/τ, where I = Pd phosphor phosphorescence intensity.Citation24 The values of 1/τ were linear with dissolved O2: 1/τ = 1/τ° + kq, where 1/τ = the phosphorescence decay rate in the presence of O2, 1/τ° = the phosphorescence decay rate in the absence of O2, and kq = the second-order O2 quenching rate constant in μM/second.Citation24
Lung tissue respiration was measured at 37°C in 1 mL sealed vials by stirring the lung specimen with the aid of parylene-coated stirring bars. In vials sealed from air, O2 decreased linearly with time, indicating the kinetics of mitochondrial O2 consumption was zero-order. The rate of respiration (k, in μM O2/minute) was thus the negative of the slope d(O2)/dt. Sodium cyanide was used to cross-check the process or to determine if O2 was consumed by the mitochondrial respiratory chain; this is possible because sodium cyanide kills the cells and inhibits their mitochondrial respiration.Citation15
ATP content
Lung tissue fragments were homogenized in 0.5 mL of ice-cold 2% trichloroacetic acid for 2 minutes. The supernatants were collected by centrifugation (1000 × g at 4°C for 5 minutes) and stored at −20°C until analysis. Immediately before ATP measurements, the samples were neutralized with 0.5 mL 100 mM Tris-acetate, 2 mM ethylenediaminetetraacetic acid (final pH 7.75). ATP concentration was determined using the Enliten ATP Assay System (Bioluminescence Detection Kit; Promega, Madison, WI, USA). Briefly, 2.5 μL of the supernatant was added to 25 μL of the luciferin/luciferase reagent. The luminescence intensity was measured at 25°C using a Glomax Luminometer (Promega). The standard curve of luminescence intensity vs ATP concentration (10 pM to 100 nM) was linear (R2 > 0.9999). Variations in the luminescence intensity between experiments were due to aging of the reagents.
Intracellular caspase-3 activity
Lung specimens (~25 mg) were collected from the Taylor outbred mice and incubated in vitro at 37°C in 50 mL KH buffer continuously gassed with 95% O2:5% CO2 with and without nanoparticles for up to 6 hours. Samples were removed from the incubation mixture, rinsed with KH buffer, and incubated in oxygenated KH buffer with 32 μM zVAD-fmk (pancaspase inhibitor) or 15 μL DMSO (the vehicle of zVAD-fmk) for 10 minutes (f/v = 1.0 mL). Ac-DEVD-AMC (37 μM) was then added, and the incubation continued for 20 minutes. At the end of the incubation period, the tissue was disrupted by vigorous homogenization and was passed through a 27 G needle. The Ac-DEVD-AMC cleavage reaction was quenched with tissue disruption, mainly because caspases became inactive due to dilution. The supernatant was collected by centrifugation (~16,300 × g for 90 minutes) through a Microcentrifuge Filter (nominal molecular weight limit = 10,000 Dalton; Sigma-Aldrich), separated on HPLC, and analyzed for the free fluorogenic AMC moiety.
HPLC
The analysis was performed on a Waters (Milford, MA, USA) reversed-phase HPLC system, which consisted of a manual injector, a pump, and a fluorescent detector. An excitation wavelength of 380 nm and an emission wavelength of 460 nm were chosen or used for the experiments. Solvents A and B were HPLC-grade methanol:dH2O 1:1 (isocratic). Alternatively, solvent A was 1:3 ratio of HPLC-grade CH3CN:dH2O and solvent B was dH2O (isocratic); both protocols gave the same results. The column, a 4.6 × 250 mm Beckman Ultrasphere IP column (BD), was operated at 25°C at 1.0 mL/minute (0.5 mL/minute for each pump). The run time was 45 minutes, and the injection volume was 20 μL.
Synthesis of nanoparticles
The core–shell nanoparticles studied here were synthesized by adopting the previously reported synthetic method that led to carbon/silica core–shell nanoneedles (CNNs).Citation25 In the synthesis, cellulose nanofibers were first prepared from sisal (Agave sisalana) by acid hydrolysis of bulk cellulose.Citation26 The resulting cellulose nanofibers were used as the precursor of carbon (and as the core material) in the final nanoparticles.
In typical synthesis, 14 g of natural sisal fiber was cut and washed with 400 mL solution of toluene:ethanol (1:1 ratio) under reflux for 12 hours. The solid material was recovered from the solution by filtration and dried at room temperature. The recovered solid was treated with 1 M NaOH solution (300 mL) for 12 hours, after which the mixture was filtered. The resulting solid material was then treated with 3% aqueous H2O2 solution (100 mL) for 6 hours, and the mixture was filtered. This treatment of the solid material with NaOH and H2O2 alternatively was repeated three times. The resulting material (pure bulk cellulose) was washed several times with water to completely remove any residual NaOH and H2O2 off the cellulose nanofibers.
The bulk cellulose (2 g) was then mixed with 80 mL of 65% sulfuric acid solution, and the mixture was stirred at 72°C for 30 minutes at 800 rpm. The resulting mixture was centrifuged for 5 minutes at 5000 rpm. The supernatant was decanted, and the precipitate was recovered and redispersed in water. Centrifugation of the mixture and redispersion of the precipitate in distilled water were repeated until the liquid phase became opaque. The liquid phase and the solid were then sonicated for 6 hours. The mixture was centrifuged again at 5000 rpm for 5 minutes. The liquid phase was collected and centrifuged for 15 minutes at 12,000 rpm, producing cellulose nanofibers. The resulting cellulose nanofibers were dispersed in water to obtain 80 mL solution.
The cellulose nanofibers were then coated with silica shells as follows. First, 12 mL of the above solution containing the cellulose nanofibers was dispersed in 100 mL of absolute ethanol. Into this mixture, 5 mL of NH3 solution (28%) was added. After stirring the mixture with a magnetic stirrer for 1 hour, followed by sonication in an ultrasonicator bath for 5 minutes, 100 μL of tetraethyl orthosilicate was added into it. The mixture was sonicated further for 30 minutes, and then stirred with a magnetic stirrer for another 12 hours. The resulting solid material was recovered from the solution by centrifugation, dried in an oven, and ground into powder using a mortar and pestle. The solid powdered material was calcined at 1200°C for 3 hours, generating the C–SiO2 core–shell nanoparticles. By treating 50 mg of the C–SiO2 sample with 50 mL of 1.0 M NaOH solution for 2 hours, the silica shell from the material was removed, leaving behind carbon nanoparticles, labeled as C–SiO2-etched.
The cobalt-containing carbon nanoparticles were synthesized by following a similar procedure as above, except Co(NO3)2 was added along with tetraethyl orthosilicate during the deposition step of the silica shells. Specifically, into 12 mL dispersion of cellulose nanofibers, 50 mg of Co(NO3)2 · 6H2O was added, followed by 100 μL of tetraethyl orthosilicate in 100 mL of absolute ethanol. The resulting material was treated under different calcination temperatures to obtain samples containing different phases of cobalt. The C–Co–SiO2 core–shell–shell nanoparticles were obtained by treating the above material at 1100°C for 3 hours whereas the C–Co3O4–SiO2 core–shell–shell nanoparticles were obtained by treating the material at 1000°C for 3 hours.
Dynamic light scattering
To analyze the size of the nanoparticles further, dynamic light-scattering (DLS) experiments were performed on the samples using a Zetasizer Nano ZS90 (Malvern Instruments, Malvern, UK). The DLS measurements were carried out at a scattering angle of 90° and at 25°C. Prior to the DLS measurements, the nanoparticles (5 mg) were dispersed in water (5 mL), and the mixture was sonicated in a bath sonicator to form well-dispersed nanoparticles. The dispersion (2 mL) was then placed in a polystyrene cuvette having an optical path length of 1 cm and measured by DLS. The reported values or data represent the average of three runs for each sample.
Statistical analysis
Data were analyzed using SPSS statistical package version 19 (IBM, Armonk, NY, USA). The nonparametric (two independent variables) Mann–Whitney test was used to compare treated and untreated samples.
Results
Properties of nanoparticles
The structural features and composition of the nanoparticles synthesized above were characterized by using various analytical techniques, including powder X-ray diffraction (XRD), Fourier-transform infrared spectroscopy (FTIR), Raman spectroscopy, DLS, and transmission electron microscopy (TEM). The results are compiled in , including the TEM images of the samples. Additional characterization data are presented in –). The powder XRD patterns of C–SiO2 and C–SiO2 showed no diffraction patterns indicating that these two materials were exclusively amorphous. However, the powder XRD patterns of Co–SiO2 and C–Co3O4–SiO2 nanoparticles showed some diffraction peaks corresponding to metallic Co and Co3O3, respectively. Comparative FTIR spectra of unetched and etched nanoparticles (eg, C–SiO2 versus C–SiO2-etched nanoparticles) showed significant differences. Whereas a strong Si–O stretching band at around 1100 cm−1 that is characteristic of SiO2 was observed in the FTIR spectrum of C–SiO2, no such band was observed in the FTIR spectrum of C–SiO2–etched. This clearly suggests that the silica shells around the C–SiO2 core–shell nanoparticles were completely removed after treatment of these nanoparticles with dilute NaOH solution.
Table 1 Physical properties of the carbon-, cobalt-, and silica-based nanomaterials studied
From , it is also worth noting that the cobalt ions encapsulated within the core–shell nanoparticles were turned into either metallic Co or Co3O4 nanoparticles simply by changing the pyrolysis temperature employed during the synthesis. The thermal treatment also allowed the cellulose to convert to amorphous or graphitic carbon. Thus, by varying the pyrolysis temperature as well as the synthetic conditions, different samples that enabled us to investigate composition-dependent cytotoxicity of the nanoparticles were obtained.
C–SiO2-etched nanoparticles
The effects of C–SiO2-etched nanoparticles on lung tissue respiration, ATP content, caspase activity, and structure were investigated following in vitro and in vivo treatments. The in vitro doses were 0.2 mg/mL () and 1.0 mg/mL (), and the in vivo doses were 5 mg/mL () and 10 mg/mL ( and ).
Figure 1 (A–I) Biocompatibility of C–SiO2-etched nanoparticles with lung respiration, adenosine triphosphate (ATP) content, caspase activity, and histology. (A–C) Lung specimens were incubated in vitro at 37°C in oxygenated Krebs–Henseleit (KH) buffer with and without 0.2 mg/dL C–SiO2-etched nanoparticles. Cellular respiration and caspase activity were then measured as a function of time. Representative O2 runs are shown in (A). Samples were alternatively removed from the incubation mixture, rinsed with KH buffer, and immediately placed in the phosphorescence analyzer for O2 measurement. Minute zero corresponds to the addition of the C–SiO2-etched sample. The rate of pneumatocyte mitochondrial O2 consumption (k, μM O2/minute) is set as the negative of the slope of O2 vs t; the values of kc (in μM O2/minute/mg) are shown at the bottom of each run (U, untreated; T, treated). A summary of the values of kc for all experiments is shown in (B). The P-value is for comparison with the untreated condition; “n” is the number of independent measurements. Caspase activity with and without the pancaspase inhibitor zVAD-fmk is shown in (C). (D–F) Lung specimens were collected 60 minutes after intratracheal instillation of 5 mg C–SiO2-etched sample or 150 μL NaCl. The samples were then incubated in vitro at 37°C in oxygenated KH buffer. Cellular respiration, ATP content, and caspase activity (F) were measured as a function of time. Representative O2 runs, values of kc, and cellular ATP (expressed as luminescence intensity mg/106) are shown in (D and E). (G–I) Representative histology (hematoxylin and eosin) at 4 hours for untreated (G, 40×), in vitro-treated (H, 40×), and intratracheally treated (I, 20×) lungs. The untreated lung tissue (G) demonstrated preserved pulmonary architecture with rare apoptotic bodies (arrow) and cytoplasmic vacuolization (arrowhead). The in vitro treatment (H) revealed foci of alveolar wall necrosis necrosis and a few apoptotic bodies. The in vivo treatment (I) revealed preserved pulmonary architecture with focal sloughing of bronchial epithelial cells, intact alveolar wall and intravascular margination of lymphoid cells.
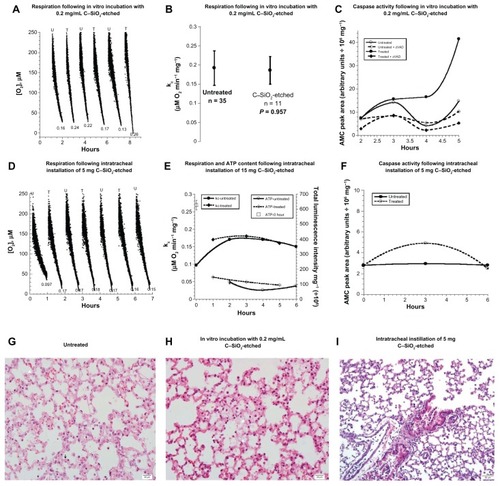
For the in vitro treatment, lung specimens (16–27 mg) were incubated at 37°C in oxygenated KH buffer with and without 0.2 or 1.0 mg/mL C–SiO2-etched nanoparticles. Samples were then alternatively removed from the incubation mixture, rinsed with KH buffer, and placed in the phosphorescence analyzer to measure the concentration of O2 at 37°C. Representative runs for the specimens treated with the 0.2 mg/mL dose are shown in , and a summary of all the results is given in . The rate of pneumatocyte mitochondrial O2 consumption (mean ± standard deviation, rate of cellular respiration [kc], in μM O2/minute/mg) for untreated tissue was 0.187 ± 0.042 (n = 33) and for treated tissue was 0.186 ± 0.036 (n = 11, P = 0.957). Similar results were obtained with in vitro treatment of the specimens with 1.0 mg/mL dosage (). Cellular ATP contents for 1 ≤ t ≤ 5 were consistently found to be similar in treated and untreated specimens ( and ). The sharp decline in cellular ATP and the lower rate of respiration for t = 0 demonstrated the inability to sustain in vivo levels of pneumatocyte bioenergetics (). Otherwise, the data indicated reasonable biocompatibility of C–SiO2-etched nanoparticles with pneumatocyte bioenergetics.
Caspase activity was also monitored in treated and untreated lung specimens. The synthetic caspase-3 substrate Ac-DEVD-AMC was used for this purpose. Lung specimens were incubated in vitro at 37°C in oxygenated KH buffer with and without 0.2 mg/mL C–SiO2-etched nanoparticles for up to 5 hours. The samples were then rinsed and incubated with Ac-DEVD-AMC for 20 minutes in the presence and absence of the pan-caspase inhibitor zVAD-fmk. Caspases cleaved Ac-DEVD-AMC, releasing the fluorogenic moiety AMC. After tissue disruption, the supernatants were separated on HPLC, and the AMC moieties were detected by fluorescence. The AMC peak area (arbitrary units/106 mg) markedly increased at t ≥ 4 hours in the tissue treated with C–SiO2-etched sample. zVAD-fmk blocked ~87% of the AMC cleavage reaction, confirming that the reaction was mainly mediated by caspases ().
Lung histology was studied immediately (0 hour) and 2, 3, 4, and 5 hours after the tissue was incubated with the nanoparticles. Representative images taken 4 hours after incubation are shown in . Alveolar structure remained preserved in the untreated specimen (). The specimen treated with C–SiO2-etched nanoparticles, on the other hand, showed foci of alveolar wall necrosis and a few apoptotic bodies (). Similar alterations were seen in the specimen treated with 1.0 mg/mL C–SiO2-etched nanoparticles (). Thus, the caspase activity and histology data demonstrate the cytotoxicities of the C–SiO2-etched nanoparticles. These findings were further confirmed by the caspase-3 staining results (see below).
Intratracheal instillation of 5 and 10 mg C–SiO2-etched nanoparticles was then investigated. Intratracheal instillation of 150 μL 0.9% NaCl was done for the control mice. Lung specimens were collected 1 hour after treatment with C–SiO2-etched sample. The specimens were then incubated at 37°C in oxygenated KH buffer, and they were then evaluated for respiration, ATP content, caspase activity, and histology as a function of time. The value of kc for mice treated with 0.9% NaCl was 0.15 ± 0.04 (n = 16), for mice treated with 5 mg particles was 0.17 ± 0.01 (n = 3, P = 0.634; ), and for mice treated with 10 mg particles was 0.18 ± 0.03 (n = 3, P = 0.303; ).
ATP content (expressed as total luminescence intensity per mg/106) was 87.7 ± 26.0 (n = 3, t = 2–6 hours) for mice treated with intratracheal instillation of 0.9% NaCl, whereas ATP content was 118.0 ± 26 (n = 3, t = 1–5 hours, P = 0.200) for mice treated with 5 mg dosage of C–SiO2-etched nanoparticles (). The corresponding values for mice treated with 10 mg dosage were 383.3 ± 39.1 (n = 3, t = 1–6 hours) and 583.3 ± 60.6 (n = 3, t = 1–5 hours, P = 0.100), respectively ().
Only a slight increase in the AMC peak area was noted at t = 3 hours in mice treated with intratracheal instillation of 5 mg particles (). Similarly, lung histology of the specimen treated with C-SiO2-etched nanoparticles () showed less pronounced structural alternations than those seen with in vitro treatment. Thus, the in vitro treatment of the specimens with C-SiO2-etched nanoparticles resulted in more toxicity than the intratracheal instillation.
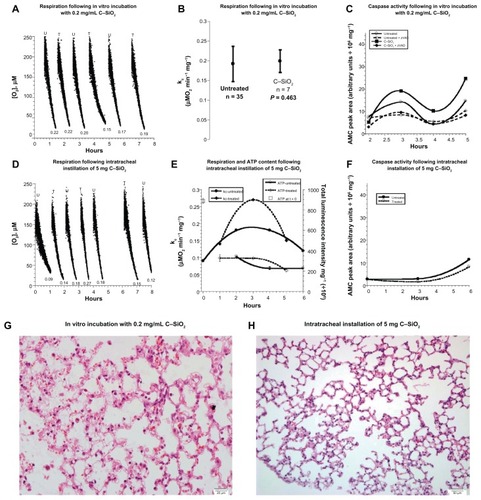
C–SiO2 nanoparticles
The same experiments were performed for C–SiO2 nanoparticles. For the in vitro treatments, respiration rates (μM O2/minute/mg) were 0.187 ± 0.042 without particles and 0.199 ± 0.029 (n = 7, P = 0.463) with 0.2 mg/mL C–SiO2 nanoparticles (). Caspase activities in the cells treated with C–SiO2 nanoparticles were higher than caspace activities in untreated specimens (). This was corroborated by results obtained from caspase-3 staining experiments (see below). Similar findings were noted with 1.0 mg dosage (). In vivo treatment (5 mg) consistently showed relatively stable respiration, ATP content, and caspases for 0 ≤ t ≤ 6 hours ( and ). Histology also confirmed that the lung structure remained preserved for both modalities of treatment (, and ). These data show reasonable biocompatibility of C–SiO2 nanoparticles with murine lung (). Thus, compared to C–SiO2-etched nanoparticles, caspase activity, and structural alterations were less pronounced for the nanoparticles containing silica shells (C–SiO2).
Figure 2 (A–H) Biocompatibility of C–SiO2 with lung respiration, adenosine triphosphate (ATP) content, caspase activity, and histology. (A–C) Lung specimens were incubated in vitro at 37°C in oxygenated Krebs–Henseleit (KH) buffer with and without 0.2 mg/dL C–SiO2. Cellular respiration and caspase activity were then measured as a function of time, as described in . Representative O2 runs are shown in (A); the values of kc (μM O2/minute/mg) are shown at the bottom of each run (U, untreated; T, treated). A summary of the values of kc for all experiments is shown in (B). The P-value is for comparison with the untreated condition; “n” is the number of independent measurements. Caspase activity with and without zVAD-fmk is shown in (C). (D–F) Lung specimens were collected 60 minutes after intratracheal instillation of 5 mg C–SiO2-etched or 150 L 0.9% NaCl. The samples were then incubated in vitro at 37°C in oxygenated KH buffer. Cellular respiration, ATP content and caspase activity (F) were measured as a function of time. Representative O2 runs, values of kc, and cellular ATP are shown in (D and E). (G,H) Representative histology (hematoxylin and eosin, 40×) at 4 hours for in vitro-treated (G) and intratracheally treated (H) lungs, both revealing preserved pulmonary architecture.
C–Co–SiO2 and C–Co3O4–SiO2 nanoparticles
In vitro treatment of lung specimens with 0.2 mg/mL of cobalt-containing nanoparticles resulted in impairments of cellular respiration. The value of kc (μM O2 minute/mg) for specimens without any nanoparticles was 0.187 ± 0.042, with C–Co–SiO2 nanoparticles was 0.130 ± 0.050 (n = 7, P = 0.014), and with C–Co3O4–SiO2 nanoparticles was 0.216 ± 0.042 (n = 7, P = 0.198; ). Furthermore, the result () indicated that the specimens treated with C–Co–SiO2 nanoparticles showed the highest caspase activity after t = 4 hours (). The AMC peak areas (arbitrary unit/106) were 7.9 without particles, 47.8 (sixfold increment) with C–Co–SiO2 nanoparticles, and 22.9 (~threefold increment) with C–Co3O4–SiO2 nanoparticles. In vivo treatment of the specimen (10 mg intratracheal instillation of C–Co–SiO2 nanoparticles) also resulted in inhibition of respiration; the values of kc progressively decreased over 4 hours (). The values of kc increased over 6 hours in the presence of C–Co3O4–SiO2 nanoparticles (). As shown in , specimens treated with C–Co3O4–SiO2 nanoparticles had increased cellular respiration but lower ATP due to uncoupling of oxidative phosphorylation. Thus, both types of cobalt containing nanoparticles (C–Co–SiO2 and C–Co3O4–SiO2) impaired lung tissue bioenergetics.
Figure 3 (A– J) Biocompatibility of C–Co–SiO2 and C–Co3O4–SiO2 with lung respiration, adenosine triphosphate (ATP) content, caspase activity, and histology. (A and B) Lung specimens were incubated in vitro at 37°C in oxygenated Krebs–Henseleit (KH) buffer with and without 0.2 mg/dL C–Co–SiO2 or C–Co3O4–SiO2. A summary of the values of kc (μM O2/minute/mg) for all experiments is shown in (A). The P-values are for comparisons with the untreated condition; “n” is the number of independent measurements. Representative high-performance liquid chromatography (HPLC) runs at 4 hours are shown in (B). Briefly, lung specimens were incubated at 37°C with 37 Ac-DEVD-AMC μM for 20 minutes. The tissues were then disrupted by vigorous homogenization, and the supernatants were separated on HPLC and analyzed for the free AMC moiety. Ac-DEVD-AMC had a retention time, Rt, of ~4.5 minutes (insert) and AMC of ~12.7 minutes (running solvents, CH3CN:dH2O 1:3). (C–F) Lung specimens were collected 60 minutes after intratracheal instillation of 10 mg C–Co–SiO2, 10 mg C–Co3O4–SiO2, or 150 μL 0.9% NaCl. The samples were then incubated in vitro at 37°C in oxygenated KH buffer. Cellular respiration and caspase activity were measured as a function of time. Representative O2 runs are show in (C and D); the values of kc (μM O2/minute/mg) are shown at the bottom of each run. Representative HPLC runs of the samples 4 hours after incubation of the specimen with the nanoparticles are shown in (E). Ac-DEVD-AMC had a retention time, Rt, of ~2.5 minutes (insert) and AMC of ~4.7 minutes (running solvents, methanol:dH2O 1:1). The AMC peak area is plotted as a function of time in (F). (G–J) Representative histology (hematoxylin and eosin) 4 hours after in vitro treatment (G and H) and intratracheally treated (I and J) lungs with C–Co–SiO2 (G and I), or C–Co3O4–SiO2 (H and J). The in vitro treatment with C–Co–SiO2 (G, 40×) revealed necrosis of the alveolar wall (arrow) and numerous apoptotic bodies (arrowheads), compared with a better-preserved area of the alveolar wall. Similar alterations were noted with C–Co3O4–SiO2 (H, 20×). The in vivo treatment with C–Co–SiO2 revealed focal areas of alveolar wall damage and apoptotic bodies (arrows) adjacent to bronchioles. (I, 20×). The in vivo treatment with C–Co3O4–SiO2 revealed pulmonary tissue with preserved architecture. The alveolar wall is thinned, and there is vacuolization of pneumocytes and endothelial cells, with loss of definite cell outlines (J, 20×).
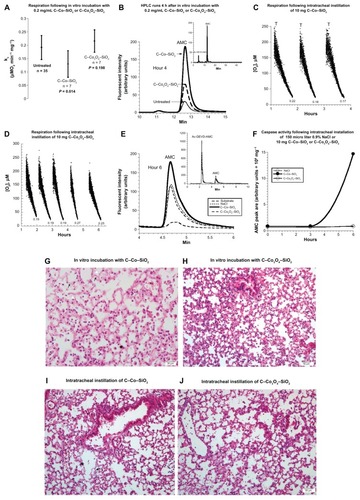
With respect to intratracheal instillation of 10 mg nanoparticles, a marked increase in caspase activity was noted in the specimen treated with C–Co–SiO2 after 6 hours (); however, caspase activity in the specimen treated with C–Co3O4–SiO2 remained the same as that in the untreated specimen over t = 0–6 hours (). Thus, caspase activity was more prominent in specimens treated with C–Co–SiO2 treatment.
In vitro and in vivo treatments with C–Co–SiO2 nanoparticles revealed alveolar wall necrosis with numerous apoptotic bodies (). The structural alterations were somewhat less pronounced with C–Co3O4–SiO2 nanoparticles (). Thus, C–Co–SiO2 nanoparticles were overall less biocompatible than C–Co3O4– SiO2 nanoparticles.
Electron microscopy images
TEM images of lung specimens incubated at 37°C with 200 μg/mL nanoparticles for 5 hours were obtained. Like the histology results, the TEM results indicated that C–Co–SiO2 and C–SiO2-etched nanoparticles produced ultrastructural alterations and were toxic. In particular, C–Co–SiO2 was the most toxic, producing mega-mitochondria () whereas C–SiO2-etched nanoparticles produced apoptotic changes and swollen mitochondria (). Cellular ultrastructure was relatively preserved in specimens treated with C–SiO2 () or C–Co3O4–SiO2 (). Staining for cleaved caspase 3 as a biomarker for apoptosis concomitantly showed abundant apoptotic cells with all of the four different types of nanoparticles studied here ().
Figure 4 (A–D) Transmission electron microscopy images of lung specimens incubated in vitro at 37°C with and without 200 μg/mL nanoparticles for 5 hours. (A) C–SiO2-etched specimen, showing apoptotic cell (Ap) with fragmented nucleus (N) and plasma membrane (arrows). Note electron-dense intracytoplasmic particles (thin arrows), magnification 700,000×. (B) C–SiO2-treated specimen, showing mesothelial cell (M) with cytoplasmic electron-dense particles centered around lysozymes (arrows), magnification 700,000×. (C) C–Co–SiO2-treated specimen, showing type II pneumocyte (Pn) with a lamellar body (L), mega-mitochondria (m) and electron-dense cytoplasmic particles (arrows), magnifications: left 180,000×, right 350,000×. (D) C–Co3O4–SiO2-treated specimen, showing type II pneumatocyte (Pn) with electron-dense particles (arrow) within a vacuole adjacent to a lamellar body (L), magnification 980,000×.
Abbreviation: RBC, red blood cell.
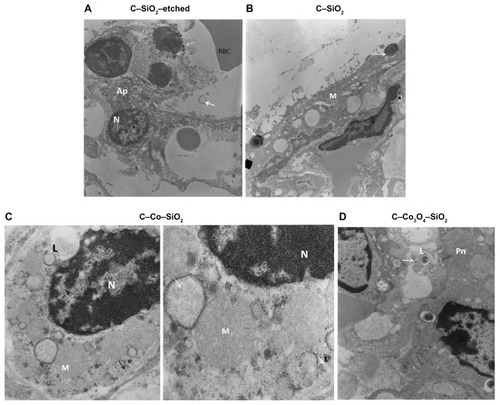
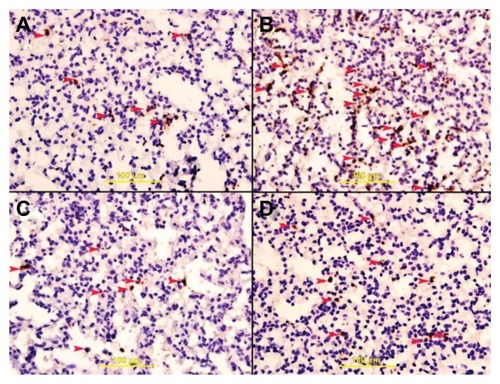
Figure 5 (A–D) Caspase-3 staining. Lung specimens were incubated in vitro at 37°C with and without 0.2 mg/mL core–shell nanomaterials composed of carbon, cobalt, and silica for 5 hours. The samples were then rinsed with Krebs–Henseleit buffer and stained with anti-cleaved caspase-3 antibody. (A) Specimen treated with C–SiO2-etched nanoparticles showing apoptotic cells with brown granular cytoplasm (arrowheads); (B) specimen treated with C–SiO2 nanoparticles showing apoptotic cells (arrowheads); (C) samples treated with C–Co–SiO2,showing apoptotic cells (arrowheads); and (D) specimen treated with C–Co–SiO2 nanoparticles showing apoptotic cells (arrowheads).
Discussion
Lung toxicities of the following nanoparticles were studied: carbon (C) nanoparticles (labeled as: C–SiO2-etched), carbon–silica (core–shell) nanoparticles (labeled as: C–SiO2), carbon–cobalt–silica (core–shell–shell) nanoparticles (labeled as: C–Co–SiO2); and carbon–cobalt oxide–silica (core–shell– shell) nanoparticles (labeled as: C–Co3O4–SiO2). These and related nanoparticles have potential biological applications due to the unique magnetic properties of cobalt, the photothermal heating properties of carbon for thermotherapy of tumor tissue using near-infrared light, and the biocompatibility and ease of surface modification of silica with various bioactive functional groups. The toxicities of such nanoparticles, however, have not been adequately explored.
The primary aim of this work, thus, was to investigate the biocompatibility of these nanoparticles with pneumatocyte respiration (mitochondrial O2 consumption), especially since inhalation is a common way of exposure to these types of materials, which are increasingly being investigated and commercialized. The term “pneumatocyte respiration” implies delivery of O2 and metabolic fuels to the mitochondria, oxidation of reduced metabolic fuels with passage of electrons to O2, and synthesis of ATP. Impaired respiration thus entails an interference with any of these processes.
Lung tissue O2 consumption was measured with the aid of the phosphorescence oxygen analyzer using Pd(II)-meso-tetra-(4-sulfonatophenyl)-tetrabenzoporphyrin as a probing phosphor. This detection is based on the principle that O2 quenches the phosphorescence of the Pd(II)-based phosphor, ie, the phosphorescence intensity is inversely related to O2 concentration.Citation24 The results show reasonable in vitro and in vivo biocompatibility of C–SiO2-etched and C–SiO2 nanoparticles with pneumatocyte respiration ( and ). Pneumatocyte bioenergetics, on the other hand, is significantly altered in the presence of C–Co–SiO2 or C–Co3O4–SiO2, consistent with the known toxicity of cobalt toward mitochondrial respiration.Citation27,Citation28
The study also addressed lung tissue caspase activity of the nanoparticles investigated here. Caspase activity was determined by measuring the fluorescent moiety (ie, AMC) formed via a caspase dependent process from Ac-DEVD-AMC. Cobalt and carbon are known to potently target the mitochondria, causing loss of mitochondrial respiration and potential (Δψm) and release of apoptotic factors (eg, apoptosis-inducing factor).Citation9 This known toxicity was most likely the reason behind the increased caspase activity in the specimens treated with C–SiO2-etched nanoparticles () and C–Co–SiO2 nanoparticles (). On the other hand, pneumatocyte respiration remained preserved in specimens treated with C–SiO2-etched nanoparticles, despite increased caspase activity in them (). Therefore, monitoring both biomarkers (respiration and caspase activity) is necessary for reliable assessments of cytotoxicity.
Structural alterations were seen in specimens treated with C–SiO2-etched and C–Co–SiO2 nanoparticles, especially in vitro. The structural alterations included focal areas of necrosis, apoptotic cells, and swollen and mega-mitochondria (, , and ).
The observed impaired respiration and induction of caspases by C–Co–SiO2 and C–Co3O4–SiO2 nanoparticles ( and ) are consistent with the known toxicities of cobalt.Citation27,Citation28 Activated caspases permeabilize the mitochondria and disrupt their function and structure. The involvement of mitochondria in apoptosis justifies monitoring respiration for a better assessment of cellular toxicities.Citation21,Citation29 It is worth emphasizing that uncoupling oxidative phosphorylation is a common mitochondrial toxicity, which produces increased rate of respiration and decreased cellular ATP (as noted in the specimens treated with the C–Co3O4–SiO2 nanoparticles ).
The caspase activity data can be correlated with the morphological changes. For instance, the carbon–silica core–shell (C–SiO2) nanoparticles resulted in insignificant caspase activity with well-preserved lung structure in the specimens ( and ). C–SiO2-etched (the carbon–silica core–shell after removal of their silica shell) nanoparticles, on the other hand, produced increased caspase activity with structural alternations on the specimens after 6 hours ( and ). Thus, the silica shells present in C–SiO2 nanoparticles must have made these nanoparticles biocompatible with murine lung by ameliorating any possible toxicity associated with carbon.
The caspase activity data also demonstrate that the toxicity of cobalt-containing nanoparticles may hinge on the cobalt phase. Whereas the C–Co3O4–SiO2 sample, in which the cobalt is present as an oxide, exhibited less caspase activity, the C–Co–SiO2 sample, where the cobalt is present in a zero-valence state, shows much more caspase activity (). Therefore, for in vivo applications, the cobalt oxide (Co3O4) phase is relatively less toxic and thus more preferable than the zero-valent Co(0) phase.
These results were corroborated by elemental analysis of cobalt ions that could possibly leach from the nanoparticles and make their way into the solution and contact the cells. By using ultraviolet-visible spectroscopy (see Materials and Methods for the detailed experimental procedures and – section for the results), the mol of cobalt species. For TA present in the solution was determined. The results (–) indicated that the amount of cobalt leached from the nanoparticles containing metallic cobalt, ie, C–Co–SiO2, was about 2.4 times higher than from those containing cobalt oxide, or cobalt in the form of cobalt(II), ie, C–Co3O4–SiO2. This result is consistent with the higher toxicity exhibited by C–Co–SiO2 compared with C–Co3O4–SiO2. In other words, the fact that C–Co–SiO2 nanoparticles release more cobalt into the solution might be responsible for the material’s higher toxicity compared with C–Co3O4–SiO2 nanoparticles. This also implies that the Co3O4 phase might be more desirable than the Co phase for biological applications.
These results are both similar to and different from the observations made and the results reported by Wang et alCitation30 on different but related metal oxide-based nanomaterials, specif ically cuprous oxide nanoparticles (CONPs). Based on TEM studies, Wang et al showed that CONPs enter mitochondria, damage cell membranes, and induce apoptosis. The CONPs were also implicated to form reactive oxygen species and initiate lipid peroxidation of the liposomal membrane, which in turn affect many cell-signaling pathways and influence vital movements of cells. The authors also demonstrated that low concentrations of CONPs could selectively kill tumor cells, indicating their potential as nanomedicines for cancer treatment. By using flow cytometry, the authors further studied the mechanism by which CONPs cause cytotoxicity and cell death. Based on apoptosis and necrosis discrimination assays, the authors showed that CONPs exhibit dose-dependent necrosis and apoptosis in HeLa cells but not in embryonic fibroblast cells. This result highlighted CONPs’ selective antitumor properties and potential uses as nanomedicine. In addition to these studies, the authors investigated cellular respiration of cells in the presence of CONPs. Their results indicated that the protein complexes responsible for electron transport chain or respiration in the cells contained cuprous ions in the active centers. Based on this result, they concluded that the CONPs release cuprous ions, which complex with proteins and thereby affect the electron transfer process in the respiratory chain, causing tumor cells to lack energy and start the apoptotic process. Hence, the results presented by Wang et alCitation30 support why our C–Co–SiO2 nanoparticles, which released more cobalt ions in solution, exhibited higher toxicity than our C–Co3O4–SiO2 nanoparticles, which produced much fewer cobalt ions in solution.
Intratracheal instillation is a well-recognized in vivo method of particle delivery. It offers direct administration of optimum dosage of drugs, avoiding upper-airway filtration.Citation31 Furthermore, this alternative route to inhalation is relatively simple and requires fewer devices and less labor. In addition, the risk of accidental exposure during experimentation is lower with this method. Dosage, however, is an important variable. In previous studies in rats, 5–21 mg fixed dosages were employed.Citation32,Citation33 In a study in mice, a dosage of 1–5 mg/kg was used.Citation34 In another example, murine pulmonary toxicity of single-wall carbon nanotubes was evaluated using 0.1 and 0.5 mg total dosage.Citation35 In our case, each experiment was conducted by using 5 and 10 mg intratracheal instillation dosage.
In summary, the results here show varying degrees of functional and structural toxicities of C–SiO2, C–SiO2-etched, C–Co–SiO2, and C–Co3O4–SiO2 nanoparticles in murine lung. Our findings are consistent with the known inhibition of mitochondrial function by cobalt materialsCitation4,Citation27,Citation28 and induction of apoptosis by carbon nanotubes.Citation36 Moreover, our results indicate that silica shells could help in improving the biocompatibility of inherently toxic nanoparticles. Finally, our findings suggest that cobalt oxide is a preferred phase over zero-valent Co(0) phase.
Supplementary materials
Analysis of cobalt ions possibly leached from cobalt-based nanoparticles into solution
Many metal ions are known to leach from their corresponding nanoparticles. Thus, we can expect that the cobalt ions in the cobalt-based nanomaterials could also leach and find their way into the solution. Furthermore, the amount of cobalt that could leach from the nanoparticles could vary from one type of nanoparticle to another. Most importantly, the leached metal ions may be responsible for the biological activities exhibited by the nanoparticles in solutions or for the different biological results we observed for the different nanoparticles we synthesized. Hence, the amount of soluble cobalt ions in solutions containing the cobalt-based nanoparticles was analyzed. This was achieved by using colorimetric analysis.Citation1–Citation3 Colorimetric assay was employed for analysis of Co species in the solution because it is very suitable and yet easy to use for the analysis of cobalt ions present in aqueous media (ie, cobalt ions leached into aqueous solution from the Co-based nanoparticles, in our case). Furthermore, interferences or cross-reaction are not expected to affect the analysis, because there is no other metallic element than cobalt in our case.
In a colorimetric analysis, the metal ions are quantified by using the Beer–Lambert law, which takes into account the relationships between the concentrations of optically active species of the metal ions with their absorbance. To successfully use the method, the metal ions should first be converted into optically active species if they are not optically active by themselves. This can be done by using ligands that form optically active metal–ligand complexes. In the case of the cobalt ions, this can easily be done by using ammonia, with which cobalt ions form stable and optically active hexaamminecobalt(III) complexes. Even if the ligand (ie, ammonia) is used in excess, the free ligand molecules in the solution do not affect the result because they do not absorb in the visible range of electromagnetic radiation. The quantification of the ions is then carried out by comparing the absorbance of the solution containing cobalt ions with a calibration curve generated using standard Co(III) ions with well-known concentrations ( and ).
Experimental procedure for colorimetric determination of cobalt from nanoparticles studied
First, 20 mg of the samples (C–Co–SiO2 or C–Co3O4–SiO2) were dispersed in 200 μL of distilled water. After keeping the solution for 24 hours, the particles were removed by centrifugation. The supernatant was used in the colorimetric determination of Co2+ by ultraviolet-visible spectroscopy. To perform this, 6 μL of NH3 was added into the supernatant to form a (Co[NH3]6)2+ complex. The Co2+ ions were then analyzed by using the absorption signal corresponding to (Co[NH3]6)2+.
shows that the amount of cobalt leached from the sample containing metallic cobalt (ie, C–Co–SiO2 nanoparticles) was about 2.4 times higher than that from the sample containing cobalt oxide (ie, C–Co3O4–SiO2 nanoparticles). The higher amount of Co2+ released from the former may also be the reason behind the higher toxicity of C–Co–SiO2 nanoparticles compared with C–Co3O4–SiO2 nanoparticles, and conversely for the Co3O4 phase to be more desirable for biological applications.
Figure S1 Powder X-ray diffraction patterns of C–SiO2, C–SiO2-etched, C–Co3O4– SiO2, and C–Co–SiO2 nanoparticles investigated.
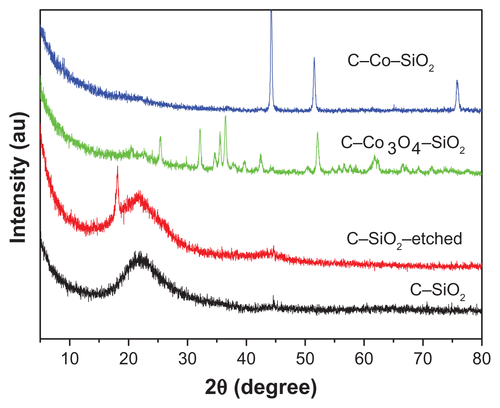
Figure S2 Fourier-transform infrared spectra of C–SiO2 and C–SiO2-etched nanoparticles.
Notes: The strong Si–O stretching band observed at around 1100 cm−1 in the C–SiO2 sample is completely absent in the C–SiO2-etched sample. This indicates that the silica shells around the C–SiO2 core–shell nanoparticles were completely removed after treatment of these nanoparticles with dilute NaOH solution.
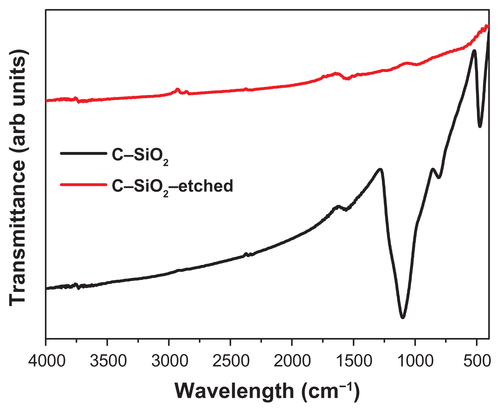
Figure S3 Size distribution of nanoparticles determined by dynamic light scattering for (A) C–SiO2, (B) C–SiO2-etched, (C) C–Co3O4–SiO2, and (D) C–Co–SiO2 nanoparticles.
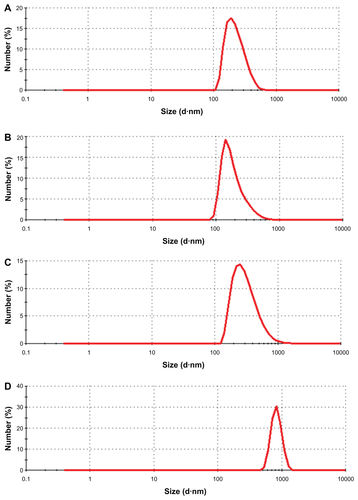
Figure S4 (A–F) Biocompatibility of C–SiO2-etched nanoparticles with lung respiration, adenosine triphosphate (ATP) content, and histology. (A–C) Lung specimens were incubated in vitro at 37°C in oxygenated Krebs–Henseleit (KH) buffer with and without 1.0 mg/dL C–SiO2-etched nanoparticles. Cellular respiration, ATP content, and histology were then measured, as described in . Representative O2 runs are shown in (A); rates of respiration (kc, μM O2/minute/mg) are shown at the bottom of each run (U, untreated; T, treated). The values of kc and ATP content are plotted as a function of t in (B). Representative histology (hematoxylin and eosin, 40×) at 4 hours (C) revealed foci of alveolar wall necrosis and apoptotic bodies. (D–F) Lung specimens were collected 60 minutes after intratracheal instillation of 10 mg C–SiO2-etched nanoparticles or 150 μL NaCl. The samples were then incubated in vitro at 37°C in oxygenated KH buffer. Cellular respiration (D and E) and ATP content (E) were measured as a function of time. Representative histology (hematoxylin and eosin, 40×) at 4 hours (F) revealed relatively preserved pulmonary architecture.
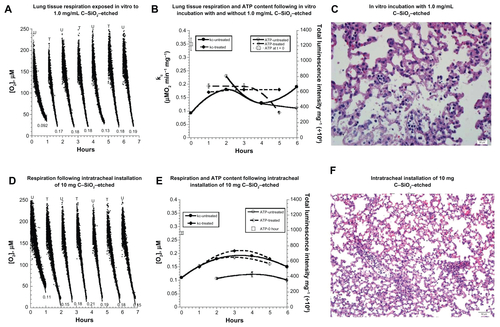
Figure S5 (A–F) Biocompatibility of C–SiO2 with lung respiration, adenosine triphosphate (ATP) content, caspase activity, and histology. (A–C) Lung specimens were incubated in vitro at 37°C in oxygenated Krebs–Henseleit (KH) buffer with and without 1.0 mg/dL C–SiO2. Cellular respiration (A and B) and ATP content (B) were then measured as a function of time, as described on . Representative O2 runs are shown in A; the values of kc (μM O2/minute/mg) are shown at the bottom of each run (U, untreated; T, treated). Representative histology (hematoxylin and eosin, 40×) at 4 hours (C) revealed preserved pulmonary architecture. (D–F) Lung specimens were collected 60 minutes after intratracheal instillation of 5 mg/kg C–SiO2 or 150 μL 0.9% NaCl. The samples were then incubated in vitro at 37°C in oxygenated KH buffer. Cellular respiration (D and E), ATP content (E), and caspase activity (F) were then measured as a function of time.
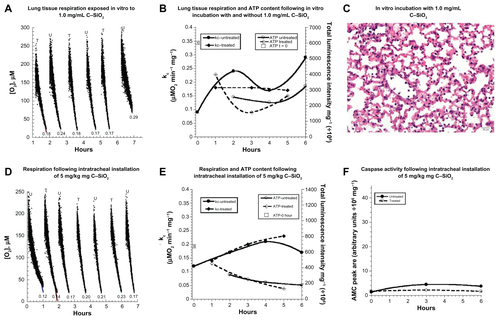
Figure S6 Ultraviolet-visible spectra of different known concentrations of aqueous of Co2+ ions.
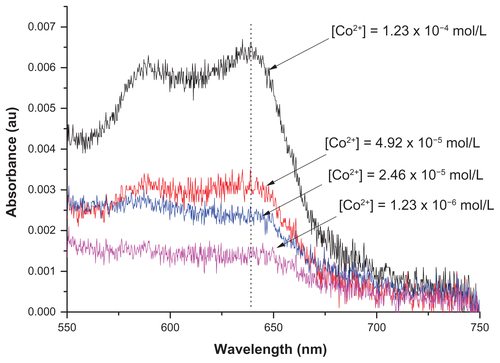
Figure S7 Calibration curve used for the colorimetric determination of Co2+ leached from the cobalt-based nanoparticles.
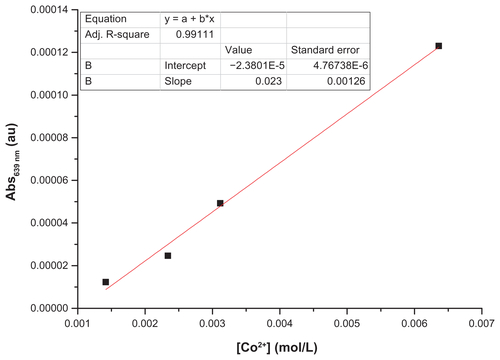
Figure S8 Ultraviolet-visible spectra of solutions collected after treatment with C–Co–SiO2 and C–Co3O4–SiO2 nanoparticles and the respective concentration of the Co2+ detected in the solutions.
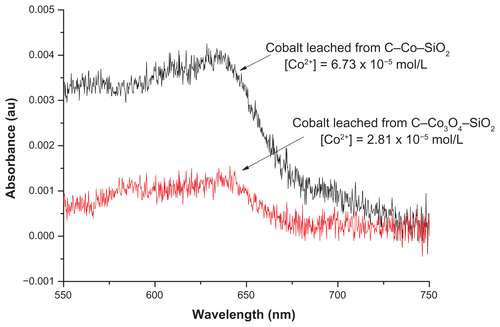
Table S1 Summary of the effects of studied nanoparticles on the measured biomarkers
References
- YoungRSHallAJInd Eng Chem Anal Ed194618264266
- PutscheHMMaloolyWFAnal Chem194719236238
- RoncheseADMermodMC R Hebd Seances Acad Sci195924924212422
Acknowledgments
This work is funded by United Arab Emirates University. TA gratefully acknowledges the partial financial support by the US National Science Foundation for the NSF-American Competitiveness and Innovation Fellowships (NSF-ACIF) and the NSF Creativity Award in 2011. RS acknowledges the CAPES (Coordenação de Aperfeiçoamento de Pessoal de Nível Superior) in Brazil and the Fulbright Agency in USA for awarding him with fellowships and financial support for his graduate study. The technical assistance of Dr Sheela Benedict, Ms Manjusha Sudhadevi, and Mr Sarabjit Singh is greatly appreciated. The authors are very grateful to Professor Suhail Al-Salam for providing the caspase-3 staining figure.
Disclosure
The authors report no conflicts of interest in this work.
References
- LiuZLiangXJNano-carbons as theranosticsTheranostics2012223523722448193
- De La ZerdaAZavaletaCKerenSCarbon nanotubes as photoacoustic molecular imaging agents in living miceNat Nanotechnol2008355756218772918
- SchipperMLNakayama-RatchfordNDavisCRA pilot toxicology study of single-walled carbon nanotubes on a small sample of miceNat Nanotechnol2008321622118654506
- HirschAThe era of carbon allotropesNat Mater2010986887120966925
- ZhouFFWuSNWuBYChenWRXingDMitochondria-targeting single-walled carbon nanotubes for cancer photothermal therapySmall201172727273521861293
- QhobosheaneMSantraSZhangPTanWBiochemically functionalized silica nanoparticlesAnalyst20011261274127811534592
- YiDKSelvanSTLeeSSPapaefthymiouGCKundaliyaDYingJYSilica-coated nanocomposites of magnetic nanoparticles and quantum dotsJ Am Chem Soc20051274990499115810812
- FreyNAPengSChengKSunSMagnetic nanoparticles: synthesis, functionalization, and applications in bioimaging and magnetic energy storageChem Soc Rev2009382532254219690734
- KarovicOTonazziniIRebolaNToxic effects of cobalt in primary cultures of mouse astrocytes: similarities with hypoxia and role of HIF-1αBiochem Pharmacol20077369470817169330
- MakhloufSAMagnetic properties of Co3O4 nanoparticlesJ Magn Magn Mater2002246184190
- BouchardLSAnwarMSLiuGLPicomolar sensitivity MRI and photoacoustic imaging of cobalt nanoparticlesProc Natl Acad Sci U S A20091064085408919251659
- ChoiJKimJCLeeYBKimISParkYKHurNHFabrication of silica-coated magnetic nanoparticles with highly photoluminescent lanthanide probesChem Commun (Camb)20071644164617530087
- KangKChoiJNamJHPreparation and characterization of chemically functionalized silica-coated magnetic nanoparticles as a DNA separatorJ Phys Chem B200911353654319099431
- AsefaTTaoZBiocompatibility of mesoporous silica nanoparticlesChem Res Toxicol2012252265228422823891
- Al SamriMTAl ShamsiMAl-SalamSMeasurement of oxygen consumption by murine tissues in vitroJ Pharmacol Toxicol Methods20106319620421034836
- Al-JasmiFPenefskyHSSouidAKThe phosphorescence oxygen analyzer as a screening tool for disorders with impaired lymphocyte bioenergeticsMol Genet Metab201110452953621996136
- ShabanSMarzouqiFAl MansouriAPenefskyHSSouidAKOxygen measurements via phosphorescenceComput Methods Programs Biomed201010026526820478639
- SouidAKTackaKAGalvanKAPenefskyHSImmediate effects of anticancer drugs on mitochondrial oxygen consumptionBiochem Pharmacol20036697798712963484
- Al ShamsiMAl SamriMTAl-SalamSBiocompatibility of calcined mesoporous silica particles with cellular bioenergetics in murine tissuesChem Res Toxicol2010231796180520961102
- GreenDRKroemerGThe pathophysiology of mitochondrial cell deathScience200430562662915286356
- HaoZDuncanGSChangCCSpecif ic ablation of the apoptotic functions of cytochrome c reveals a differential requirement of cytochrome c and Apaf-1 in apoptosisCell200512157959115907471
- TaoZGoodismanJPenefskyHSSouidAKCaspase activation by anticancer drugs: the caspase stormMol Pharm2007458359517439154
- SaffiottiUCefisFKolbLHA method for the experimental induction of bronchogenic carcinomaCancer Res1968281041245635364
- LoLWKochCJWilsonDFCalibration of oxygen-dependent quenching of the phosphorescence of Pd-meso-tetra(4-carboxyphenyl) porphine: a phosphor with general application for measuring oxygen concentration in biological systemsAnal Biochem19962361531608619481
- SilvaRAl-SharabJAsefaTEdge plane-rich nitrogen-doped carbon nanoneedles and efficient metal-free electrocatalystsAngew Chem Int Ed Engl2012517171717522684734
- SilvaRHaraguchiSKMunizECRubiraAFApplications of lignocellulosic fibers in polymer chemistry and in compositesQuim Nova200932661671
- DingleJTHeathJCWebbMDanielMThe biological action of cobalt and other metals II. The mechanism of the respiratory inhibition produced by cobalt in mammalian tissuesBiochim Biophys Acta196265344614027961
- WibergGSMunroICMorrisonABEffect of cobalt ions on myocardial metabolismCan J Biochem196747121912235340460
- WangCYouleRJThe role of mitochondria in apoptosisAnn. Rev. Genetics2009439511819659442
- WangYZiXYSuJCuprous oxide nanoparticles induce apoptosis of tumor cellsInt J Nanomedicine201272641265222679374
- DriscollKECostaDLHatchGIntratracheal instillation as an exposure technique for the evaluation of respiratory tract toxicity: uses and limitationsToxicol Sci200055243510788556
- WilfongERLylesMRietcheckRLThe acute and long-term effects of Middle East sand particles on the rat airway following a single intratracheal instillationJ Toxicol Environ Health A2011741351136521899408
- SagerTMKommineniCCastranovaVPulmonary response to intratracheal instillation of ultrafine versus fine titanium dioxide: role of particle surface areaPart Fibre Toxicol200851719046442
- WarheitDBWebbTRReedKLFrerichsSSayesCMPulmonary toxicity study in rats with three forms of ultrafine-TiO2 particles: differential responses related to surface propertiesToxicology20072309010417196727
- LamCWJamesJTMcCluskeyRHunterRLPulmonary toxicity of single-wall carbon nanotubes in mice 7 and 90 days after intratracheal instillationToxicol Sci20047712613414514958
- BottiniMBrucknerSNikaKMulti-walled carbon nanotubes induce T lymphocyte apoptosisToxicol Lett200616012112616125885