
Abstract
Background
A recent study has reported that maternal obesity is linked to placental oxidative damage and premature senescence. NADPH oxidase 4 (NOX4) is massively expressed in adipose tissue, and its induced reactive oxygen species have been found to contribute to cellular senescence. While, whether, in obese pregnancy, adipose tissue-derived NOX4 is the considerable cause of placental senescence remained elusive.
Methods
This study collected term placentas from obese and normal pregnancies and obese pregnant mouse model was constructed by a high fat diet to explore placental senescence. Furthermore, adipocyte-derived exosomes were isolated from primary adipocyte medium of obese and normal pregnancies to examine their effect on placenta functions in vivo and vitro.
Results
The placenta from the obese group showed a significant increase in placental oxidative damage and senescence. Exosomes from obese adipocytes contained copies of NOX4, and when cocultured with HTR8/SVneo cells, they induced severe oxidative damage, cellular senescence, and suppressed proliferation and invasion functions when compared with the control group. In vivo, adipocyte-derived NOX4-containing exosomes could induce placental oxidative damage and senescence, ultimately leading to adverse pregnancy outcomes.
Conclusion
In obesity, adipose tissue can secrete exosomes containing NOX4 which can be delivered to trophoblast resulting in severe DNA oxidative damage and premature placental senescence, ultimately leading to adverse pregnancy outcomes.
Introduction
In recent years, the prevalence of obesity among women of reproductive age has been increasing globally,Citation1 with an estimated global obesity prevalence in women exceeding 21% by 2025.Citation2 Research has shown that pregnant women who are obese have an increased risk of various pregnancy complications, such as gestational diabetes mellitus, preeclampsia, and intrahepatic cholestasis of pregnancy,Citation3 among others. Moreover, maternal obesity increases the risk of offspring developing metabolism diseases, cardiovascular diseases, and cognitive and social dysfunction.Citation4,Citation5
The placenta plays a critical role in the relationship between maternal health and fetal development. It is an essential temporal organ for exchanging nutrients and waste products between the mother and fetus during gestation.Citation6 Abnormal placentation is considered an underlying cause of various pregnancy complications. Maternal obesity influences placental nutrient transport, activates inflammatory signaling pathways, and alters morphology.Citation7 Recent research has suggested that cord blood and placental telomere length are lower in overweight and obese women,Citation8 indicating potential premature placental senescence in obesity. Placental senescence is associated with preeclampsia and fetal growth restriction.Citation9 Therefore, it is crucial to explore the potential mechanism of maternal obesity inducing placental senescence.
Evidence has shown that oxidative stress markers are increased in obese placentas.Citation10 Oxidative stress is an important factor in accelerating telomere shortening, and reactive oxygen species (ROS) impairs the G-rich telomere DNA. As a result, cells may senesce primarily in response to directly or indirectly oxidative damage-induced DNA double-strand breaks.Citation11 In obesity, in response to excess nutrients, adipocytes generated ROS via NADPH oxidase (NOX4), rather than using mitochondrial oxidation.Citation12 Evidence suggests that adipose tissue NOX4 knockdown could significantly reduce ROS production,Citation13 implying that adipocyte-derived NOX4 is the main source of ROS in obesity. Since NOX4 and its generated ROS play key roles in oxidative stress and cellular senescence,Citation14 we hypothesized that the increased oxidative damage of the obese placenta is associated with the NOX4 yield from adipose tissue. However, the connection between adipose tissue and the placenta is unclear.
In the past decades, cell-cell communication via exosome has been established. Exosome is a type of extracellular vesicle of 30–150 nm that plays a vital role in cell-to-cell communication.Citation15 As an endocrine organ,Citation16 Adipose tissue can secrete exosomes containing miRNAs,Citation17 and proteinsCitation18 transferring molecular signals to proximal cells and distal locations. Adipose tissue-derived exosomes can induce insulin resistance in skeletal muscleCitation19 and can regulate gene expression in other tissues.Citation20 Evidence suggested that exosomes derived from maternal adipose tissue could increase the risk of gestational diabetes mellitus,Citation21 suggesting communication between adipose tissue and the placenta in obesity via exosomes.Citation22
Based on these findings, we hypothesize that impaired placental function and adverse pregnancy outcomes result from trophoblast cellular premature senescence caused by adipocyte exosomal derived NOX4 induced oxidative stress in obesity. This present study aims to investigate whether adipocyte-derived exosomal NOX4 could impair the development of the placenta and explore the potential mechanism.
Material and Methods
Clinical Sample
This study was approved by the human research ethics committee of the first affiliated hospital of Chongqing medical university, China. Term placental samples and abdominal subcutaneous adipose tissue were collected from women undergoing cesarean delivery. According to the world health organization Asian body mass index (BMI) categories, 15 overweight or obese pregnancies (BMI ≥ 24kg/m2) and 20 control pregnancies (BMI: 18–23.9 kg/m2) between 37 to 40 weeks of gestation were included in this study. Villous samples were collected from four different sites. Each sample was divided into four portions, with one portion fixed in 4% paraformaldehyde and embedded in paraffin; one portion dehydrated and transferred to OCT compound; one portion kept in RNA later (Thermo Fisher Scientific, Waltham, USA) for RNA extraction; and the remaining one immediately frozen in liquid nitrogen and stored at −80°C until the subsequent experiment. The patients’ clinical characteristics were presented in Supplementary Table 1.
Primary Adipocyte Culture
Abdominal subcutaneous adipose tissue was obtained from patients under cesarean section and cut into pieces after vascular and connective tissues were removed with sterile scissors and kept in sterile PBS finally. The adipose tissues were digested by one type of collagenase for 30–60 minutes, then cultured with DMEM/F12 medium with 5% FBS after being filtered by 70 μm cell filters.
Exosome Isolation and Characterization
According to the Minimal Information for Studies of Extracellular Vesicles 2018,Citation23 primary adipocytes culture medium was collected after being cultured with serum-free culture medium for two days. Freshly harvested culture medium (10mL) was centrifuged at 2000 xg, 4°C for 10 minutes to remove cell debris, and the resulting supernatant was further centrifuged at 3000 ×g, 4°C for 20 minutes to extract dead cell debris and large vesicles. The supernatant was then transferred to an Amicon Ultra-15 (Millipore-Sigma; UFC901008) 100K centrifugal filter and centrifuged at 4500 ×g for 15 minutes to concentrate the material to 1 mL final volume. The final supernatant was centrifuged at 100000×g, 4°C for 4 hours, and the pellets were kept and resuspended in 30 μL PBS.
Exosomal markers CD63 and CD81 were analyzed by Western blot. The particle morphology was analyzed by transmission electron microscopy. For electron microscopy, exosomes were fixed with 2% paraformaldehyde and loaded onto Formvar and carbon-coated copper grids. Then the grids were placed on 2% gelatin at 37°C for 20 min, rinsed with 0.15 M glycine/PBS, and blocked using 1% cold water fish-skin gelatin. Grids were viewed using a transmission electron microscope and photographed using a Gatan digital camera (Gatan). Particle size and concentration were analyzed by nanoparticle tracking analysis.
For in vitro treatment, 2 μg of exosomes based on total protein measurement were added to 1×10⁵ recipient cells. For in vivo treatment, adipocyte-derived exosomes (30 μg every two days) were adoptively transferred into recipient mice via tail vein injection.Citation24 In the control groups, purified PBS (1X) was used.
To monitor exosome trafficking, exosomes were labeled with PKH67 Green Fluorescent Cell Linker Mini Kit (Sigma, USA), after staining, exosomes were collected by ultracentrifugation (100,000 xg, 2 hours, 4°C). The PKH67-labeled exosomes were then resuspended with PBS.
Oil Red O Stain
Adipocytes were washed three times with PBS; fixed with 4% PFA for 30 minutes at room temperature; Afterwards, the cells were washed three times with PBS, and fixed with 60% isopropanol. Next, cells were stained with filtered oil red for 10 to 20 minutes, followed by capturing pictures using a microscope.
Senescence-Associated β-Galactosidase (SA-β-Gal) Staining
Cells or frozen sections were washed three times with PBS, then fixed with 4% PFA for 25 minutes at room temperature, and rinsed three times with PBS for five minutes. After that, a mixed dying solution (Beyotime, China) was added and incubated at 37°C overnight. Cells and sections were observed by phase-contrast microscopy. Images were captured by an Evos FI Color Imaging System (Thermo Fisher Scientific, USA). Semi-quantitative analysis of SA-β-gal-positive staining was performed with ImageJ software.
Western Blot
Proteins of tissue and cells were extracted by RIPA lysis buffer with 1% PMSF. The extracts were then centrifuged (13,000 xg, 4°C, 10 minutes), and the supernatants were kept. Protein concentration was determined by a BCA protein assay kit (Beyotime, USA). Proteins were electrophoresed on SDS-page gel, then transferred to PVDF membranes, and blocked by 5% defatted milk. Primary antibodies against GLB1 (Abcam, #ab128993, rabbit, 1:1000), γ-H2AX (Abcam, #ab81299, rabbit, 1:2000), P53 (Proteintech, #60283-2-Ig, mouse, 1:1000), P21 (Abclonal, #A1483, rabbit, 1:1000), P16 (Proteintech, # 10883-1-AP, rabbit, 1:1000), NOX4 (Proteintech, #14347-1-AP, rabbit, 1:1000), NOX1 (Proteintech, #17772-1-AP, rabbit, 1:2000), NOX2 (Proteintech, #19013-1-AP, rabbit, 1:2000), NOX3 (Abclonal, #A3677, rabbit, 1:1000), NOX5 (Proteintech, #25350-1-AP, rabbit, 1:1000), CDK2 (Proteintech, #60312-1-Ig, rabbit, 1:1000), cyclin A2 (Proteintech, # 66391-1-Ig, rabbit, 1:1000), β-actin (Servicebio, #GB15001, mouse, 1:2000), GAPDH (Santa Cruz, #sc-32233, mouse, 1:2000), β-tublin (CST, #2146, rabbit, 1:2000), (diluted with 5%BSA) were added to the membranes and incubated overnight at 4°C, then incubated with the secondary antibodies for one hour at room temperature. Immunoreactive bands were developed using ECL.
Histology Staining
Paraformaldehyde-fixed mouse placental tissue were embedded in paraffin and sectioned to 3 μm in thickness, stained with hematoxylin and eosin (H&E). The quantification of the area of the junctional zone and labyrinth zone was using Image J software.
Immunohistochemistry
Human placental tissues were washed with fresh PBS, then fixed with PFA overnight at room temperature, dehydrated, embedded in paraffin, and sliced into 4-um-thick sections. Paraffin sections were then deparaffinated and hydrated, the antigen was retrieved in citrate sodium solution for 15 min by microwave. Sections were blocked with 3% H2O2 for 10 min at room temperature and incubated with primary antibodies against 8-OHdG (1:100, Bioss, #bs-1278R, rabbit, China), γ-H2AX (Abcam, #ab81299, rabbit, 1:200), CK7 (1:200, AiFang, #12D7, mouse, China) overnight at 4°C. The next day, sections were treated with enhanced enzyme-labeled goat anti-mouse/rabbit IgG polymer (Zhongshan Jinqiao, China) at room temperature for one hour, followed by visualized with diaminobenzidine (DAB) solution. Images were captured with a light microscope (Evos Fl Color Imaging System).
Immunofluorescence
Trophoblast cells (HTR8/SVneo) and frozen placental sections were fixed in 4%PFA for 10 minutes, then washed three times with PBS, and blocked in PBST (0.05% Triton X-100, Beyotime, China) with 5% goat serum. After blocking, samples were incubated with primary antibodies against 8-OHdG (1:100, Bioss, # bs-1278R, rabbit, China), CK7 (1:200, AiFang, #12D7, mouse, China) at 4 °C overnight. The following morning, the primary antibodies were washed with PBS (three times), the fluorescent FITC-conjugated or cyanine 3-conjugated goat antirabbit secondary antibody (Proteintech, #SA0009-2, China) were applied for one hour at room temperature. Finally, the cell nucleus was stained with DAPI, and images were captured using an Evos Fl Color Imaging System.
Reactive Oxygen Species (ROS) Quantification
Intracellular levels of ROS were assessed using DCFH-DA probes (Beyotime, #S0033S, China). Cells were cultured on a 96-well plate (3000 cells/well) and treated with compounds after adhesion for 48 hours. The cells were incubated with DCFH-DA probes (1:1000) in 1640 medium for one hour, then washed three times with serum-free culture medium. Fluorescence intensity was measured at 488/525nm using a fluorescent microplate reader (Thermos fisher scientific, USA).
RNA Extraction, cDNA Synthesis, and RT-qPCR
Total RNA was isolated from placental tissue using Trizol reagent (Thermos fisher scientific, USA). RNA concentration was detected by an ultraviolet spectrophotometer, and then the isolated RNA (1ug) was subjected to reverse transcription using Transcriptor reagent kit (Roche, #4655877001, USA). To quantify the relative transcript level, 2 ng of cDNA per reaction was used in conjunction with fast SYBR Green master mix (MCE, #HY-K0501, China). Normalization of all mRNA levels was performed with respect to β-actin. Primers for NOX1, NOX2, NOX3, NOX4, NOX5 and β-actin were presented in Supplementary Table 2.
Cell Culture
The immortalized human trophoblast cell line HTR8/SVneo was purchased from ATCC (American Type Culture Collection, USA) and cultured in Roswell Park Memorial Institute 1640 supplemented with L-Glutamine (Gibco, #11875093, USA) and 10% Fetal Bovine Serum (PAN, sT30-2602, German). The cells were maintained under standard culturing conditions at 37°C, 5% CO2, and a humidified atmosphere. 50μM H2O2 (Sigma, #323381, USA) was diluted with double-distilled water. 10μM N-Acetyl-L-cysteine (NAC) (Sigma, A0150000, USA), and 10μM GKT137831 (Selleck, #S7171, China) were dissolved in dimethyl sulfoxide (DMSO) (Sigma, USA).
Wound Healing Assay
HTR8/SVneo cells were seeded onto 6-well plates and treated with compounds (Normal adipocyte-derived exosomes (N-Exo), obese adipocyte-derived exosomes (O-Exo), NOX4-overexpressed adipocyte-derived exosomes (NOX4OE-Exo, NOX4-knockdown adipocyte-derived exosomes (NOX4KD-Exo) after achieving over 90% confluence. Subsequently, a 200ul pipette tip was used to create a scratch, then cells were rinsed with PBS and supplemented with fresh culture medium. Pictures were taken at 0h, 8h, 24h, and 48h. The area of wound healing was measured with Image J software. Each experiment was performed in triplicate.
Cell Proliferation (EdU Staining)
To determine HTR8/SVneo cell proliferation, newly synthesized DNA was evaluated using 5-Ethynyl-2’-deoxyuridine (EdU) incorporation. EdU was tested using the Cell-Light EdU Apollo567 In Vitro Kit (RiboBio, China). Specifically, HTR8/SVneo cells were seeded onto 96-well plates (5000 cells/well) and treated with the compounds (PBS, N-Exo, O-Exo, O-Exo+GKT137831) after adhesion. Following this, 20 µmol/L EdU was added to the culture medium after treatment for 24 h and incubated for additional 4 hours. Next, the supernatant was discarded, and the cells were washed twice with PBS and then fixed with 4% paraformaldehyde for 30 min. After rewashing with 3% BSA and permeation with 0.3% Triton X-100 PBS, the cells were incubated in Click Additive Solution for 30 min in the dark. After washing with PBS, cells were counterstained with DAPI. Images were taken with fluorescence microscopy, and cell counts were calculated using Image J software.
Lentivirus Transfection
Stable cell lines expressing the NOX4 or shNOX4 were obtained by transfecting LV-NOX4 (64740–1) or LV-NOX4-RNAi (96832–1), respectively, into adipocytes. Following this, the cells were screened for 10 days using 0.5 μg/mL puromycin 48 hours post-transfection, in accordance with the manufacturer’s instructions (GENE, China).
Animal Experiments
All animal experiments were approved by the ethics committee of the first affiliated hospital of Chongqing Medical University. All procedures were performed in accordance with the Guidelines of Chongqing Medical University.
All mice were kept in a temperature-controlled room (23°C) with a 12:12h dark-light cycle. Eight-week-old C57BL/6J mice of both genders were procured from Chongqing Byrness Weil Biotechnology Co., Ltd. (Chongqing, China). Half of the female mice were fed a high-fat diet (60% kCal), and the other half were fed a chow diet (10% kCal) for eight weeks. The day on which the vaginal plug was observed after mating was considered as embryonic day (E) 0.5. Mice were sacrificed on E13.5 and E18.5 for further experiments during which litter size, placenta weight, and fetal weight were recorded. Placenta tissues were harvested and immediately frozen at −80°C for protein analysis and fixed in 4% paraformaldehyde and embedded in paraffin. Fasting blood glucose levels in mice were assessed on E14.5 via tail vein.
In-vein injections of adipocyte-derived exosomes or PBS were performed between E4.5 to E13.5. The recipient mice were fed a chow diet and were administered these exosomes or PBS via tail vein. Mice were sacrificed on E18.5, the litter size, placenta weight and fetal weight were recorded. Placenta tissues were harvested and immediately frozen at −80°C for protein analysis and fixed in 4% paraformaldehyde and embedded in paraffin.
Quantification of Placental Sections
Quantification of placental sections were performed blindly using ImageJ (at least 2 random sections of per donors were scored). For SA-β-gal quantification for each tissue, sections were manually selected and quantified in Fiji. Darker spots were found using a Lorentzian of Gaussian filter and counted using “find maxima”. The microscopic image of each tissue section stained with H&E and IHC was converted into an 8-bit grayscale image, the threshold of which was adjusted to match the stained areas in the original image. In the thresholded images, the total placental section area was marked using the “free-hand selections” tool, and the area fraction, ie, the percentage of the specifically stained area to the total tissue section area, was obtained using the “measure” tool under the “Analyze” panel in Fiji.Citation25
Statistical Analysis
Data in this study are presented as the mean ± SEM. Statistical data were analyzed by Student’s t-test (2 groups). For comparisons among three groups, data analysis was performed by means of one-way ANOVA, followed by Tukey’s, Sidak’s or Dunnett’s multiple comparison tests. Extreme data from fetal weight and placental weight were excluded based on the mean ± SD. The statistical analyses were performed with GraphPad Prism software (version 8.0; La Jolla, California, USA). In all statistical comparisons, a p-value <0.05 was considered significant.
Results
The Placenta of Obese Pregnancy is Associated with Premature Senescence and DNA Oxidative Damage
A recent cohort study has confirmed the multidirectional effects of maternal obesity on fetal growth.Citation26 To investigate the impact of maternal obesity on placental function, female C57BL6J mice were fed either a CHD or HFD for eight weeks before mating. Subsequently, they were mated with CHD-fed males, and the mouse model of maternal obesity was successfully constructed (24.55± 1.27g in the HFD group vs 20.88± 1.35g in the CHD group) (Figure S1A–C).
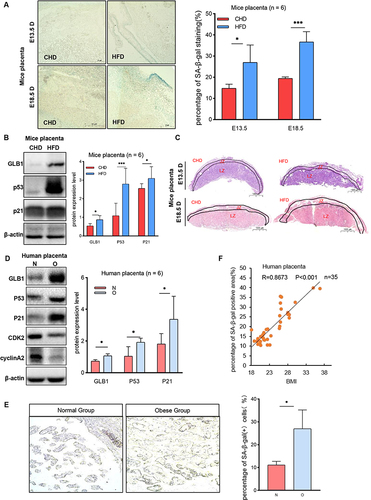
To investigate whether the placental premature senescence level in this mouse model is upregulated, mice placentas from the two groups were harvested on both E13.5 and E18.5. The placenta harvested from the HFD group at E13.5 and E18.5 exhibited an elevated number of SA-β-gal positive cells (). Since GLB1, P53, and P21 are markers associated with senescence, the level of these proteins was also investigated. The protein expression level of GLB1 also increased along with the upregulation of P53 and P21 (), indicating that maternal obesity can induce placental premature senescence. Morphological findings revealed a decrease in the area of the labyrinth zone of the HFD placenta, while there was no difference noted in the junction zone among the two groups (). In addition, term placentas of obese and normal pregnancies were collected from patients undergoing cesarean delivery. Western blot analysis showed that GLB1, P53, and P21 expression levels were significantly upregulated in the obese placenta as compared with the normal group (). The percentage of SA-β-gal positive cells was also upregulated in the placentas of the obese group and is correlated with body mass index ( and ). These results indicated that the placenta of obese pregnancy is associated with premature placental senescence.
Figure 1 The obese placenta is associated with premature senescence. (A) SA-β-Gal staining of E13.5 and E18.5 mouse placental sections from the HFD group and CHD group. Scale bar: 50 μm. (B) Western blot analysis of protein expression of GLB1, P53, and P21 in E18.5 mouse placentas from different groups (n = 6 biologically independent animals from each group). (C) H&E staining of E13.5 and E18.5 mouse placentas sections collected from the HFD group and CHD group. JZ, junctional zone; LZ, labyrinth zone. Scale bar: 1000um. (D) Western blot analysis of protein expression of GLB1, P53, P21, CDK2 and cyclinA2 in human-term placentas (n=6 in the obese group and normal group). (E) SA-β-gal staining of human term placenta. Scale bar: 400 μm. (F). Correlations between the percentage of SA-β-Gal positive cells of human term placenta for each individual and their BMI, with each dot representing one person. P< 0.05 indicates a significant correlation using a two-sided Spearman correlation analysis. (A–E) All data are presented as the mean ± SEM. *p < 0.05, ***p < 0.001. Student’s t-test; F. Two-sided Spearman correlation analysis. All experiments were performed in triplicate.
Placenta weight is indicative of the available surface area for maternal–fetal nutrient exchange.Citation27 The fetal-to-placenta weight ratio (birth weight: placenta weight; in grams) is a marker of placental nutrient transporter efficiency.Citation28 A lower fetal-to-placenta weight ratio may indicate suboptimal placenta nutrient transport efficiency and has been associated with increased pregnancy complications. The litter size (Figure S1D) was found to be reduced (6.25 ± 2.05 in the HFD group vs 7.5 ± 1.20 in the CHD group, P<0.05) and the average placental weight (0.054 ± 0.018 g vs.0.046 ± 0.011 g in control group, P<0.05) (Figure S1E) increased in the HFD placenta compared with the CHD group, furthermore, the average fetal weight differed among the groups (1.05 ± 0.19 g vs.1.08 ± 0.09 g in control group, P=0.5362) (Figure S1F). Thus, the placental efficiency was decreased in the HFD group as compared with the CHD group (Figure S1G). The decreased litter size combined with fetal weight and placenta morphologic changes indicates that obese mouse models suffer from placenta functional impairment.
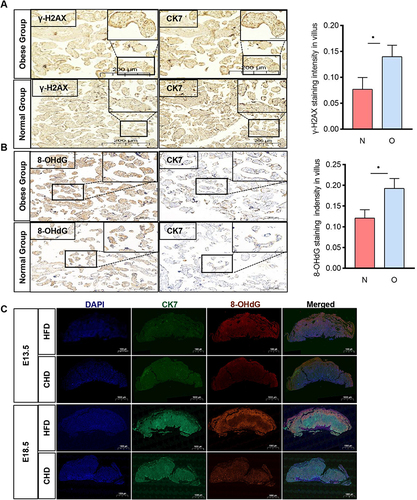
Pieces of evidence have revealed that oxidative stress markers were increased in the placenta of obese pregancies.Citation29 Our results have validated this, showing an increase in markers of DNA oxidative damage (γ-H2AX and 8-OHdG) ( and ), suggesting DNA oxidative damage in the placentas of obese pregnancies. Immunofluorescence showed an upregulation of 8-OHdG in obese mouse placentas on E13.5 and E18.5 (), these results suggested increased DNA oxidative damage in obese placentas compared with those in the normal group.
Figure 2 The obese placenta is associated with DNA oxidative damage. (A and B) Immunochemistry analysis of γ-H2AX and 8-OHdG level in paired human term placentas. (n=3 per group, 3 fields per patient); CK7, cytokeratin 7; Scale bar: 200um. (C) Immunofluorescent (IF) detection of 8-OHdG expression in E13.5 and E18.5 mouse placentas collected from the HFD and CHD group. IF staining with an antibody against 8-OHdG is shown in Green, CK7 staining in red, and DAPI staining in blue. n=3 each group, Scale bar:1000um. All data are presented as the mean ± SEM. *p < 0.05. Student’s t-test. All experiments were performed in triplicate.
Expression of NOX4 is Upregulated in the Obese Placenta
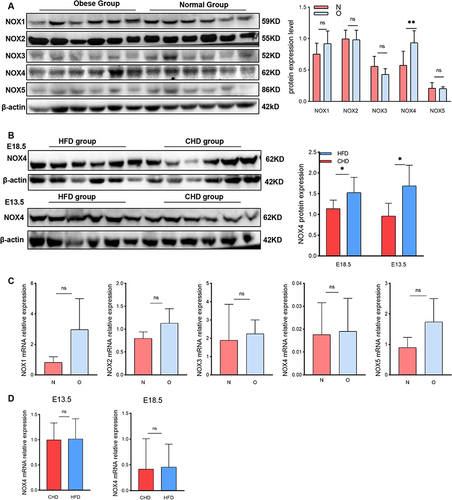
Studies have reported that NOX4 and its derivative ROS play a crucial role in cellular DNA oxidative damage and senescence. In obesity, the primary source of ROS is NADPH oxidases.Citation30 Therefore, we assessed the protein level of the NADPH family. Western blot analysis showed that NOX4 was the only NADPH oxidase upregulated in the human-term placenta of the obese group as compared with the normal group (). Furthermore, the expression of NOX4 is also upregulated in the mice placenta which were harvested on E13.5 and E18.5 of the HFD group (). However, no variation in gene expression of NOX1-5 was noted between the two groups (). Consistently, there are no significant difference of NOX4 gene expression either in E13.5 nor in E18.5 mouse placenta (), These results collectively indicate that the elevated protein expression of NOX4 in obese placental tissues may have alternative pathways of generation.
Figure 3 NOX4 expression in placenta of obese pregnancy is elevated. (A) Western blot analysis of protein expression of NOX1-5 in human-term placentas (n=6 in each group). (B) Western blot analysis of protein expression of NOX4 in E18.5 and E13.5 mouse placenta harvested from HFD group and CHD group (n=6 in each group). (C) RT-PCR to analysis mRNA relative expression of NOX1-5 in human placenta tissue (n=8 in the obese group and normal group). (D) RT-PCR to analysis mRNA relative expression of NOX4 in E13.5 and E18.5 mouse placenta (n=8 in the HFD group and CHD group). All data are presented as the mean ± SEM. *p < 0.05, **p < 0.01. Student’s t-test. All experiments were performed in triplicate.
Obese Adipocytes Secreted Exosomal NOX4
Previous research reported that in response to excess nutrients like glucose and palmitate, adipocytes generated ROS via NOX4, instead of using mitochondrial oxidation.Citation12 Therefore, we investigated whether adipocytes can secrete NOX4 via exosomes, which could then be transported into target cells. Primary adipocytes were extracted from abdominal subcutaneous adipose tissue of obese and lean pregnant women who bearing cesarean section (). As shown in , the Western blot analysis demonstrated that NOX4 protein is upregulated in obese adipocytes. Additionally, palmitate could enhance the expression of NOX4 (), indicating a positive correlation between NOX4 and adipose accumulation. Electron microscopy and nanoparticle tracking analysis revealed that particles isolated from an equal volume of adipocyte culture medium contained amounts of exosomes with diameters ranging from 30–150nm and Western blot confirmed the expression of exosome-specific-markers CD63 and CD81 (). As described in , exosomes from obese adipocytes contained a high level of NOX4 protein compared with the lean group, with the highest levels observed in exosomes derived from adipocytes, followed by the culture medium, and the lowest levels in the supernatant after extracted exosomes, suggesting that obese adipocyte can secrete NOX4 via exosomes.
Figure 4 Adipocytes secrete exosomal NOX4. (A) Oil red O staining of primary adipocyte, scale bar: 400μm and 100μm. Western blot (WB) analysis of protein expression of NOX4 in adipocyte. N-AC, normal adipose; O-AC, obese adipocyte; palmitate: toxic fatty acid. (B) Transmission electron microscopy image of adipocyte exosomes (scale bar, 100 nm). Exosome (Exo)-specific markers CD63 and CD81 were measured by WB. Particle size and concentration were analyzed by nanoparticle tracking analysis. (C) Expression of NOX4 in adipocyte-derived exosomes, culture medium and exosome-free supernatant was analyzed by WB. (D) Adipocyte derived exosomes were labeled with PKH67, then added to HTR8/SVneo culture medium. Scale bar: 10μm. (E) Expression of NOX4 in HTR8/SVneo was measured by WB after cocultured with adipocyte-derived exosome. N-Exo, normal adipocyte exosome; O-Exo, obese adipocyte exosome. (F) The effect of EV-secreted inhibitor GW4869 on exosome-dependent NOX4 delivery from adipocyte into HTR8/SVneo. All data are presented as the mean ± SEM. **p < 0.01. Student’s t-test. All experiments were performed in triplicate. (n=3 each group).
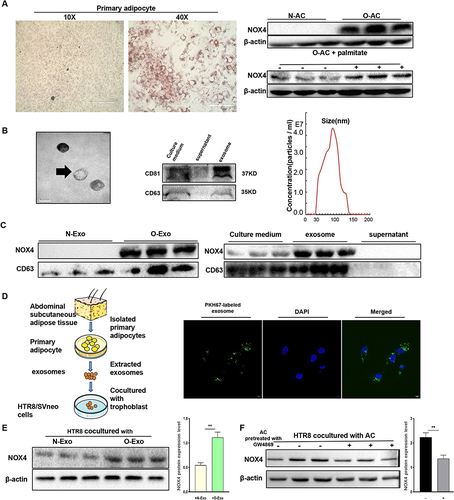
Subsequently, we assessed whether adipocyte-derived exosomes could be taken up by trophoblasts. Adipocyte-derived exosomes were stained with fluorescent dye PKH67, then co-cultured with trophoblast for 4 hours, green fluorescent was exhibited in the cytoplasm and diffused as small spots around the cell nucleus by confocal microscopy (). Results of the Western blot showed that NOX4 protein expression was upregulated in HTR8/SVneo cells after coculturing with obese adipocyte-derived exosomes (). Importantly, the prior addition of the exosome secretion inhibitor GW4869 on the adipocytes reduced the NOX4 expression of HTR8/SVneo (), implying that adipocytes predominantly secrete NOX4 in an exosome-dependent manner. These results showed that adipocytes can secrete NOX4-containing exosomes, which are then transported into target cells.
Obese Adipocyte-Secreted Exosomes Induce Senescence in HTR8/SVneo Cells
To investigate the potential involvement of obese adipocyte-derived exosomes in placental senescence in obesity, O-Exo and N-Exo were respectively cocultured with HTR8/SVneo cells. Western blot analysis showed that O-Exo resulted in a significant increase in protein expression associated with senescence (). Furthermore, as illustrated in and , the percentage of SA-β-gal positive cells increased after cocultured with O-AC and O-Exo, suggesting that obese adipocyte-derived exosomes may play a key role in cellular senescence in HTR8/SVneo cells. As cellular senescence is a process in which cells quit dividing, we next explored the protein expression of cell cycle-associated markers. Flow cytometry demonstrated that the proportion of cells in G1 increased in HTR8/SVneo cells treated with O-Exo (), implying that cell proliferation may be impaired. We then examined the protein markers of the G1/S phase and found that CDK2 was down-regulated in HTR8/SVneo cells after co-culturing with O-Exo, consistent with the increased P53 and P21 ().
Figure 5 Obese adipocyte-derived exosomes induce senescence in HTR8/SVneo cells. (A) Western blot analysis of protein expression of senescence associated markers in HTR8/SVneo cells after treated with exosomes. (B and C) SA-β-gal staining of HTR8/SVneo cells after cocultured with adipocytes (A) and adipocyte-derived exosomes (B). N-AC, normal adipocyte; O-AC, obese adipocyte; N-Exo, normal adipocyte-derived exosomes; O-Exo, obese adipocyte-derived exosomes. Scale bar: 100 μm. (D and E) HTR8/SVneo cells were treated with exosomes for 24hours, then cells were harvested to analyze the cell cycle distribution by flow cytometry (D) Protein levels of CDK2 and CyclinA2 were measured by WB (E). (F) EdU staining to analyze proliferation of HTR8/SVneo cells after treated with PBS, N-Exo, O-Exo, O-Exo+GKT. GKT, GKT137831, NOX4 inhibitor. Scale bar: 100μm. (G) Wound healing assay. Scale bar: 1000μm. All data are presented as the mean ± SEM. *p < 0.05, **p < 0.01, ***p < 0.001. Student’s t-test. (n=3 each group). All experiments were performed in triplicate.
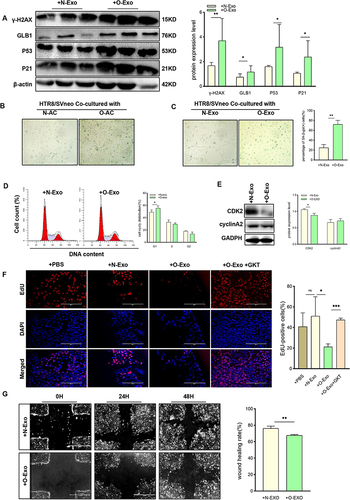
Furthermore, to trace cell proliferation, EdU was added to the culture medium, and dye incorporation was measured using fluorescent microscopy. Culturing with O-Exo resulted in a significant reduction in the level of DNA synthesis compared with the N-Exo-treated group (). To further assess the effects of adipocyte-derived exosomes on trophoblast functions, HTR8/SVneo cells were subjected to migration assay. The results of the wound healing assay showed the migration ability was impaired in cells treated with O-Exos (). Together, these findings collectively demonstrated that obese adipocyte-derived exosomes can induce trophoblast senescence and dysfunction.
Adipocyte-Derived Exosomal NOX4 Induces Senescence in Trophoblast
To demonstrate that NOX4 is the key component of adipocyte-derived exosomes, 10μM GKT137831 (GKT, a NOX4 inhibitor) was added to HTR8/SVneo cells that were cocultured with these exosomes. Western blot analysis was conducted to investigate senescence-associated markers. The results presented in showed a significant reduction in senescence-related marker expression upon the addition of GKT. Consistent with this finding, GKT decreased cell cycle distribution in the G1 period (). Protein expression of CKD2, and cyclinA2 were increased in the group of addition of GKT ().
Figure 6 NOX4 was the key component of O-AC derived exosomes to induce senescence in trophoblast. (A–C) HTR8/SVneo were cocultured with O-Exo, O-Exo+GKT (GKT, GKT137831, inhibitor of NOX4), then senescence associated markers were analyzed by Western blot (A); cell cycle distribution was analyzed by Flow cytometry (B); expression of CDK2, cylinA2 was analyzed by Western blot (C). (n=3 each group). (D) Western blot revealed the expression level of NOX4 in adipocytes with NOX4. Overexpression and adipocytes with NOX4 knockdown. (E) Western blot revealed the expression level of NOX4 in exosomes derived from adipocyte with NOX4 overexpression and with NOX4 knockdown; (F) Western blot analyses the protein level of GLB1 and P53 in NOX4 overexpression-, NOX4 knockdown- or mature adipocyte-derived exosome-treated HTR8/SVneo cells. (G). Wound healing assay of HTR8/SVneo cells after treated with NC-Exo, and NOX4OE-Exo. (n=3 each group). (H). Wound healing assay of HTR8/SVneo cells after treated with NC-Exo, and NOX4KD-Exo. (n=3 each group). All data are presented as the mean ± SEM. *P<0.05, **P< 0.01, ***P < 0.001. Student’s t-test. All experiments were performed in triplicate.
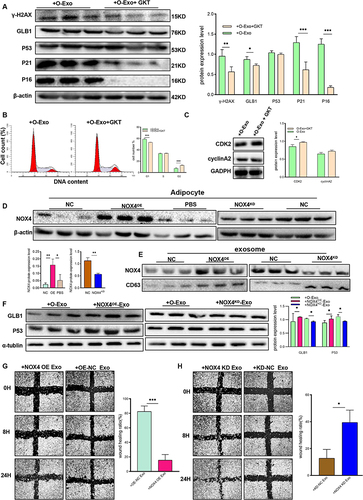
Furthermore, we generated NOX4OE and NOX4KD-adipocytes using lentivirus, as depicted in , cell models were successfully constructed. In addition, we successfully extracted exosomes from both NOX4OE and NOX4KD adipocytes, and their NOX4 expression was respectively elevated or reduced (). NOX4OE and NOX4KD adipocyte-derived exosomes were added into HTR8/SVneo cell culture medium. As demonstrated in , NOX4OE-Exo led to aggravated senescence in trophoblast, whereas cellular senescence markers were significantly downregulated in HTR8/SVneo cells after exposure to NOX4KD-exosomes. In addition, the wound healing assay showed that the migration ability was significantly suppressed in HTR8 cells pretreated with NOX4OE-Exo when compared with cells treated with O-Exo (). Conversely, the migration ability was noticeably promoted in cells treated with NOX4KD -Exo (). Collectively, these data confirmed that NOX4 was the key component of obese adipocyte-derived exosomes that induces senescence and dysfunction in trophoblast.
Obese Adipocyte Exosomal NOX4 Induces Senescence by Oxidative Damage in HTR8/SVneo Cells
NOX4 plays a crucial role in producing reactive oxygen species (ROS). We found that treatment with O-Exo led to a significant increase in ROS production in HTR8/SVneo cells, as demonstrated in . As illustrated in and , the expression of senescence-associated markers and the proportion of SA-β-gal positive cells were upregulated in O-Exo treated HTR8/SVneo cells. This effect was further intensified by H2O2 (a NOX4 product) but was reversed by NAC (an oxidative stress inhibitor). These findings indicated that obese adipocyte-derived exosomes cause oxidative damage in HTR8/SVneo cells.
Figure 7 Exosomal NOX4 derived from obese adipocytes induces oxidative stress in trophoblast cells. (A) Reactive oxygen species (ROS) assay by DCFH-DA in HTR8/SVneo cells after respectively treated with N-Exo and O-Exo. (N-Exo, normal adipocyte derived exosome; O-Exo, obese adipocyte derived exosome). (B) Western blot analysis of protein expression of γ-H2AX, GLB1, P53, and P16 in HTR8/SVneo cells after respectively treated with N-Exo, O-Exo, O-Exo+H2O2, O-Exo+NAC. (H2O2, Hydrogen peroxide; NAC, N-acetylcysteine). (C) SA-β-Gal staining of HTR8/SVneo cells after respectively treated with PBS, N-Exo, O-Exo, O-Exo+H2O2, O-Exo+NAC. Scale bar:100μm. (D) ROS production in PBS, GKT, O-Exo, O-Exo+GKT treated HTR8/SVneo cells. (GKT, GKT137831, NOX4 inhibitor). (E) ROS production in control, NOX4 overexpression- or NOX4 knockdown- adipocyte derived exosome-treated HTR8/SVneo cells. (F) IF detection of 8-OHdG expression in HTR8/SVneo cells after respectively treated with PBS, GKT, O-Exo, O-Exo +GKT. IF staining with an antibody against 8-OHdG is shown in Green, CK7 staining in red, and DAPI staining in blue. Scale bar:100μm. N=3 in each group. All data are presented as the mean ± SEM. *P<0.05, **P< 0.01, ***P < 0.001. Student’s t-test. All experiments were performed in triplicate.
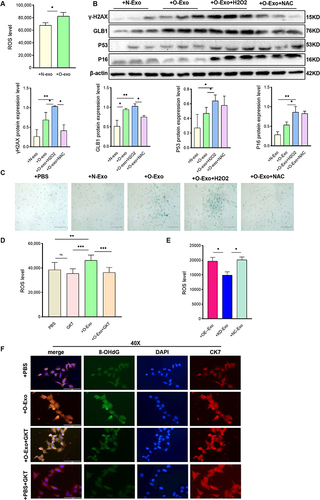
In addition, the ROS production was significantly decreased in both the GKT pretreatment group () and the NOX4-knockdown adipocyte derived exosomes cocultured group (). After 24 hours of O-Exo treatment, 8-OHdG green fluorescence increased, indicating DNA oxidative damage in HTR8/SVneo (). However, this elevation was partially reversed in the GKT pretreatment group (). In conclusion, these results suggest that obese adipocyte-derived exosomes induce cellular DNA damage and senescence via ROS-related signaling pathways.
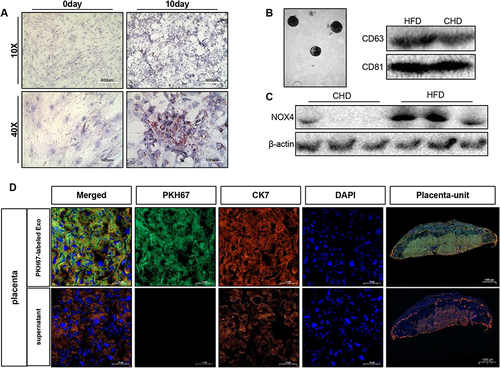
Adipocyte-Derived NOX4-Containing Exosomes Can Induce Premature Senescence and Maldevelopment in Normal Mice Placenta
As obese adipose tissue-derived exosomes have been shown to display a pro-senescence role in vitro, we conducted experiments to investigate whether adipose tissue can modulate placenta functions by secreting NOX4 via exosomes. CHD-fed lean mice were injected with PKH67-labeled obese adipocyte-derived exosomes of obese mice between E3.5 to E13.5 (30μg every two days) (i.v.Exo), while mice in the control group were injected with PBS (i.v.PBS), and they were subsequently sacrificed on E18.5. No doubt, the exosomes we harvested from mice adipocytes culture medium contained amount of NOX4 (). The presence of green fluorescent PKH67 dye in the placenta of recipient mice indicated in vivo uptake of adipocyte-derived exosome ().
Figure 8 Adipocyte-derived exosome can be delivered to placenta in vivo. (A) Primary mouse adipocytes and induced differentiation for 10 days were stained with oil red O, scale bar: 400µm and 100µm. (B) Identification of mouse adipocyte-derived exosomes. Electron microscope, scale bar: 200nm. Western blot was used to detect CD63 and CD81. (C). Detection of NOX4 protein expression in exosomes, n=3 in each group. (D). Confocal microscopy showing green (PKH67), red (CK7), blue (DAPI) fluorescence and merged images of mouse placenta, after injected PKH67–labeled exosome or its supernatant for 24h, scale bar: 1000µm. Data are presented as mean ± SEM. Student’s t-test. All experiments were performed in triplicate.
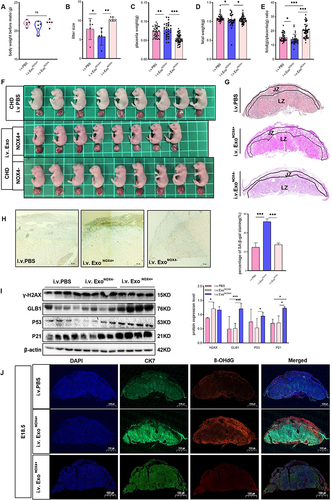
Recipient mouse were respectively injected with PBS, obese adipocyte-derived exosomes derived exosome (ExoNOX4+) and the NOX4-knockdown adipocyte derived exosomes (ExoNOX4-), the weight of mouse before mating among the three group was comparable (). As shown in , compared with the PBS-treated group and the NOX4-knockdown adipocyte derived exosome-treated group, the litter size () (9 ± 0.81, 6.75 ± 095, and 10.4 ± 0.54 in PBS, ExoNOX4+ and ExoNOX4- treated group, respectively), fetal weight () (1.10±0.09g, 1.02±0.18g, and 1.07±0. 08g in PBS, ExoNOX4+ and ExoNOX4- treated group, respectively), placenta efficiency () and fetal size () of the group in which administration of obese adipocyte-derived exosomes were significantly decreased. Morphologic assessment of the placental units revealed that the area of LZ was reduced in NOX4-containing exosome-treated placentas (). These results indicated that obese adipocyte-derived exosomes induce placental morphologic change and impaired fetal growth. Furthermore, the placenta treated with NOX4-containing exosomes showed strong positive SA-β-gal staining compared with those of the control groups at E18.5 (). Consistently, GLB1, P53 and P21 protein levels were upregulated in the ExoNOX4+ treated group (), suggesting senescence in the placenta treated with obese adipocyte-derived NOX4-containing exosomes. Higher levels of the 8-OHdG were observed in the placenta of the experimental group, confirming that NOX4-containing exosome derived from obese adipocyte can induce DNA damage response in vivo ().
Figure 9 Adipocyte-derived NOX4-containing exosomes can induce premature senescence and maldevelopment in normal mice placenta. (A–J) Mouse were respectively injected with PBS, NOX4-Knockdown (NOX4-) Exo and NOX4-containing (NOX4+) Exo. (A) Weight of mouse before mating. (B) Litter size. (C) Weight of placenta. (D) Weight of fetus. (E) Placenta efficiency (fetal weight/placenta weight). (F) Size of fetus. (G) HE staining of mouse placenta. Scale bar: 1000µm. (H) SA-β-Gal staining in mouse placental tissue (E18.5) (n=5 per group), scale bar: 50µm. (I) Western blot was used to detect the expression of senescence-related markers in mouse placenta (n=4 each group). (J) Immunofluorescence detection of 8-OHdG expression in mouse placental tissue, blue (DAPI), green (CK7), red (8-OHdG), scale: 1000µm. Data of (A–F) are presented as mean ± SD and data of G-J were presented as mean ± SEM. *P<0.05, **P< 0.01, ***P < 0.001. Student’s t-test. All experiments were performed in triplicate.
Discussion
In the past decades, several studies have demonstrated maternal obesity is associated with various pregnancy complications. A recent study reported a progressive increase in the risk of early-onset and late-onset hypertensive disorders of pregnancy among women with an increased class of obesity.Citation31 No doubt, obese women are prone to develop insulin resistance and proinflammation cytokines,Citation32 leading to changes in maternal nutrient levels that can modulate placental function. Evidence shows that maternal obesity impairs placental functions.Citation33 The placenta is a temporal organ for nutrition exchange from the mother to the embryoCitation34 Maternal obesity is associated with changes in circulating fatty acid profile and placental alterations including a lipotoxic environment, an increase of proinflammatory cytokine, and oxidative stress.Citation35 Under physiological conditions, senescence is a normal process of placenta development, trophoblastic senescence may be essential for maintaining placental function.Citation36 However, Premature placental senescence and ageing are implicated in several adverse pregnancy outcomes.Citation37 Few studies have investigated the change of placenta in obese pregnancies.
Senescence in the placenta shares features of senescence induced by DNA damage and exhibits a coordinated activation of p53/p21 and p16/pRb regulatory pathways.Citation38 Both in humans and rodents, our study found that increased NOX4 is associated with severe placental senescence in the obese group, accompanied by DNA damage and P53/P21 pathway activation. Animal experimental results showed that maternal obesity leads to placental morphologic malformation, senescence and poor placental efficiency. Importantly, we found these differences existed even on E13.5 of the mouse placenta, indicating senescence at the beginning of placentation.
Previous research has reported that only NOX4 among the NOX family members is expressed in adipocytes and is essential for the differentiation of preadipocytes. Adipocyte NOX4-derived H2O2 is essential for adipocyte function under physiological conditions, but redistribution and exacerbated NOX4 activity in metabolic diseases may initiate adipose inflammation and insulin resistance.Citation39 Consistent with our findings, palmitate, a toxic lipid that increases in obesity, has been reported to increase the activity of NOX4. Nutrient excess leads to increased generation of intracellular H2O2 from NOX4 but not from mitochondria.Citation40 Peng et al reported that elevated NOX4 expression in Piezo1-deficient muscle stem cells increases ROS levels and DNA damage, causing P53-dependent cellular senescence and cell death.Citation41 In this study, we discovered that NOX4 was the only increased NOXs both in obese adipose tissue and placenta. Therefore, the increased expression of NOX4 in adipose tissue might be attributed to the abnormal senescence induced by DNA damage in the obese placenta.
Exosomes are nano-sized particles secreted from cells and play a crucial role in intercellular communication by delivering cargo to recipient cells. Although Durcin et al reported that different biological stimuli related to obesity-associated chronic low-grade inflammation enhance the secretion of exosomes from mature adipocytes.Citation42 The impact of obesity on the release of adipocyte‑derived exosomal content to the recipient cells is currently not elucidated. Obese patients have significantly more circulating EVs than normal control subjects.Citation43 However, the abundance of circulating EVs may be affected by preanalytical factors, making it difficult to attribute the effect of exosomes on recipient cells to a specific exosomal content because the recipient cells take up the cargo without undergoing selective content processing.Citation44 Studies have shown that exosomes derived from adipocytes can inhibit M2 polarization to promote obesity-induced adipose inflammation.Citation45 Clinical studies have also demonstrated that subcutaneous adipocyte-derived exosomes of obese patients are enriched in proteins implicated in fatty acid oxidation.Citation46
In this study, exosomes were harvested from the primary adipocyte culture medium through differential centrifugation. We identified the exosomes with a 30–100nm diameter by electron microscopy and detected the exosomal membrane markers CD63 and CD81. Western blot confirmed that obese adipocyte-secreted exosomes contain a great amount of NOX4 protein. Adipocyte-secreted exosomes were labeled with PKH67 fluorescent dye and cocultured with HTR8/SVneo cells. The green PKH67 fluorescent exhibited in HTR8 cells accompanied increased expression of NOX4 protein, and this effect can be suppressed by prior treatment of the adipocyte with GW4869. Consistent with these findings, our in vivo studies showed that green fluorescent was observed in the placenta of recipient mice after treatment with PKH67-labeled exosomes via vein injection. In summary, these results demonstrated that adipocytes produce NOX4-containing exosomes and the NOX4 cargo can be transferred into trophoblast in vitro and in vivo.
Recent research has reported that adipose tissue-derived exosomes carry a specific set of proteins that play a crucial role in mediating the changes in placental function in GDM and might be responsible for some of the adverse consequences of this pregnancy complication.Citation21 Previous reports have identified that NOX4 can promote ROS production and induce oxidative stress damage in renal,Citation47 hepatic fibrosis,Citation48 vascular,Citation49 and adipose tissue.Citation50 As demonstrated in our study, treatment with obese adipocyte-derived exosomes led to exacerbation of senescence in trophoblast cells. Usually, cell senescence is an irreversible cell cycle arrest associated with changes in cell morphology.Citation51 Similarly, shreds of evidence shown in our research revealed the upregulated expression of cell cycle inhibitors p21 and p16, which suppressed CDK2, indicating cell cycle arrest at period G1.
In addition, the production of ROS was elevated in HTR8/SVneo cells after being treated with obese adipocyte-derived exosomes. Under physiologic conditions, moderate ROS levels are implicated in proliferation and cell maturation required for pregnancy maintenance and embryo development.Citation52 Excess ROS can induce DNA damage and affect the DNA damage response.Citation53 We found that exosomes derived from obese adipose tissue are associated with the increment of ROS production and elevated 8-OHdG and γ-H2AX levels confirm DNA oxidative damage in trophoblast cells. This effect was encouraged by H2O2 and suppressed by NAC. Taken together, these findings suggested that obese adipocyte-derived exosomes play a key role in trophoblast senescence through their effects on oxidative damage and cell cycle arrest.
Numerous studies have reported that NOX4 promotes cell proliferation and invasion in embryonic stem cells,Citation54 HeLa cells,Citation55 neural stem cellsCitation56 and so on. However, in this research, the wound healing rate and percentage of Edu-positive cells pre-treated with containing NOX4 exosomes were found to be decreased, indicating that NOX4 inhibits trophoblast invasion and proliferation. Consistent with our findings, NOX4 knockdown or silence caused increased cell proliferation in hepatocytes and hepatocarcinoma cells suggesting that NOX4 plays a negative role in liver cell proliferation.Citation57 Furthermore, high-level expression of NOX4 impaired AngII-induced adventitial fibroblasts migration.Citation58 In summary, while numerous studies have identified NOX4 as promoting cell proliferation and invasion, our results suggest that NOX4 has an inhibitory effect on trophoblast invasion and proliferation. Therefore, the detailed mechanism of NOX4 in cell proliferation and invasion requires further exploration.
Besides, our present study shows that the stimulatory effect of exosomes derived from NOX4-knockdown adipocyte or NOX4-overexpression adipocyte on trophoblast oxidative damage and cellular dysfunction was respectively attenuated and exacerbated compared with that of the exosomes derived from obese adipocyte, confirmed that NOX4 is a crucial cargo of adipocyte-derived exosomes leading to premature senescence in trophoblast. Furthermore, in vivo studies showed that intravenous injection of the NOX4-containing exosomes isolated from adipocytes led to adverse pregnancy outcomes. Consistent with cell experiment findings, the placenta of those treated with adipocyte-derived exosomes mice showed placental malformation and dysfunction, upregulated levels of 8-OHdG and γ-H2AX, increased SA-β-gal positive cells, P53/P21 axis activation, confirming that adipocyte exosome-derived NOX4 leads to placenta DNA oxidative damage and premature senescence.
However, there are still several limitations in this study. Firstly, the protein constitution of adipocyte-derived exosomes and exosome secretion are complex and require further exploration. Besides, human subcutaneous and visceral adipose tissues exhibit differential gene expression profiles,Citation59 the exosomal contents derived from these adipose depots may differ, and the impacts of these exosomes on the recipient cells should also be different.Citation44 In this study, exosomes were derived from abdominal SAT, and thus, the impact of exosomes derived from VAT on the placenta needs to be explored. On the other way, NOX4-mediated oxidative stress-induced cellular senescence which involves in NF/kB pathway, NAD+/Sirt1 Signaling Pathway,Citation60 MAPK-mediated pathway,Citation61,Citation62 is complicated, the specific mechanism of NOX4 induces premature placental senescence should be further studied.
Conclusion
In conclusion, this report is the first to directly connect adipose tissue-derived NOX4 with the placenta via exosomes. Increased NOX4 in adipose tissue due to obesity can be delivered to the placenta through exosomes, leading to DNA oxidative damage, premature senescence, and consequent dysfunction, ultimately entailing placenta malformation, decreased placental efficiency, and adverse pregnancy outcomes.
Ethics Approval and Informed Consent
The study was conducted in accordance with the Declaration of Helsinki, and approved by the Institutional Review Boards of Chongqing Medical University (2022-76). Informed written consent was obtained from all patients included in the study. All animal experiments were approved by the ethics committee of the first affiliated hospital of Chongqing Medical University (2022-k293) and performed in accordance with the Guidelines of Chongqing Medical University.
Author Contributions
YB and HQ conceived and designed the study, YT performed the experiments, analyzed the data, and wrote the manuscript. WC, HX, JX, and XL interpreted the results. HY, MC, and JH collected clinical samples. YB provided funding resources and reviewed the manuscript. All authors made a significant contribution to the work reported, whether that is in the conception, study design, execution, acquisition of data, analysis and interpretation, or in all these areas; took part in drafting, revising or critically reviewing the article; gave final approval of the version to be published; have agreed on the journal to which the article has been submitted; and agree to be accountable for all aspects of the work.
Disclosure
The authors report no conflicts of interest in this work.
Additional information
Funding
References
- American College of Obstetricians and Gynecologists. Obesity in pregnancy: ACOG practice bulletin, number 230. Obstet Gynecol. 2021;137(6):e128–e144. doi:10.1097/AOG.0000000000004395
- NCD Risk Factor Collaboration. Trends in adult body-mass index in 200 countries from 1975 to 2014: a pooled analysis of 1698 population-based measurement studies with 19·2 million participants. Lancet. 2016;387(10026):1377–1396. doi:10.1016/S0140-6736(16)30054-X
- Patro Golab B, Santos S, Voerman E, Lawlor DA, Jaddoe VWV, Gaillard R. Influence of maternal obesity on the association between common pregnancy complications and risk of childhood obesity: an individual participant data meta-analysis. Lancet Child Adolesc Health. 2018;2(11):812–821. doi:10.1016/S2352-4642(18)30273-6
- Liu X, Li X, Xia B, et al. High-fiber diet mitigates maternal obesity-induced cognitive and social dysfunction in the offspring via gut-brain axis. Cell Metab. 2021;33(5):923–938.e926. doi:10.1016/j.cmet.2021.02.002
- Sanchez CE, Barry C, Sabhlok A, et al. Maternal pre-pregnancy obesity and child neurodevelopmental outcomes: a meta-analysis. Obes Rev. 2018;19(4):464–484. doi:10.1111/obr.12643
- Sheridan MA, Fernando RC, Gardner L, et al. Establishment and differentiation of long-term trophoblast organoid cultures from the human placenta. Nat Protoc. 2020;15(10):3441–3463. doi:10.1038/s41596-020-0381-x
- Nogues P, Dos Santos E, Couturier-Tarrade A, et al. Maternal obesity influences placental nutrient transport, inflammatory status, and morphology in human term placenta. J Clin Endocrinol Metab. 2021;106(4):e1880–e1896. doi:10.1210/clinem/dgaa660
- Martens DS, Plusquin M, Gyselaers W, De Vivo I, Nawrot TS. Maternal pre-pregnancy body mass index and newborn telomere length. BMC Med. 2016;14(1):148. doi:10.1186/s12916-016-0689-0
- Biron-Shental T, Sukenik-Halevy R, Sharon Y, et al. Short telomeres may play a role in placental dysfunction in preeclampsia and intrauterine growth restriction. Am J Obstet Gynecol. 2010;202(4):381.e381–387. doi:10.1016/j.ajog.2010.01.036
- Hu C, Yan Y, Ji F, Zhou H. Maternal obesity increases oxidative stress in placenta and it is associated with intestinal microbiota. Front Cell Infect Microbiol. 2021;11:671347. doi:10.3389/fcimb.2021.671347
- Campisi J. Aging, cellular senescence, and cancer. Annu Rev Physiol. 2013;75:685–705. doi:10.1146/annurev-physiol-030212-183653
- Den Hartigh LJ, Omer M, Goodspeed L, et al. Adipocyte-specific deficiency of NADPH oxidase 4 delays the onset of insulin resistance and attenuates adipose tissue inflammation in obesity. Arterioscler Thromb Vasc Biol. 2017;37(3):466–475. doi:10.1161/ATVBAHA.116.308749
- Caja L, Sancho P, Bertran E, Iglesias-Serret D, Gil J, Fabregat I. Overactivation of the MEK/ERK pathway in liver tumor cells confers resistance to TGF-β–induced cell death through impairing up-regulation of the NADPH oxidase NOX4. Cancer Res. 2009;69(19):7595–7602. doi:10.1158/0008-5472.CAN-09-1482
- Weyemi U, Lagente-Chevallier O, Boufraqech M, et al. ROS-generating NADPH oxidase NOX4 is a critical mediator in oncogenic H-Ras-induced DNA damage and subsequent senescence. Oncogene. 2012;31(9):1117–1129. doi:10.1038/onc.2011.327
- Kalluri R, LeBleu VS. The biology, function, and biomedical applications of exosomes. Science. 2020;367(6478). doi:10.1126/science.aau6977
- Kershaw EE, Flier JS. Adipose tissue as an endocrine organ. J Clin Endocrinol Metab. 2004;89(6):2548–2556. doi:10.1210/jc.2004-0395
- Castaño C, Kalko S, Novials A, Párrizas M. Obesity-associated exosomal miRNAs modulate glucose and lipid metabolism in mice. Proc Natl Acad Sci USA. 2018;115(48):12158–12163. doi:10.1073/pnas.1808855115
- Jin J, Shi Y, Gong J, et al. Exosome secreted from adipose-derived stem cells attenuates diabetic nephropathy by promoting autophagy flux and inhibiting apoptosis in podocyte. Stem Cell Res Ther. 2019;10(1):95. doi:10.1186/s13287-019-1177-1
- Yu Y, Du H, Wei S, et al. Adipocyte-derived exosomal MiR-27a induces insulin resistance in skeletal muscle through repression of PPARγ. Theranostics. 2018;8(8):2171–2188. doi:10.7150/thno.22565
- Thomou T, Mori MA, Dreyfuss JM, et al. Adipose-derived circulating miRNAs regulate gene expression in other tissues. Nature. 2017;542(7642):450–455. doi:10.1038/nature21365
- Jayabalan N, Lai A, Ormazabal V, et al. Adipose tissue exosomal proteomic profile reveals a role on placenta glucose metabolism in gestational diabetes mellitus. J Clin Endocrinol Metab. 2019;104(5):1735–1752. doi:10.1210/jc.2018-01599
- Jayabalan N, Nair S, Nuzhat Z, et al. Cross talk between adipose tissue and placenta in obese and gestational diabetes mellitus pregnancies via exosomes. Front Endocrinol. 2017;8:239. doi:10.3389/fendo.2017.00239
- Théry C, Witwer KW, Aikawa E, et al. Minimal information for studies of extracellular vesicles 2018 (MISEV2018): a position statement of the international society for extracellular vesicles and update of the MISEV2014 guidelines. J Extracell Vesicles. 2018;7(1):1535750. doi:10.1080/20013078.2018.1535750
- Deng ZB, Poliakov A, Hardy RW, et al. Adipose tissue exosome-like vesicles mediate activation of macrophage-induced insulin resistance. Diabetes. 2009;58(11):2498–2505. doi:10.2337/db09-0216
- Li F, Xu R, Lin CL, et al. Maternal and fetal alkaline ceramidase 2 is required for placental vascular integrity in mice. FASEB J. 2020;34(11):15252–15268. doi:10.1096/fj.202001104R
- Lewandowska M. Maternal obesity and risk of low birth weight, fetal growth restriction, and macrosomia: multiple analyses. Nutrients. 2021;13(4):1213. doi:10.3390/nu13041213
- Fowden AL, Ward JW, Wooding FP, Forhead AJ, Constancia M. Programming placental nutrient transport capacity. J Physiol. 2006;572(Pt 1):5–15. doi:10.1113/jphysiol.2005.104141
- Fowden AL, Sferruzzi-Perri AN, Coan PM, Constancia M, Burton GJ. Placental efficiency and adaptation: endocrine regulation. J Physiol. 2009;587(Pt 14):3459–3472. doi:10.1113/jphysiol.2009.173013
- Santos-Rosendo C, Bugatto F, González-Domínguez A, Lechuga-Sancho AM, MateosMR, Visiedo F. Placental adaptive changes to protect function and decrease oxidative damage in metabolically healthy maternal obesity. Antioxidants. 2020;9(9):794. doi:10.3390/antiox9090794
- Furukawa S, Fujita T, Shimabukuro M, et al. Increased oxidative stress in obesity and its impact on metabolic syndrome. J Clin Invest. 2004;114(12):1752–1761. doi:10.1172/JCI21625
- Bicocca MJ, Mendez-Figueroa H, Chauhan SP, Sibai BM. Maternal obesity and the risk of early-onset and late-onset hypertensive disorders of pregnancy. Obstet Gynecol. 2020;136(1):118–127. doi:10.1097/AOG.0000000000003901
- Che L, Yang Z, Xu M, et al. Maternal nutrition modulates fetal development by inducing placental efficiency changes in gilts. BMC Genomics. 2017;18(1):213. doi:10.1186/s12864-017-3601-1
- Kretschmer T, Turnwald EM, Janoschek R, et al. Maternal high fat diet-induced obesity affects trophoblast differentiation and placental function in mice†. Biol Reprod. 2020;103(6):1260–1274. doi:10.1093/biolre/ioaa166
- Cindrova-Davies T, Sferruzzi-Perri AN. Human placental development and function. Semin Cell Dev Biol. 2022;131:66–77. doi:10.1016/j.semcdb.2022.03.039
- Brombach C, Tong W, Giussani DA. Maternal obesity: new placental paradigms unfolded. Trends Mol Med. 2022;28(10):823–835. doi:10.1016/j.molmed.2022.05.013
- Higuchi S, Miyamoto T, Kobara H, et al. Trophoblast type-specific expression of senescence markers in the human placenta. Placenta. 2019;85:56–62. doi:10.1016/j.placenta.2019.06.377
- Sultana Z, Maiti K, Dedman L, Smith R. Is there a role for placental senescence in the genesis of obstetric complications and fetal growth restriction? Am J Obstet Gynecol. 2018;218(2s):S762–s773. doi:10.1016/j.ajog.2017.11.567
- Chuprin A, Gal H, Biron-Shental T, et al. Cell fusion induced by ERVWE1 or measles virus causes cellular senescence. Genes Dev. 2013;27(21):2356–2366. doi:10.1101/gad.227512.113
- DeVallance E, Li Y, Jurczak MJ, Cifuentes-Pagano E, Pagano PJ. The role of NADPH oxidases in the etiology of obesity and metabolic syndrome: contribution of individual isoforms and cell biology. Antioxid Redox Signal. 2019;31(10):687–709. doi:10.1089/ars.2018.7674
- Han CY, Umemoto T, Omer M, et al. NADPH oxidase-derived reactive oxygen species increases expression of monocyte chemotactic factor genes in cultured adipocytes. J Biol Chem. 2012;287(13):10379–10393. doi:10.1074/jbc.M111.304998
- Peng Y, Du J, Günther S, et al. Mechano-signaling via Piezo1 prevents activation and p53-mediated senescence of muscle stem cells. Redox Biol. 2022;52:102309. doi:10.1016/j.redox.2022.102309
- Durcin M, Fleury A, Taillebois E, et al. Characterisation of adipocyte-derived extracellular vesicle subtypes identifies distinct protein and lipid signatures for large and small extracellular vesicles. J Extracell Vesicles. 2017;6(1):1305677. doi:10.1080/20013078.2017.1305677
- Pardo F, Villalobos-Labra R, Sobrevia B, Toledo F, Sobrevia L. Extracellular vesicles in obesity and diabetes mellitus. Mol Aspects Med. 2018;60:81–91. doi:10.1016/j.mam.2017.11.010
- Kwan HY, Chen M, Xu K, Chen B. The impact of obesity on adipocyte-derived extracellular vesicles. Cell Mol Life Sci. 2021;78(23):7275–7288. doi:10.1007/s00018-021-03973-w
- Pan Y, Hui X, Hoo RLC, et al. Adipocyte-secreted exosomal microRNA-34a inhibits M2 macrophage polarization to promote obesity-induced adipose inflammation. J Clin Invest. 2019;129(2):834–849. doi:10.1172/JCI123069
- Lazar I, Clement E, Dauvillier S, et al. Adipocyte exosomes promote melanoma aggressiveness through fatty acid oxidation: a novel mechanism linking obesity and cancer. Cancer Res. 2016;76(14):4051–4057. doi:10.1158/0008-5472.CAN-16-0651
- Ilatovskaya DV, Blass G, Palygin O, et al. A NOX4/TRPC6 pathway in podocyte calcium regulation and renal damage in diabetic kidney disease. J Am Soc Nephrol. 2018;29(7):1917–1927. doi:10.1681/ASN.2018030280
- Cao Z, Ye T, Sun Y, et al. Targeting the vascular and perivascular niches as a regenerative therapy for lung and liver fibrosis. Sci Transl Med. 2017;9(405). doi:10.1126/scitranslmed.aai8710
- Fernandes DC, Wosniak J, Gonçalves RC, et al. PDIA1 acts as master organizer of NOX1/NOX4 balance and phenotype response in vascular smooth muscle. Free Radic Biol Med. 2021;162:603–614. doi:10.1016/j.freeradbiomed.2020.11.020
- Rharass T, Lucas S. High glucose level impairs human mature bone marrow adipocyte function through increased ROS production. Front Endocrinol. 2019;10:607. doi:10.3389/fendo.2019.00607
- Kumari R, Jat P. Mechanisms of cellular senescence: cell cycle arrest and senescence associated secretory phenotype. Front Cell Dev Biol. 2021;9:645593.
- Aouache R, Biquard L, Vaiman D, Miralles F. Oxidative stress in preeclampsia and placental diseases. Int J Mol Sci. 2018;19(5):1496. doi:10.3390/ijms19051496
- Srinivas US, Tan BWQ, Vellayappan BA, Jeyasekharan AD. ROS and the DNA damage response in cancer. Redox Biol. 2019;25:101084. doi:10.1016/j.redox.2018.101084
- Ateghang B, Wartenberg M, Gassmann M, Sauer H. Regulation of cardiotrophin-1 expression in mouse embryonic stem cells by HIF-1alpha and intracellular reactive oxygen species. J Cell Sci. 2006;119(Pt 6):1043–1052. doi:10.1242/jcs.02798
- Jafari N, Kim H, Park R, et al. CRISPR-Cas9 mediated NOX4 knockout inhibits cell proliferation and invasion in HeLa Cells. PLoS One. 2017;12(1):e0170327. doi:10.1371/journal.pone.0170327
- Yoshikawa Y, Ago T, Kuroda J, et al. Nox4 promotes neural stem/precursor cell proliferation and neurogenesis in the hippocampus and restores memory function following trimethyltin-induced injury. Neuroscience. 2019;398:193–205. doi:10.1016/j.neuroscience.2018.11.046
- Crosas-Molist E, Bertran E, Sancho P, et al. The NADPH oxidase NOX4 inhibits hepatocyte proliferation and liver cancer progression. Free Radic Biol Med. 2014;69:338–347. doi:10.1016/j.freeradbiomed.2014.01.040
- Haurani MJ, Cifuentes ME, Shepard AD, Pagano PJ. Nox4 oxidase overexpression specifically decreases endogenous Nox4 mRNA and inhibits angiotensin II-induced adventitial myofibroblast migration. Hypertension. 2008;52(1):143–149. doi:10.1161/HYPERTENSIONAHA.107.101667
- Gerhard GS, Styer AM, Strodel WE, et al. Gene expression profiling in subcutaneous, visceral and epigastric adipose tissues of patients with extreme obesity. Int J Obes. 2014;38(3):371–378. doi:10.1038/ijo.2013.152
- Wang LF, Cao Q, Wen K, et al. CD38 deficiency alleviates D-galactose-induced myocardial cell senescence through NAD(+)/Sirt1 signaling pathway. Front Physiol. 2019;10:1125. doi:10.3389/fphys.2019.01125
- Dai X, Chen Y, Yu Z, et al. Advanced oxidation protein products induce annulus fibrosus cell senescence through a NOX4-dependent, MAPK-mediated pathway and accelerate intervertebral disc degeneration. PeerJ. 2022;10:e13826. doi:10.7717/peerj.13826
- Feng C, Zhang Y, Yang M, et al. Oxygen-sensing nox4 generates genotoxic ROS to induce premature senescence of nucleus pulposus cells through MAPK and NF-κB pathways. Oxid Med Cell Longev. 2017;2017:7426458. doi:10.1155/2017/7426458