Abstract
The widespread use of zinc oxide (ZnO) nanoparticles worldwide exposes humans to their adverse effects, so it is important to understand their biological effects and any associated risks. This study was designed to investigate the cytotoxicity, oxidative stress, and apoptosis caused by ZnO nanoparticles in human skin melanoma (A375) cells. MTT [3-(4,5-dimethylthiazol-2-yl)-2,5-diphenyltetrazoliumbromide] and lactate dehydrogenase-based cell viability assays showed a significant decrease in cell viability after exposure to ZnO nanoparticles, and phase contrast images revealed that cells treated with these nanoparticles had a lower density and a rounded morphology. ZnO nanoparticles were also found to induce oxidative stress, evidenced by generation of reactive oxygen species and depletion of the antioxidant, glutathione. Induction of apoptosis was confirmed by chromosomal condensation assay and caspase-3 activation. Further, more DNA damage was observed in cells exposed to the highest concentration of ZnO nanoparticles. These results demonstrate that ZnO nanoparticles have genotoxic potential in A375 cells, which may be mediated via oxidative stress. Our short-term exposure study showing induction of a genotoxic and apoptotic response to ZnO nanoparticles needs further investigation to determine whether there may be consequences of long-term exposure to ZnO nanoparticles.
Introduction
Production of engineered nanoparticles is increasing rapidly as the field of nanotechnology continues to expand. There has been exponential growth in the use of nanotechnology in many areas, eg, medicine, consumer products, clothes, electronics, and sporting goods.Citation1 Despite the widespread applications of zinc oxide (ZnO) nanoparticles, there is still a lack of information concerning their toxicity at the cellular and molecular levels. Brunner et alCitation2 reported that ZnO nanoparticles (19 nm) induced near complete cell death in human mesothelioma and rodent fibroblasts. Human neural cells showed an approximately 50% decrease in survival after 48 hours of exposure to ZnO nanoparticles (11 μg/mL) and human alveolar epithelial cell viability was reduced by 50% after 24 hours by exposure to ZnO nanoparticles at a concentration of 4 μg/mL.Citation3 Reduction in neural stem cell survivorship was also observed after 24 hours of incubation with ZnO nanoparticles at a concentration of 12 μg/mL.Citation4 In addition, cancerous human T cells were demonstrated to have around 30 times more sensitivity to ZnO nanoparticle toxicity than normal T cells.Citation5
We chose human skin melanoma cells as a model to assess the toxicity potential of ZnO nanoparticles because skin tissue in humans is often the first level of exposure to many toxicants.Citation6 Reactive oxygen species are important factors not only in the apoptosis process,Citation7 but also in DNA damageCitation8 and many other cellular processes. We subsequently measured reactive oxygen species levels to determine whether generation of reactive oxygen species could be a possible mechanism for the cytotoxicity observed for ZnO nanoparticles. Apoptosis-mediated changes on exposure to ZnO and other nanoparticles have also been reported for a number of cell types, including human lymphocytes,Citation9 liver cells from the adult zebrafish,Citation10 and human epidermal keratinocytes.Citation11 Further, recent research has demonstrated the genotoxicity of ZnO nanoparticles in human cells.Citation12 However, the mechanism involved in the toxicity of commercially available ZnO nanoparticles is not well understood. Premanathan et alCitation13 have reported that ZnO nanoparticles release zinc ions (Zn2+) in the aqueous state. Therefore, we also investigated whether ZnO nanoparticles can have a toxic effect on A375 cells, and, if so, whether the toxicity results from release of soluble Zn2+ or from the ZnO nanoparticles per se. Thus, the present investigations were carried out to study the mechanisms underlying the apoptotic and genotoxic potential of ZnO nanoparticles in human skin melanoma cells through generation of reactive oxygen species and oxidative stress.
Materials and methods
Chemicals and reagents
Fetal bovine serum, penicillin-streptomycin, and Dulbecco’s Modified Eagle Medium/F-12 medium were purchased from Invitrogen (Carlsbad, CA, USA). ZnO nanoparticles, glutathione, 5, 5-dithio-bis-(2-nitrobenzoic acid), MTT, 2,7-dichlorofluorescin diacetate, and propidium iodide were obtained from Sigma-Aldrich (St Louis, MO, USA). Zinc chloride and all other chemicals used were of high purity and available from commercial sources.
Preparation and characterization of ZnO nanoparticles
ZnO nanoparticles were suspended in medium at a concentration of 1 mg/mL. Stock suspension was probe-sonicated at 40 W for 15 minutes. The optical absorption of the ZnO nanoparticle suspension was measured using a double-beam ultraviolet-visible spectrum (Varian-Cary-300 ultraviolet-visible spectrophotometer, Varian Inc, Columba, MD, USA) in the wavelength range of 200–800 nm at room temperature. The average hydrodynamic size of the ZnO nanoparticles was measured by dynamic light scattering (Nano-Zeta Sizer-HT, Malvern Instruments, Worcestershire, UK) following the procedure reported by Murdock et al.Citation14 Samples for transmission electron microscopy (TEM) analysis were prepared by dropcoating ZnO nanoparticle solution onto carbon-coated copper TEM grids. The films on the TEM grids were allowed to dry prior to measurement. TEM measurements were performed on a JEOL model 2100F (Tokyo, Japan) operated at an accelerating voltage of 200 kV
Cell culture and exposure to ZnO nanoparticles
A human malignant melanoma skin (A375) cell line (passage 22) was sourced from the American Type Culture Collection (Rockville, MD, USA. Accession number HB-8065), preserved and subcultured up to passage 48 in the laboratory, and then used to determine cell viability on exposure to ZnO nanoparticles and Zn2+. The cells were cultured in Dulbecco’s Modified Eagle Medium/F-12 medium supplemented with 10% fetal bovine serum and 100 U/mL penicillin-streptomycin at 5% CO2 and 37°C. At 85% confluence, the cells were harvested using 0.25% trypsin and subcultured in 75 cmCitation2 flasks, six-well plates, and 96-well plates according to the experiment being performed. The cells were allowed to attach to the surface for 24 hours prior to treatment. The ZnO nanoparticles were suspended in cell culture medium and diluted to appropriate concentrations (0, 5, 10, and 20 μg/mL). The appropriate dilutions of ZnO nanoparticles were then sonicated using a sonicator bath at room temperature for 10 minutes at 40 W to avoid agglomeration of particles before exposure to the cells. Cells not exposed to ZnO nanoparticles served as a control in each experiment.
Dissolution of ZnO nanoparticles
Dissolution of ZnO nanoparticles and exposure of cells to the same was analyzed to determine whether Zn2+ released from the ZnO nanoparticle suspension may play a role in cellular toxicity. Concentrations of the Zn2+ released were measured in all the types of culture medium which were collected immediately from the ZnO nanoparticle-treated cells at the end of exposure and centrifuged at 30,000 g for 30 minutes. After centrifugation, the Zn2+ concentrations released in the supernatants were detected by fame atomic absorption spectroscopy (GBC Avanta version 2.01, GBC Scientific, Hampshire, IL, USA). Further, to compare the toxic effects of the Zn2+ released with that of ZnO nanoparticles, another exposure regimen using soluble Zn2+ was performed. In that experiment, the ZnO nanoparticle suspension was replaced by Zn2+ solution (10 and 20 μg/mL), by adding the required mass of zinc chloride (97.0%–100%, BDH Chemicals, Radnor, PA, USA) to the culture medium.
Cell morphology
The morphology of the A375 cells was observed using a DMIL phase-contrast microscope (Leica, Wetzlar, Germany) after exposure to different concentrations of ZnO nanoparticles for 24 and 48 hours.
Mitochondrial function
The MTT assay was used to investigate mitochondrial function as described by Mossman.Citation15 Briefly, 1 × 10Citation4 cells/well were seeded in 96-well plates and exposed to different concentrations of ZnO nanoparticles and Zn2+ for 24 and 48 hours. At the end of exposure, the culture medium was replaced with new medium containing MTT solution (0.5 mg/mL) and incubated for 4 hours at 37°C. The formazan crystals formed were dissolved in dimethylsulfoxide. The plates were put on a shaker for 10 minutes at room temperature and then analyzed at 530 nm using a multiwell microplate reader (Omega Fluostar, BMG Labtech, Ortenberg, Germany). Untreated sets were also run under identical conditions and served as controls.
Lactate dehydrogenase leakage
Release of the cytoplasmic enzyme, lactate dehydrogenase, into culture medium has been reported by Wroblewski and LaDue.Citation16 A375 cells were treated with different concentrations of ZnO nanoparticles and Zn2+ for 24 and 48 hours. After exposure, 100 μL samples were collected from the centrifuged culture medium. Lactate dehydrogenase activity was assayed in 3.0 mL of reaction mixture containing 100 μL of pyruvic acid (2.5 mg/mL of phosphate buffer) and 100 μL of nicotinamide adenine dinucleotide (2.5 mg/mL of phosphate buffer), and the rest of the volume was adjusted with phosphate-buffered solution (0.1 M, pH 7.4). The rate of oxidation of nicotinamide adenine dinucleotide was determined by following the decrease in absorbance at 340 nm for 3 minutes at one-minute intervals and 25°C using a spectrophotometer (Varian-Cary 300 Bio). The amount of lactate dehydrogenase released is expressed as lactate dehydrogenase activity (IU/L) in culture medium.
Generation of intracellular reactive oxygen species
Generation of reactive oxygen species was assessed using 2, 7-dichlorofluorescin diacetate dye as a fluorescence agentCitation17 in A375 cells after exposure to different concentrations of ZnO nanoparticles and Zn2+. Generation of reactive oxygen species was studied by two methods, ie, fluorometric analysis and microscopic fluorescence imaging. For fluorometric analysis, cells (1 × 10Citation4 per well) were seeded in 96-well black-bottomed culture plates and allowed to adhere for 24 hours in a CO2 incubator at 37°C. Next, the A375 cells were exposed to the above concentrations of ZnO nanoparticles and Zn2+ for 24 and 48 hours. On completion of their respective exposure periods, the cells were incubated with 2,7-dichlorofluorescin diacetate 10 mM for 30 minutes at 37°C. The reaction mixture was aspirated and replaced in each well by 200 μL of phosphate-buffered solution. The plates were put on a shaker for 10 minutes at room temperature in the dark. Fluorescence intensity was measured using a Multiwell microplate reader (Omega Fluostar) at an excitation wavelength of 485 nm and an emission wavelength of 528 nm, and values were expressed as percent of fluorescence intensity relative to the control wells. A parallel set of cells (5 × 10Citation4 per well) were analyzed for intracellular fluorescence using an upright fluorescence microscope equipped with a cooled charged couple device camera (Nikon Eclipse 80i equipped with a Nikon DS-Ri1 12.7 mega pixel camera, Nikon, Tokyo, Japan).
Biomarkers of oxidative stress
Cells at a final density of approximately 6 × 10Citation6 in a 75 cmCitation2 culture flask were exposed to different concentrations of ZnO nanoparticles and Zn2+ for 24 and 48 hours. After exposure, the cells were scraped off and washed twice with chilled 1 × phosphate-buffered solution. The harvested cell pellets were lysed in cell lysis buffer (20 mM Tris-HCl [pH 7.5], 150 mM NaCl, 1 mM Na2EDTA, 1% Triton, 2.5 mM sodium pyrophosphate). The cells were centrifuged at 15,000 g for 10 minutes at 4°C. The supernatant (cell extract) was maintained on ice until assayed for biomarkers of oxidative stress. Protein content was measured using the method described by BradfordCitation18 with bovine serum albumin as the standard.
Lipid peroxidation assay
The extent of membrane lipid peroxidation was estimated by measuring the formation of malondialdehyde using the method reported by Ohkawa et al.Citation19 Malondialdehyde is one of the products of membrane lipid peroxidation. A mixture of 0.1 mL of cell extract and 1.9 mL of 0.1 M sodium phosphate buffer (pH 7.4) was incubated at 37°C for one hour. The incubation mixture, after precipitation with 5% trichloroacetic acid was centrifuged at 2300 g for 15 minutes at room temperature, after which the supernatant was collected. Next, 1.0 mL of 1% tert-butyl alcohol was added to the supernatant and placed in boiling water for 15 minutes. After cooling to room temperature, absorbance of the mixture was taken at 532 nm and expressed in nmol of malondialdehyde/hour/mg protein using a molar extinction coefficient of 1.56 × 10Citation5 M/cm.
Glutathione levels
The glutathione level was quantified using Ellman’s reagent.Citation20 The assay mixture contained phosphate buffer, 5, 5-dithio-bis-(2-nitrobenzoic acid), and cell extract. The reaction was monitored at 412 nm and the amount of glutathione was expressed in terms of nmol glutathione per mg protein.
Superoxide dismutase activity
Superoxide dismutase activity was estimated using a method described by Kakkar et al.Citation21 The assay mixture contained sodium pyrophosphate buffer, nitroblue tetrazolium, phenazine methosulfate, reduced nicotinamide adenine dinucleotide, and the required volume of cell extract. One unit of superoxide dismutase enzyme activity is defined as the amount of enzyme required for inhibiting chromogen production (optical density 560 nm) by 50% in one minute under assay conditions and is expressed as specific activity in units per minute per mg protein.
Catalase activity
Catalase activity was measured by following its ability to split hydrogen peroxide (H2O2) within one minute of incubation time. The reaction was then stopped by adding dichromate/acetic acid reagent, and the remaining H2O2 was determined by measuring chromic acetate at 570 nm. Chromic acetate is formed by reduction of dichromate/acetic acid in the presence of H2O2, as described elsewhere.Citation22 Catalase activity was expressed as μmol H2O2 decomposed per minute per mg protein.
Caspase-3 assay
The activity of caspase-3 was determined from cleavage of the caspase-3 substrate (N-acetyl-DEVD-p-nitroaniline), with p-nitroaniline used as the standard. Cleavage of the substrate was monitored at 405 nm and its specific activity was expressed in picomoles of product (nitroaniline) per minute per mg of protein.
DAPI staining for chromosome condensation
Chromosome condensation in A375 cells due to ZnO nanoparticles and Zn2+ was observed by 4′, 6-diamidino-2-phenylindole (DAPI) staining according to the method described by Dhar-Mascareno et al.Citation23 DAPI solution was used to stain the exposed cells in eight chamber slides and the slides were incubated for 10 minutes in the dark at 37°C. Images of the nucleus were captured using a fluorescence microscope (Nikon) at an excitation wavelength of 330 nm and at emission wavelength of 420 nm.
Determination of DNA strand breakage
Alkaline single cell gel electrophoresis was performed as a three-layer procedureCitation24 with slight modification.Citation25 In brief, 70,000 cells/well were seeded in a six-well plate. After 24 hours of seeding, the cells were treated with different concentrations of ZnO nanoparticles and Zn2+ for 24 and 48 hours. After treatment, the A375 cells were trypsinized and resuspended in Dulbecco’s Modified Eagle Medium, and the cell suspension was centrifuged at 1200 rpm and 4°C for 5 minutes. The cell pellet was finally suspended in chilled phosphate-buffered solution for comet assay. Cell viability was evaluated using the trypan blue exclusion method.Citation26 Samples showing cell viability higher than 84% were further processed for comet assay. In brief, about 15 μL of cell suspension (approximately 20,000 cells) were mixed with 85 μL of 0.5% low melting point agarose and layered on one end of a frosted plain glass slide precoated with a layer of 200 μL normal agarose (1%). Thereafter, the sample was covered with a third layer of 100 μL low melting point agarose. After solidification of the gel, the slides were immersed in lysing solution (2.5 M NaCl, 100 mM Na2EDTA, 10 mM Tris, pH 10, with 10% dimethylsulfoxide and 1% Triton X-100 added fresh) overnight at 4°C. The slides were then placed in a horizontal gel electrophoresis unit. Fresh cold alkaline electrophoresis buffer (300 mM NaOH, 1 mM Na2EDTA and 0.2% dimethylsulfoxide, pH 13.5) was poured into the chamber and left for 20 minutes at 4°C for unwinding of DNA and conversion of alkali-labile sites to single strand breaks. Electrophoresis was carried out using the same solution at 4°C for 20 minutes at 15 V (0.8 V/cm) and 300 mA. The slides were neutralized gently with 0.4 M Tris buffer at pH 7.5 and stained with 75 μL of ethidium bromide (20 μg/mL). For the positive control, A375 cells were treated with 100 μM H2O2 for 10 minutes at 4°C. Two slides were prepared from each well (per concentration) and 50 cells per slide (100 cells per concentration) were scored randomly and analyzed using an image analysis system (Komet 5.0, Kinetic Imaging, Liverpool, UK) attached to a fluorescence microscope (DMLB, Leica) equipped with appropriate filters. The parameters, ie, percent tail DNA (% tail DNA = 100% head DNA) and olive tail moment were selected for quantification of DNA damage in A375 cells as determined by the software.
Statistical analysis
At least three independent experiments were carried out in duplicate for each experiment. The data were expressed as the mean (±standard error of the mean) and analyzed by one-way analysis of variance. A P value less than 0.01 was considered to be statistically significant.
Results
Physicochemical characterization of ZnO nanoparticles
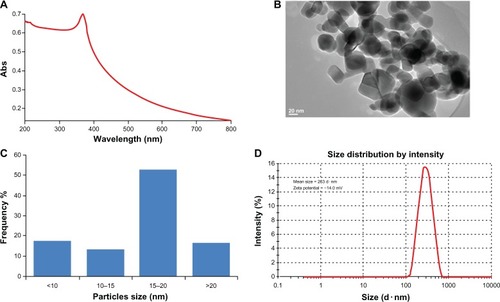
Ultraviolet-visible spectrophotometry showed an absorption band (). shows a typical TEM image of the ZnO nanoparticles, and indicates that the majority of the nanoparticles were in a polygonal sheet shape with smooth surfaces. The average diamete of the ZnO nanoparticles was calculated from measuring over 100 particles in random fields of TEM view and found to be around 17 nm. shows the size (nm) distribution of the nanoparticles. The average hydrodynamic size and zeta potential of the nanoparticles in medium determined by dynamic light scattering were 263.0 nm and −14.0 mV, respectively ().
Figure 1 Characterization of ZnONPs (A) UV-visible spectrum of ZnONPs. (B) TEM image. (C) The size distribution histogram generated by using TEM image. (D) Size distribution and zeta potential of ZnONPs were determined using dynamic light scattering (DLS).
Abbreviations: Abs, absorbance; ZnONPS, zinc oxide nanoparticles; UV, ultra violet; TEM, transmission electron microscope.
Morphological changes and cytotoxicity
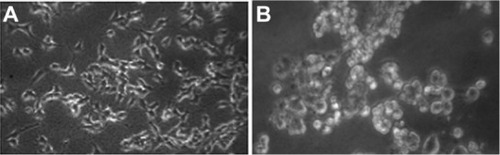
shows the comparative morphology of untreated and ZnO nanoparticle-treated A375 cells. Morphological changes in cells started to become visible after exposure to 5 μg/mL ZnO nanoparticles for 24 hours. Cells treated with 10 μg/mL ZnO nanoparticles after 48 hours changed into a spherical shape and detached from the surface (). The morphology of the A375 cells exposed to ZnO nanoparticles is consistent with membrane damage and our cytotoxicity results.
Figure 2 Morphology of human skin malignant melanoma cells A375. (A) Control, (B) 10 μg/mL of ZnONPs treated for 48 hours.
Note: Magnification 200×.
Abbreviation: ZnOPs, zinc oxide nanoparticles.
We examined mitochondrial function by MTT reduction and membrane damage by lactate dehydrogenase leakage as cytotoxicity end points. The MTT results demonstrated concentration-dependent and time-dependent cytotoxicity in A375 cells after exposure to ZnO nanoparticles (). The MTT reduction observed after 24 hours of exposure to nanoparticle concentrations of 5, 10, and 20 μg/mL was 2.4%, 16%, and 58.6%, respectively, with a further reduction to 3.2%, 38%, and 76.6% after 48 hours of exposure. The ZnO nanoparticles were also found to induce lactate dehydrogenase leakage in a concentration-dependent and time-dependent manner ().
Figure 3 Cytotoxicity of ZnONPs and Zn2+ in A375 cells for 24 hours and 48 hours. (A) MTT reduction. (B) LDH leakage.
Notes: Each value represents the mean ± SE of three experiments, performed in duplicate. *P < 0.01 vs control.
Abbreviations: ZnONPs, zinc oxide nanoparticles; MTT, [3-(4, 5 dimethylthiazol-2-yl)-2,5-diphenyltetrazolium bromide]; LDH, lactate dehydrogenase.
![Figure 3 Cytotoxicity of ZnONPs and Zn2+ in A375 cells for 24 hours and 48 hours. (A) MTT reduction. (B) LDH leakage.Notes: Each value represents the mean ± SE of three experiments, performed in duplicate. *P < 0.01 vs control.Abbreviations: ZnONPs, zinc oxide nanoparticles; MTT, [3-(4, 5 dimethylthiazol-2-yl)-2,5-diphenyltetrazolium bromide]; LDH, lactate dehydrogenase.](/cms/asset/356110e3-c09e-4d54-8b36-4279926f48ba/dijn_a_42028_f0003_c.jpg)
Generation of reactive oxygen species and oxidative stress
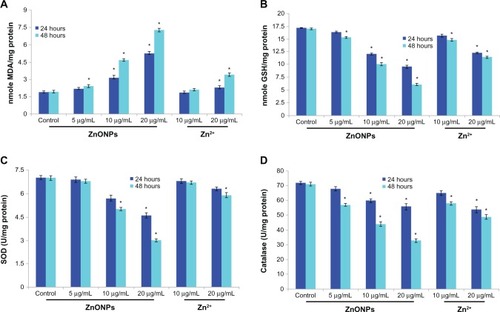
The ability of ZnO nanoparticles to induce oxidative stress was evaluated by measuring reactive oxygen species, lipid peroxidation, glutathione, superoxide dismutase, and catalase levels in A375 cells. The results show that ZnO nanoparticles induced generation of intracellular reactive oxygen species in a dose-dependent and time-dependent manner (). Oxidative stress caused by ZnO nanoparticles was further evidenced by induction of lipid peroxidation and depletion of glutathione superoxide dismutase and catalase according to concentration and duration of exposure to the nanoparticles (–).
Figure 4 Representative microphotographs showing ZnONPs and Zn2+ induced ROS generation in A375 cells. Images were captured on fluorescence microscope Nikon Eclipse 80i equipped with a Nikon DS-Ri1 12.7 mega pixel camera. (A) Control, (B) at 10 μg/mL of Zn2+, (C) at 10 μg/mL of ZnONPs. (D) Percentage change in ROS generation for 24 and 48 hours exposure to various concentrations of ZnONPs and Zn2+ in A375 cells.
Notes: Each value represents the mean ± SE of three experiments, performed in duplicate. *P < 0.01 vs control.
Abbreviation: ZnOPs, zinc oxide nanoparticles.
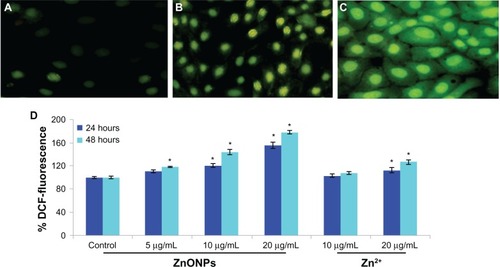
Figure 5 (A) Levels of lipid peroxides (LPO), (B) gSH, (C) SOD. (D) Catalase in A375 cells after exposure of ZnONPs and Zn2+ for 24 hours and 48 hours.
Notes: Each value represents the mean ± SE of three experiments, performed in duplicate. *P < 0.01 vs control.
Abbreviations: gSH, glutathione; MDA, malondialdehyde; SOD, superoxide dismutase; ZnONPs, zinc oxide nanoparticles; SE, standard error.
Caspase-3 activity and chromosome condensation
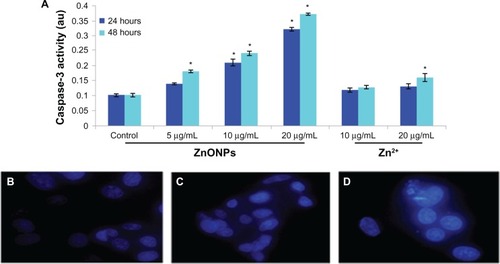
Caspase-3, which plays a key role in the apoptotic pathway, was induced following treatment with ZnO nanopar-ticles (). When cells were treated with 5, 10, and 20 μg/mL concentrations of ZnO nanoparticles for 24 and 48 hours, the activity of caspase-3 increased in a concentration-dependent and time-dependent manner. In addition to measuring caspase-3 activity, chromatin condensation was also evaluated by DAPI staining. When cells were treated with the above concentrations of ZnO nanoparticles for 24 hours, chromatin condensation was observed in the treated group (–). The caspase-3 activation and chromatin condensation in A375 cells suggest that the ZnO nanoparticles caused cell death via an apoptotic process.
Figure 6 Increase of Caspase-3 activity and chromosome condensation in A375 cells after exposure to ZnONPs and Zn2+ for 24 and 48 hours. (A) Caspase-3 activity. (B) Control. (C) Exposed at 20 μg/mL Zn2+. (D) Exposed at 20 μg/mL ZnONPs.
Notes: Each value represents the mean ± SE of three experiments. *P < 0.01 vs control.
Abbreviations: ZnONPs, zinc oxide nanoparticles; SE, standard error.
DNA damage
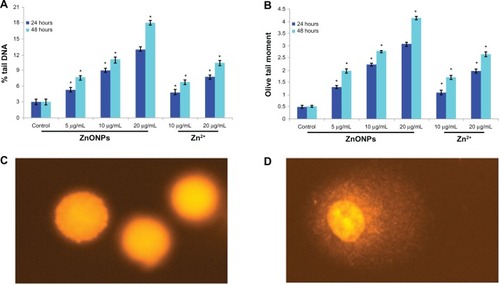
DNA damage was measured as % tail DNA and olive tail moment in the control cells and in the cells exposed to ZnO nanoparticles. During electrophoresis, the cell DNA was observed to migrate more rapidly towards the anode at the highest nanoparticle concentration than at the lowest concentration. Cells exposed to different concentrations of ZnO nanoparticles showed significantly (P > 0.01) more DNA damage than did the control cells. A gradual nonlinear increase in cell DNA damage was observed as concentration and duration of ZnO nanoparticle exposure increased. The most DNA damage in the A375 cells was recorded at a ZnO nanoparticle concentration of 20 μg/mL ().
Figure 7 DNA damage in A375 cells after 24 hours and 48 hours of exposure to different concentrations of ZnONPs and Zn2+. (A) % tail DNA. (B) Olive tail moment (arbitrary unit). (C) Control cell. (D) Exposed cell.
Notes: Each value represents the mean ± SE of three experiments, performed in duplicate. *P < 0.01 vs control.
Abbreviations: ZnONPs, zinc oxide nanoparticles; SE, standard error.
Effects of soluble Zn2+ on cytotoxicity, oxidative stress, apoptosis markers, and DNA damage
To determine whether the cytotoxicity, oxidative stress, apoptosis, and DNA damage that we observed could be attributable to the Zn2+ released we analyzed the amount of Zn2+ released from ZnO nanoparticles and tested the effect of Zn2+ concentration on A375 cells. The Zn2+ concentrations released from the ZnO nanoparticle suspension were measured and the highest Zn2+ concentration released was 1.02 ±0.17 μg/mL from the 20 μg/mL ZnO nanoparticle suspension. Our data on the dissolution of ZnO nanoparticles in the aqueous state are in agreement with other recent studies.Citation27 We further examined the toxicity of 5, 10, and 20 μg/mL soluble Zn2+ in A375 cells and found that Zn2+ exerted cytotoxicity (MTT reduction and lactate dehydrogenase leakage), oxidative stress (reactive oxygen species, lipid peroxidation, glutathione, catalase, and superoxide dismutase), apoptosis (caspase-3 and chromatin condensation), and DNA damage, but its effects were less significant in comparison with similar concentrations of ZnO nanoparticles, as shown in –.
Discussion
In spite of the many advantages of nanotechnology, studies indicate that nanoparticles may have hazardous effects because of their unique physicochemical properties. However, the beneficial effects of ZnO nanoparticles have attracted considerable attention in terms of their potential role as nanocarriers for therapeutic drugs.Citation13 Before studying the toxic potential of ZnO nanoparticles, we characterized their zeta potential and size by dynamic light scattering as well as TEM. However, the size obtained by dynamic light scattering was more than the size measured by TEM. This difference is due to the fact that different size determination methods give different results depending on the principles used. First, dynamic light scattering measures Brownian motion and subsequent size distribution of a collection of particles in solution, and gives a mean hydrodynamic diameter which is usually larger than the TEM diameter because it includes several solvent layers. Second, during dynamic light scattering measurement, there is a tendency of particles to agglomerate in the aqueous state, thereby measuring the size of clustered particles rather than individual particles. Third, dynamic light scattering reports an intensity-weighted average hydrodynamic diameter for a collection of particles, so any polydispersity of the sample will skew the average diameter towards larger particle sizes.Citation28
Morphological observations using electron microscopy confirmed that the ZnO nanoparticles are uniform in electron density, and have a regular morphology and homogenous particle size. We found that reduction of A375 cell viability started at a ZnO nanoparticle exposure of 5 μg/mL. The cell viability data were supported further by the morphological studies, in which cells detached from the surface and took on a spherical shape. Nair et alCitation29 reported that the cytotoxicity of ZnO nanoparticles in cancerous cells is related to size, with smaller nanoparticles having greater toxicity. The induction of cytotoxicity observed in the present study for ZnO nanoparticles is in accordance with the findings of Hanley et alCitation5 and Ostrovsky et alCitation30 in cancer cells.
Given the obvious cytotoxicity of ZnO nanoparticles, we need to consider the stability of the particles in cell culture suspension as well as address potential concerns about the toxicity of dissolved Zn2+. Recent studies have shown that Zn2+ is released from the surface of ZnO nanoparticles when they are suspended in an aqueous state.Citation31 Moos et alCitation32 reported that although ZnO nanoparticles liberate Zn2+ in an aqueous state, the levels of Zn2+ released are insufficient to be toxic to cells. Moreover, in a recent study, Kilari et alCitation33 showed the protective effect of Zn2+ in Caco-2 cells. SherrCitation34 has reported that extensive DNA damage triggers apoptosis. However, some researchers have reported that strand breaks may be introduced directly by genotoxic compounds by induction of apoptosis or necrosis, indirectly through interaction with oxygen radicals or other reactive intermediates, or as a consequence of excision repair enzymes.Citation35,Citation36 We examined the apoptosis induced in A375 cells by ZnO nanoparticles using DAPI staining. The results indicate that ZnO nanoparticles induced significant chromosomal condensation in A375 cells. At the highest ZnO nanoparticle concentration, highly fragmented nuclei showing damage to the head region and images with nearly all DNA in the tail or with a very wide tail were observed more frequently. However, to ensure accuracy and to meet the criteria for comet scoring, such images were excluded from our evaluation. Data from the MTT assay, which indirectly measures cell viability by assessing mitochondrial function,Citation25 corroborated the caspase-3 results by showing a reduction in cell survivorship after exposure to ZnO nanoparticles. Nel et alCitation37 reported reactive oxygen species generation and oxidative stress indicated by mitochondrial perturbation, resulting in cell death as a result of apoptosis or necrosis.
In the present study, ZnO nanoparticles significantly altered the oxidant/antioxidant status of A375 cells. Generation of reactive oxygen species may trigger redox cycling cascades in the cell or at adjacent cell membranes, leading to depletion of cellular antioxidants and, as a consequence, irreparable oxidative damage to cells. Generation of reactive oxygen species and membrane lipid peroxidation was significantly higher, while levels of the antioxidant molecule, glutathione, and the activity of the antioxidant enzymes, superoxide dismutase and catalase, were lower in cells after exposure to ZnO nanoparticles. Xia et alCitation38 reported that ZnO nanoparticles induce generation of reactive oxygen species which can lead to cell death when the antioxidative capacity of the cell is exceeded. Glutathione, a ubiquitous and abundant antioxidant cellular tripeptide, was found to be strongly depleted after exposure to ZnO nanoparticles. Superoxide dismutase is specialized to convert the highly toxic superoxide radical to less toxic H2O2. The catalase enzyme reduces H2O2 to H2O. More production of intracellular reactive oxygen species and more membrane lipid peroxidation in cells exposed to ZnO nanoparticles along with depletion of their antioxidant components suggest that oxidative stress might be a primary mechanism for the toxicity of ZnO nanoparticles in A375 cells. Activated caspase-3 is capable of autocatalysis as well as cleaving and activating other members of the caspase family, leading to rapid and irreversible apoptosis.Citation39 In the presence of DNA damage or cellular stress, cell cycle checkpoint protein p53 triggers cell cycle arrest to provide time for the damage to be repaired or for self-mediated apoptosis. Reactive oxygen species typically include the superoxide radical (O2−), H2O2, and the hydroxyl radical (OH•), which cause damage to cellular components, including DNA, and ultimately lead to apoptotic cell death.Citation40 Some researchers have also reported that ZnO nanoparticles induce oxidative stress in rat lung cells due to release of Zn2+.41 ZnO nanoparticles are generally classified as poorly water-soluble. These nanoparticles can lead to spontaneous generation of reactive oxygen species at their surface because of their chemical and surface characteristics. They can also lead to generation of free radicals after their interaction with cellular components, eg, mitochondrial damage. Another way by which reactive oxygen species are generated is through activation of nicotinamide adenine dinucleotide phosphate oxidase, which is the enzyme responsible for O2− production in the membrane of phagocytic cells. In the case of ZnO nanoparticles, generation of reactive oxygen species has been attributed to their semiconductor and nanolevel characteristics, which lead to generation of reactive oxygen species even in the absence of light. Moreover, the phenomenon of dissolution is expected to become more prominent in the case of nanoparticles because of its dependence on surface area.
In summary, our data demonstrate that ZnO nanoparticles have the potential to induce apoptosis in A375 cells and that this process is mediated through the caspase-3 pathway. The DNA damage, apoptosis, and increase in markers of oxidative stress observed raise concerns about safety when using ZnO nanoparticles in consumer products.
Acknowledgments
The authors extend their appreciation to the Deanship of Scientific Research at King Saud University for funding this work through research group project RGP-VPP-180.
Disclosure
The authors report no conflicts of interest in this work.
References
- SinghNManshianBJenkinsGJNano genotoxicology: the DNA damaging potential of engineered nanomaterialsBiomaterials2009303891391419427031
- BrunnerTJWickPManserPIn vitro cytotoxicity of oxide nanoparticles: comparison to asbestos, silica, and the effect of particle solubilityEnviron Sci Technol2006404374438116903273
- LanoneSRogerieuxFGeysJComparative toxicity of 24 manufactured nanoparticles in human alveolar epithelial and macrophage cell linesPart Fibre Toxicol200961419405955
- DengXLuanQChenWNanosized zinc oxide particles induce neural stem cell apoptosisNanotechnology20092011510119420431
- HanleyCLayneJPunnooseAPreferential killing of cancer cells and activated human T cells using ZnO nanoparticlesNanotechnology20081929510318836572
- ZhaoJXuLZhangTRenGYangZInfluences of nanoparticle zinc oxide on acutely isolated rat hippocampal CA3 pyramidal neuronsNeurotoxicology20093022023019146874
- GuoCWangAYSignificance of increased apoptosis and bax expression in human small intestinal adenocarcinomaJ Histochem Cytochem2009571139114819729672
- PatlollaAPatlollaBTchounwouPEvaluation of cell viability, DNA damage, and cell death in normal human dermal fibroblast cells induced by functionalized multi walled carbon nanotubeMol Cell Biochem201033822523220016928
- KangSJKimBMLeeYJChungHWTitanium dioxide nanoparticles trigger p53-mediated damage response in peripheral blood lymphocytesEnviron Mol Mutagen20084939940518418868
- ChoiJEKimSAhnJHInduction of oxidative stress and apoptosis by silver nanoparticles in the liver of adult zebra fishAquat Toxicol201010015115920060176
- SharmaVSinghSKAndersonDTobinDJDhawanAZinc oxide nanoparticle induced genotoxicity in primary human epidermal keratinocytesJ Nanosci Nanotechnol2011113782378821780369
- FarneboMBykovVNWimanKGThe p53 tumor suppressor: a masterregulator of diverse cellular processes and therapeutic target in cancerBiochem Biophys Res Commun2010396859920494116
- PremanathanMKarthikeyanKJeyasubramanianKManivannanGSelective toxicity of ZnO nanoparticles toward Gram positive bacteria and cancer cells by apoptosis through lipid peroxidationNanomedicine2011718419221034861
- MurdockRCBraydich-StolleLSchrandAMSchlagerJJHussainSMCharacterization of nanomaterial dispersion in solution prior to in vitro exposure using dynamic light scattering techniqueToxicol Sci200710123925317872897
- MossmanTRapid colorimetric assay for cellular growth and survival: application to proliferation and cytotoxicity assaysJ Immunol Methods19836555636606682
- WroblewskiFLaDueJSLactate dehydrogenase activity in bloodProc Soc Exp Biol Med19559021021313273400
- WangHJosephJAQuantifying cellular oxidative stress by dichlorofluorescein assay using microplate readerFree Radic Biol Med19992761261610490282
- BradfordMMA rapid and sensitive method for the quantitation of microgram quantities of protein utilizing the principle of protein-dye bindingAnal Biochem197672248254942051
- OhkawaHOhishiNYagiKAssay for lipid peroxides in animal tissues by thiobarbituric acid reactionAnal Biochem19799535135836810
- EllmanGTissue sulfhydryl groupsArch Biochem Biophys195982707713650640
- KakkarPSDasBViswanathanPNA modified spectrophotometricassay of superoxide dismutaseIndian J Biochem Biophys1984211301326490072
- SinhaAKColorimetric assay of catalaseAnal Biochem1972473893944556490
- Dhar-MascarenoMCarcamoJMGoldeDWHypoxia-reoxygenation-induced mitochondrial damage and apoptosis in human endothelial cells are inhibited by vitamin CFree Radic Biol Med2005381311132215855049
- SinghNPMcCoyMTTiceRRSchneiderELA simple technique for quantization of low levels of DNA damage in individual cellsExp Cell Res19881751841913345800
- AliDRayRSHansRKUVA-induced cyototoxicity and DNA damaging potential of Benz (e) acephenanthrylene in human skin cell lineToxicol Lett201019919320020832460
- AndersonDYuTWPhillipsBJSchmerzerPThe effect of various antioxidants and other modifying agents on oxygen-radical generated DNA damage inhuman lymphocytes in the comet assayMutat Res19943072612717513806
- MiaoAJZhangXYLuoZZinc oxide engineered nanoparticles: dissolution and toxicity to marine phytoplanktonEnviron Toxicol Chem2010292814282220931607
- DhawanASharmaVParmarDNanomaterials: a challenge for toxicologistsNanotoxicology2009319
- NairSSasidharanADivya RaniVRole of size scale of ZnO nanoparticles and micro particles on toxicity toward bacteria and osteoblast cancer cellsJ Mater Sci Mater Med20092023524118758917
- OstrovskySKazimirskyGGedankenABrodieCSelective cytotoxic effect of ZnO nanoparticles on glioma cellsNano Res20092882890
- BaiWZhangZTianWToxicity of zinc oxide nanoparticles to zebrafish embryo: a physicochemical study of toxicity mechanismJ Nanopart Res20091216451654
- MoosPJChungKWoessnerDHoneggarMCutlerNSVeranthJMZnO particulate matter requires cell contact for toxicity in human colon cancer cellsChem Res Toxicol20102373373920155942
- KilariSPullakhandamRNairKMZinc inhibits oxidative stress-induced iron signaling and apoptosis in Caco-2 cellsFree Radical Biol Med20104896196820096349
- SherrCJPrinciples of tumor suppressionCell20041123524614744434
- EastmanABarryMAThe origins of DNA breaks: a consequence of DNA damage, DNA repair or apoptosis?Cancer Invest1992102292401316202
- SpeitGHartmannAThe contribution of excision repairs to the DNA effects seen in the alkaline single cell gel test (comet assay)Mutagen199510555560
- NelAXiaTMadlerLLiNToxic potential of materials at the nano levelScience200631162262716456071
- XiaTKovochichMBrantJComparison of the abilities of ambient and manufactured nanoparticles to induce cellular toxicity according to an oxidative stress paradigmNano Lett200661794180716895376
- SrinivasulaSMFernandes-AlnemriTZangrilliJThe Ced-3/Interleukin 1 converting enzyme-like homolog Mch6 and the lamin-cleaving enzyme Mch2 are substrates for the apoptotic mediator CPP32J Biol Chem199627127099271068900201
- OttMGogvadzeVOrreniusSZhivotovskyBMitochondria, oxidative stress and cell deathApoptosis20071291392217453160
- FukuiHHorieMEndohSAssociation of zinc ion release and oxidative stress induced by intratracheal instillation of ZnO nanoparticles to rat lungChem Biol Interact2012198293722640810