Abstract
Background
This paper describes an environmentally friendly (“green”) approach for thesynthesis of soluble graphene using Bacillus marisflavi biomass as a reducing andstabilizing agent under mild conditions in aqueous solution. In addition, the study reported hereinvestigated the cytotoxicity effects of graphene oxide (GO) and bacterially reduced graphene oxide(B-rGO) on the inhibition of cell viability, reactive oxygen species (ROS) generation, and membraneintegrity in human breast cancer cells.
Methods
The reduction of GO was characterized by ultraviolet–visible spectroscopy. Sizedistribution was analyzed by dynamic light scattering. Further, X-ray diffraction andhigh-resolution scanning electron microscopy were used to investigate the crystallinity of grapheneand the morphologies of prepared graphene, respectively. The formation of defects further supportsthe bio-functionalization of graphene, as indicated in the Raman spectrum of B-rGO. Surfacemorphology and the thickness of the GO and B-rGO were analyzed using atomic force microscopy, whilethe biocompatibility of GO and B-rGO were investigated using WST-8 assays on MCF-7 cells. Finally,cellular toxicity was evaluated by ROS generation and membrane integrity assays.
Results
In this study, we demonstrated an environmentally friendly, cost-effective, and simple method forthe preparation of water-soluble graphene using bacterial biomass. This reduction method avoids theuse of toxic reagents such as hydrazine and hydrazine hydrate. The synthesized soluble graphene wasconfirmed using various analytical techniques. Our results suggest that both GO and B-rGO exhibittoxicity to MCF-7 cells in a dose-dependent manner, with a dose > 60 μg/mLexhibiting obvious cytotoxicity effects, such as decreasing cell viability, increasing ROSgeneration, and releasing of lactate dehydrogenase.
Conclusion
We developed a green and a simple approach to produce graphene using bacterial biomass as areducing and stabilizing agent. The proposed approach confers B-rGO with great potential for variousbiological and biomedical applications.
Introduction
Graphene, a carbon material with many potential applications due to its unique features, consistsof a single-layer sp2-hybridized carbon atom network that is also compacted in a perfect honeycomblattice.Citation1 This unique chemical structure givesgraphene excellent electrical, mechanical, and optical properties, thus attracting much commercialand academic research interest.Citation2 As such, manysynthetic strategies have been developed to make large quantities of high-quality graphene in acost-effective manner.Citation3 It was originally producedusing micromechanical cleavage,Citation4 but thelarge-scale production of graphene by this conventional method is rather difficult. Severalapproaches, including chemical vapor deposition, epitaxial growth, and chemical exfoliation havesince been developed for the high-yield synthesis of high-quality graphene.Citation5 The chemical methods have the advantage of large-scale production andare cost-effective, but are not compatible with large-scale synthesis in solution-processable formand require expensive high-temperature processes.Citation5–Citation7 Thus, chemical oxidation andreduction methods have been considered promising approaches for the synthesis of graphene fromgraphene oxide (GO).Citation8
The chemical oxidation and reduction methods involve two steps: first, the exfoliation ofgraphite by oxidative treatment, then the reduction of the resulting GO using a suitable reducingagent. The reduction of GO is generally achieved using either reducing agents – such ashydrazine or one of its derivatives, sodium borohydride, hydroquinone, or a sulfur compound– or by hydrothermal and solvothermal protocols.Citation9,Citation10 Most reducing agents are either toxicor explosive as well as difficult to handle for large-scale production. However, strong and toxicreduction agents and surfactants are essential to reduce GO fully in an aqueous phase.Citation11 To solve this problem, many researchers haveattempted to develop a new aqueous and environmentally friendly reduction strategy; these haveincluded methods involving bacterial respiration,Citation12 polyallylamine,Citation13 potassiumhydroxide,Citation14 polyvinylpyrrolidone,Citation15 ascorbic acid,Citation16 sugar,Citation17baker’s yeast,Citation18 melatonin,Citation19 and glucose.Citation20 Among the various nontoxic reduction agents, biomass has significantadvantages because proteins can be used as reducing agents for the synthesis of graphene. Recently,Escherichia coli biomass was used as a reducing agent for GO.Citation21
The toxicity of any fabricated nanomaterial is very important and because graphene-basednanomaterials are currently considered one of the most important nanomaterials for biomedicalapplications, several groups have recently investigated the toxicity and biocompatibility ofgraphene in relation to various cell types including bacteria. Akhavan and Ghaderi,Citation22 for example, reported the interaction of theextremely sharp edges of graphene sheets with the cell wall membrane of bacteria, and thecytotoxicity of graphene in neural pheochromocytoma-derived PC12 cells through the generation ofreactive oxygen species (ROS) by the graphene.Citation23Akhavan et alCitation24 demonstrated a possible mechanismfor the cytotoxicity of graphene sheets, in which the cells within the graphene sheets wereaggregated. Liu et alCitation25 proposed a membrane stresscaused by direct contact with sharp nanosheets and also reported that graphene-based papers caninhibit the growth of bacteria but with minimal cytotoxicity.Citation26 The cytotoxicity of graphene is also dose dependent.Citation23,Citation27In a systematic study carried out by Chang et al,Citation28 the authors determined that the loss of viability is dependent on size (Iarge-GO,medium-GO, and small-GO) and concentration of GO as well as the length of time cells are exposed tographene materials. Zhang et alCitation29 studied thedistribution and biocompatibility of GO in mice and found that GO was predominantly deposited in thelungs, where it was retained for a long time. Compared with other carbon nanomaterials, GO exhibiteda long blood circulation time and low uptake in the reticuloendothelial system. Recently, Akhavan etalCitation30 demonstrated the size-dependent cyto andgenotoxic effects of the Reduced graphene oxide nanoplatelets (rGONPs) on human mesenchymal stemcells.
Thus, as many of the currently available methods for producing graphene are not environmentallyfriendly, complicated, and require additional steps in the preparation process that restrict theirapplications in biological and biomedical fields,Citation31 we developed a novel, cost-effective, simple, environmentally friendly approach toproduce water-soluble graphene. Further, we examined the toxicity of the biologically reducedgraphene oxide (B-rGO) in MCF-7 cells.
Methods and materials
Chemicals and bacteria
Graphite powder was purchased from Sigma-Alrich (St Louis, MO, USA). Analytical-grade NaOH,KMnO4, N,N-Dimethylacetamide, anhydrous ethanol, 98%H2SO4, 36% HCl, and 30% H2O2 aqueoussolution were purchased from Sigma-Alrich and used directly without further purification. Allaqueous solutions were prepared with deionized water. All other chemicals were also purchased fromSigma-Aldrich unless stated otherwise. Bacillus marisflavi GS3 (GenBank accessionnumber, KC KC008578) was obtained from the GS Center for Life Sciences, Coimbatore, India.
Preparation of biomass
Media preparation and growth of bacteria were undertaken according to the methods described byGurunathan et al.Citation32 In brief, the pre-culture (10mL of medium in a 50 mL flask) was inoculated with a single colony of B. marisflaviin nutrient broth medium and incubated on a rotary shaker at 37°C for 12 hours. The secondpre-cultures were inoculated with the first pre-culture (1% v/v) and incubated on a rotaryshaker at 37°C for 12 hours in 150 mL of batch medium in 500 mL shake flasks. Cells (200 mg)were harvested by centrifugation and resuspended in 20 mL of water. The biomass obtained was thricewashed with phosphate buffer (pH 7.0) then collected and stored in a 50 mL tube until required foruse in synthesis of reduced graphene.
GO synthesis
GO was prepared from graphite powder using a modified version of Hummers and Offeman’smethod.Citation33,Citation34 Graphite powder (2 g) was mixed with 80 mLH2SO4 and 20 mL HNO3 in an ice bath. KMnO4 12 g) wasslowly added to the mixture. The solution was heated at 35°C for 30 minutes, then dilutedwith 160 mL of 18 MΩ water. After 1 hour, the solution was further diluted by adding anadditional 400 mL of 18 MΩ water, followed by the slow addition of 12 mL ofH2O2 (30% v/v). After these steps, the original black graphitesuspension had been converted into a bright yellow graphite oxide solution. The precipitate ofgraphite oxide was isolated by centrifugation at 3000 rpm/minutes for 15 minutes then washed with,and resuspended in, 18 MΩ water. The aqueous graphite oxide solution was then sonicated for2 hours to facilitate the exfoliation of stacked graphite oxide sheets into monolayer ormulti-layered GO sheets. The as-prepared GO yellow-brown solution (mg/mL) was used for furtherexperiments.
Synthesis of rGO
Synthesis of rGO was carried out according to the method described previously.Citation21 Briefly, bacteria were grown in a 500 mL Erlenmeyerflask containing lysogeny broth. The flasks were incubated for 21 hours in a shaker set at 120 rpmand 37°C. After the incubation period, the culture was centrifuged at 10,000 rpm and theresultant biomass used for the synthesis of rGO. In a typical reduction experiment, 200 mg ofB. marisflavi biomass was added to the GO dispersion (0.5 mg/mL) and the mixturestirred at 37°C for 72 hours. Following this, the stable black dispersion was centrifuged toremove excess bacteria as a supernatant liquid. The obtained black dispersion was designated“B-rGO” and used for further characterization.
Characterization
Ultraviolet–visible (UV–vis) spectra of the aqueous suspensions of GO and B-rGOwere obtained using a WPA Biowave II UV/Visible Spectrophotometer (Biochrom, Cambridge, UK). X-raydiffraction (XRD) analyses were carried out on a D8 Discover X-ray diffractometer (Bruker,Karlsruhe, Germany). The high-resolution XRD patterns were measured at 3 Kw with a copper targetusing a scintillation counter (λ = 1.5406°A) at 40 kV and 40 mA wererecorded in the range of 2θ = 5°–80°. A JSM-6700Fsemi-in-lens field emission scanning electron microscope (JEOL, Tokyo, Japan) operating at 10 kV wasused to acquire scanning electron microscopy (SEM) images. The solid samples were transferred to acarbon tape held into an SEM sample holder for analyses. Analyses of the samples were carried out atan average working distance of 6 mm. Raman spectroscopy analyses were performed using a confocalmicro-Raman LabRAM HR high-resolution Raman microscope (WITec, WITec Instruments Corp., TN, USA) inbackscattering geometry with a charge-coupled device detector, and a 532 nm argon laser. Thecalibration was initially made using an internal silicon reference at 520 cm−1and gave a peak position resolution of <1 cm−1. The spectra were measuredfrom 500 to 4500 cm−1. All samples were deposited on silicon wafers in powderform without using any solvent. Surface images were measured using tapping-mode atomic forcemicroscopy (AFM) (SPA 400, Seiko Instruments, Chiba, Japan) operating at room temperature. Heightand phase images were recorded simultaneously using nanoprobe cantilevers (SI-DF20, SeikoInstruments).
Cell culture
The MCF-7 human breast cancer cell line was kindly provided by Prof Ssang-Goo, Department ofAnimal Biotechnology, Konkuk University, Seoul, South Korea. Cells were cultured in Roswell ParkMemorial Institute (RPMI) 1640 medium supplemented with 10% heat inactivated fetal calfserum, 10 mmol/L glutamine, and 50 μg/mL each of streptomycin and penicillin. Cells weregrown to confluence at 37°C in a 5% CO2 atmosphere. GO and B-rGOsuspensions were freshly prepared before exposure to cells, diluted to appropriate concentrationsfrom 20 to 100 μg/mL with the culture medium, then immediately applied to the cells. Cellsnot treated with GO or B-rGO served as controls in each experiment.
WST-cell viability assay
WST-8 assay (water-soluble tetrazolium salt) was undertaken as described by Liao et al.Citation27 Briefly, 1 × 10⁴ cells were seededin a 96-well plate and cultured in RPMI 1640 supplemented with 10% serum at 37°Cunder 5% CO2. After 24 hours, the cells were washed twice with 100 μL ofserum-free medium then incubated with 100 μL of different concentrations of GO and B-rGOsuspensions in serum-free minimal essential medium. After 24 hours’ exposure, the cells werewashed twice with serum-free medium and 15 μL of Cell Counting Kit-8 solution was added toeach well containing 100 μL of serum-free minimal essential medium. After 1 hour ofincubation at 37°C under 5% CO2, 80 μL of the mixture wastransferred to another 96-well plate, because residual GO and B-rGO can affect the absorbance valuesat 450 nm. The absorbance of the mixture solutions was measured at 450 nm, using a microplatereader.
Cell-free control experiments were performed to determine whether the synthesized GO and B-rGOwould react directly with the WST-8 reagents. Briefly, 100 μL of GO and B-rGO suspensionswith different concentrations (20–100 μg/mL) were added to a 96-well plate and 10μL of WST-8 reagent solution was added to each well; the mixture solution was incubated at37°C under 5% CO2 for 1 hour. After incubation, the GO and B-rGO werecentrifuged and 50 μL of the resulting supernatant was transferred to another 96-well plate.The optical density was measured at 450 nm.
Determination of ROS
Intracellular ROS were measured based on the intracellular peroxide-dependent oxidation of2′,7′-dichlorodi-hydrofluorescein diacetate (Invitrogen, Carlsbad, CA, USA) to formthe fluorescent compound 2′,7′-dichlorofluorescein, as previously described.Citation35 Cells were seeded onto 24-well plates at a density of5 × 104 cells per well and cultured for 24 hours. After washing twice withphosphate-buffered saline (PBS), fresh medium containing different concentrations of GO or B-rGO wasadded and the cells incubated for another 24 hours. Following this, 20 μM of2′,7′-dichlorodihydrofluorescein diacetate was added to the cells and incubationcontinued for 30 minutes at 37°C. Finally, the cells were rinsed with PBS, 2 mL of PBS wasadded to each well, and fluorescence intensity was determined with a Gemini™ EM microplatespectrofluorometer (Molecular Devices, Sunnyvale, CA, USA) with excitation at 485 nm and emission at530 nm.
Membrane integrity
The cell membrane integrity of MCF-7 cells was evaluated by determining the activity of lactatedehydrogenase (LDH) leaking out of the cells using an in vitro toxicology assay kit (TOX7,Sigma-Aldrich) according to the manufacturer’s instructions. The LDH assay is based on therelease of the cytosolic enzyme, LDH, from cells with damaged cellular membranes. Thus, in cellculture, the course of GO- and B-rGO-induced cytotoxicity was followed quantitatively by measuringthe activity of LDH in the supernatant. Briefly, cells were exposed to various concentrations of GOand B-rGO for 24 hours then 100 μL per well of each cell-free supernatant was transferred intriplicate into wells in a 96-well plate, and 100 μL of LDH-assay reaction mixture was addedto each well. After 3 hours’ incubation under standard conditions, the optical density ofthe color generated was determined at a wavelength of 490 nm using a microplate reader.
Cell mortality assay
The cell mortality was evaluated using trypan blue assay as described by Chang et al.Citation28 MCF-7 cells were plated in 6-well plates (1 ×10⁵ cells per well) and incubated for 24 hours. Then, GO or B-rGO was introduced to cellsat different concentrations (20, 40, 60, 80, and 100 μg/mL) in culture medium. Cellscultured in the free medium were taken as the control. After 24 hours, the supernatant was collectedand the cells detached with 300 μL trypsin-ethylenediaminetetraacetic acid (EDTA) solution.The supernatant-detached cell mixture was centrifuged at 1200 rpm/minutes for 5 minutes. The residuewas then added to a 700 μL trypan blue solution and dispersed. After 5 minutes staining,cells were counted using a cytometer. The dead cells were stained with blue color. Cell mortality(%) was expressed as percentage of the dead cell number/the total cell number.
Results and discussion
Characterization of GO and B-rGO by UV–vis spectroscopy
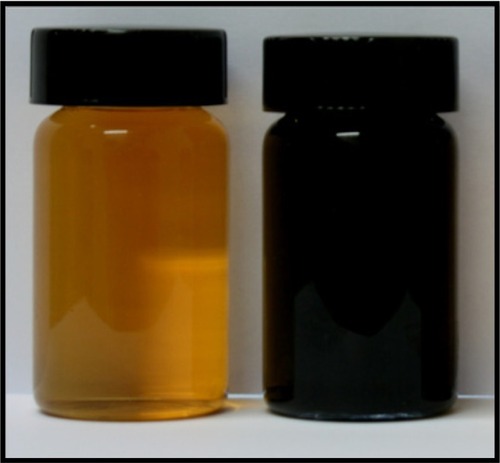
shows the GO and B-rGO that wereproduced using the modified method of Hummers and Offeman.Citation33 To briefly reiterate, the graphite powder was first oxidized into graphite oxide usingKMnO4/H2SO4, then the graphite oxide was exfoliated into GO sheetsby ultra-sonication in water. In a typical reduction experiment, 200 mg of bacterial biomass wasadded to the GO dispersion, and the mixture was stirred at 37°C for 72 hours. GO nanosheetswere exfoliated from the graphite oxide, resulting in a clear, homogeneous, yellow-brown GOdispersion (pictured at left in ) and rGOnanosheets were obtained from the reduction of GO by bacterial biomass (pictured at right in ). This indicated that bacterial biomass played animportant role in the reduction of GO to graphene. The obtained GO and B-rGO were highly soluble inwater. They appeared different because of their distinct structural and physicochemicalproperties.Citation36 The reduction of GO was alsoindicated by the color change of the solution before and after reaction (from yellow-brown toblack), as shown in . This can be attributedto the large amount of hydrophilic functional groups, such as carboxyl, hydroxyl, and epoxy groups,on the GO nanosheets.Citation4 After the visibility check,we examined the water dispersibility of GO and B-rGO using UV–vis spectra analysis.
Figure 1 Photograph of graphene oxide (left) and bacterially reduced graphene oxide (right) at aconcentration of 500 μg/mL.
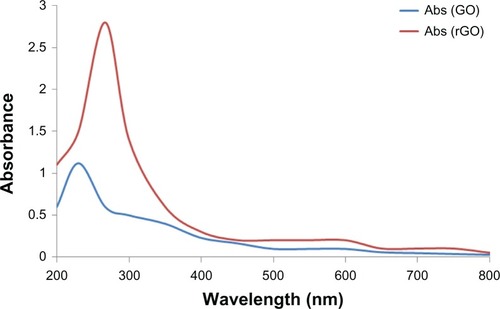
The optical absorption spectra of the GO and B-rGO suspensions are shown in . After the reduction of GO by bacterial biomass, the color ofthe GO suspension changed from yellow-brown to black. The black color of the rGO suspensionsindicates the restoration of the π network between the sheets due to the removal of theoxygen-containing bonds resulting in electronic conjugation within the reduced sheets.Citation37 The optical absorption spectra also show that theabsorption peaks of the GO suspension is around 230 nm, while the absorption peak of the reducedsuspensions shift into wavelengths of around 267 nm, corresponding to deoxygenation of the GOsuspension under the reduction processes. It shows that the GO might be reduced, the aromaticstructure restored, and the reduction improved. Similar features and trends have been observed forthe reduction of GO with L-ascorbic acidCitation37 andL-cysteine,Citation38 baker’s yeast,Citation18 and E. coli.Citation21 Fernández-Merino et alCitation37 suggested that the maximum red-shift value can be used as a standardto estimate the performance of the reducing agent.
Figure 2 Ultraviolet–visible absorption spectra of graphene oxide (GO) and the reduced grapheneoxide (rGO) suspension reduced by bacterial biomass (50 μg/mL).
Abbreviation: Abs, absorption spectrum.
XRD analysis
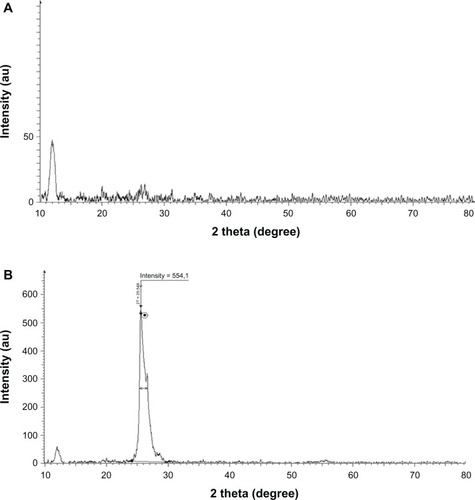
We further characterized the crystal structure of the rGO by XRD. Pristine graphite exhibits abasal reflection (002) peak at 2θ = 25.6° (d-spacing = 0.35nm).Citation25 Compared with pristine graphite, thediffraction peak of exfoliated GO appears at the lower angle (2θ = 11.7°,d-spacing = 0.76 nm) (). Theincrease in d-spacing is due to the intercalation of water molecules and the formation ofoxygen-containing functional groups between the layers of the graphite.Citation3 As shown in ,the XRD pattern of B-rGO appeared as a broad band between 2θ = 24° and2θ = 29° and crystalline peak centered at 2θ = 25.5°() corresponding to the interlayer spacingof 0.35 nm, which is significantly different from pristine graphite. The disappearance of the 002reflection peak of GO and appearance of a broad band at 2θ = 25.5° withB-rGO indicated the significant reduction of GO and formation of graphene of fewer layers.Citation8,Citation39–Citation41
Figure 3 X-ray diffraction patterns of (A) graphene oxide and (B) bacteriallyreduced graphene oxide.
Note: The arrow indicates the position of crystalline peak of reduced grapheneoxide. The dot represent the intensity value of peak.
Size analysis by dynamic light scattering (DLS)
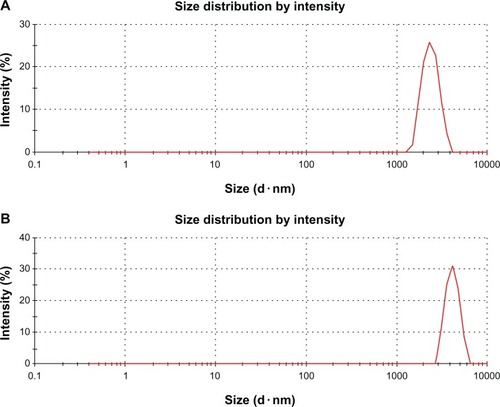
DLS measurement was performed in aqueous solution to elucidate the size of GO and rGO. It wasfound that the average size of GO layer was 1970 nm (). However, after the reduction of GO with biomass, an average size of 3833 nm was obtainedunder the same instrumental conditions ().This obvious change in size distribution indicated that the biomass not only acted as a reducingagent to prepare the rGO but was also functionalized on the surface of the resulting rGO, leading toan increased Brownian motion rate after the reduction process. Wang et alCitation42 observed that after the reduction of GO with heparin, the averagesize of rGO layers was larger than that of GO. The rGO particles were formed by reducing GOnanosheets, which are about twice as large as GO nanosheets because of the aggregation of B-rGOfragments.Citation25 However, DLS results only show thesize differences between GO and B-rGO layers.Citation25 Toconfirm the actual sizes, the dispersions were dropped on aluminum foil and dozens of SEM imagestaken randomly for each sample (see the next section).
Figure 4 Hydrodynamic size distribution of (A) graphene oxide and (B)bacterially reduced graphene oxide (500 μg/mL) measured by dynamic light scattering at roomtemperature in deionized water.
SEM analysis
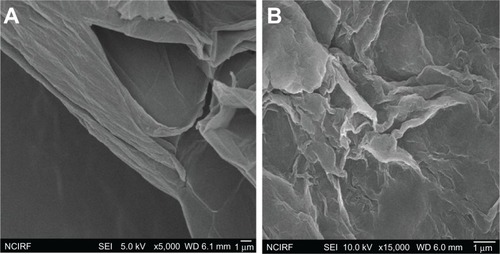
As just mentioned, to examine the size of GO and B-rGO layers further, we used SEM analysis. Thedispersions were dropped on aluminum foil and SEM images were taken randomly of each sample. shows SEM images of GO flakes and layers,revealing them to have a wavy, folded shape and to be in thin layers. The SEM images also revealedthat the rGO material consists of individual sheets closely associated with each other (). Our results suggest that thin layers ofnanosheets formed the GO dispersion, while the B-rGO dispersion was mainly comprised of larger,aggregated forms. Images of the rGO reveal that it consisted of several layers stacked on top of oneanother like silky sheets of paper ().
Figure 5 Scanning electron microscopy images of (A) graphene oxide and (B)bacterially reduced graphene oxide.
Raman spectral analysis
Raman spectroscopy analysis was carried out for both GO and B-rGO. Raman spectroscopy is highlysensitive to the electronic structure of a substance and has proven to be an essential tool for thecharacterization of carbon-based materials, especially C═C double bonds, which lead to highRaman intensities.Citation42 The common characteristics ofcarbon materials in Raman spectra are the G line (1580 cm−1) related to thefirst-order scattering of the E2g phonons of sp2 carbon atoms and the D line(1350 cm−1) as a breathing mode of κ-point phonons of A1gsymmetry which is assigned to structural imperfections induced by the attachment of hyrodxyl and/orepoxide groups on the carbon surface.Citation19 Ourresults show that the G- and D-bands of GO appear at 1587 cm−1 and 1343cm−1, respectively ().Thus, the Raman spectrum of GO, as expected, displays a prominent G-peak (the E2g mode ofsp2 carbon atoms) as the characteristic feature at 1587 cm−1. TheRaman spectra further support the structural change before and after the reduction of GO bybacterial biomass. In the Raman spectrum of GO after reduction by bacterial biomass (ie, for theB-rGO), the G-band is broadened and shifted to around 1608 cm−1 and the D-band at1395 cm−1 becomes prominent, indicating the reduction in size of the in-planesp2 domains due to the extensive oxidation as a result of the bacterial biomass (). Interestingly, the Raman spectrum of GO afterreduction by bacterial biomass shows a higher D-/G-band intensity ratio than GO (1.4). In comparisonto purified GO, the ID/IG ratio of the B-rGO is significantlyincreased (1.7), indicating the introduction of sp3 defects after functionalization andincomplete recovery of the structure of graphene.Citation43 The variation in the relative intensities of the G- and D-bands in the Raman spectra ofthe GO during the reduction reveal the change of the electronic conjugation state. This changesuggests that there was an increase in the number of sp2 domains with the reduction ofGO.Citation4,Citation44
Figure 6 Raman spectra of (A) graphene oxide and (B) bacterially reducedgraphene oxide.
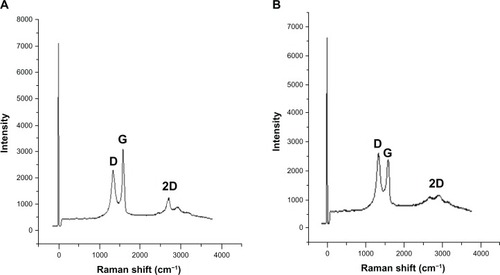
Our Raman spectroscopy analysis results are in good agreement with two previous studiesCitation45,Citation46in which sulfur containing an amino acid (L-cysteine) was used to reduce GO into GO nanosheets andanother study that developed a green and simple approach to the synthesis of graphene nanosheetsusing reducing sugars.Citation16 In another study,reducing using wild carrot root caused the G-band of GO to broaden and shift to 1593cm−1, while the D-band shifted to a lower region (1346 cm−1)and became more prominent, indicating the destruction of sp2 domains and the formation ofdefects in the sheets due to extensive oxidation.Citation33 When baker’s yeast was used as a reducing agent, the D-band shift indicatedsuccessful functionalization of rGO.Citation18 Thus, ourobservation is in good agreement with previous studies and supports the formation of functionalizedgraphene.
Further, to examine the quality of the synthesized graphene, we used Raman spectroscopy, which isa good choice for the nondestructive and quick inspection of a number of layers of graphene.Citation47 Raman spectra of graphene-based materials have a 2Dband that is sensitive to the stacking of graphene sheets.Citation47 The characteristic shape and position of these 2D bands can be used to accuratelydifferentiate single and bilayer graphene from multilayer graphene.Citation47 In our experiment, we observed a significant feature and intensity of2D bands located at 2600–3000 cm−1 in the Raman spectrum. As shown in, the 2D band of B-rGO is centered at about2672 cm−1, with a low-intensity shoulder at higher wave numbers, while weanalyzed the peak intensity ratio between 2D and G-bands to be 2.1. These results suggest that thesynthesized graphene probably had a monolayer form.
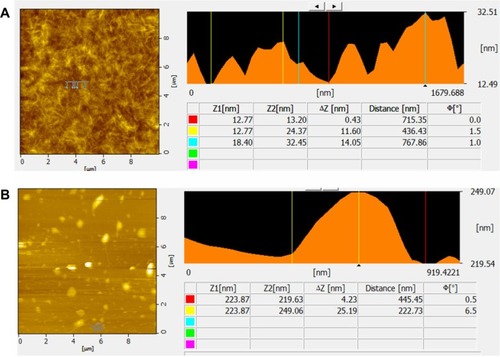
AFM analysis of GO and B-rGO
AFM images were used to characterize the surface morphology and thickness of the GO and B-rGOnanosheets. As shown in , therepresentative AFM image and cross-section analysis of GO clearly exhibit flat sheets with somewrinkles and an average thickness of about 0.43 nm, indicating the formation of single-layered GOnanosheets. Compared with GO, the B-rGO was thicker at ∼4.23 nm, demonstrating that thebiomass adhered and reduced the GO surface successfully (). Gao et alCitation48 showed thatL-tryptophan stabilized graphene sheets, which have an average thickness of ∼2.0 nm. Khanraet alCitation18 reported that the average thickness ofyeast reduced graphene oxide (YR-GO) was 1.2 nm, which is slightly greater than that of puregraphene. The greater thickness of YR-GO may be due to adsorption of nicotinamide adeninedinucleotide phosphate on the surface of graphene and/or the formation of bilayer functionalizedgraphene. Zhu et alCitation17 observed thatglucose-reduced graphene was thicker than exfoliated GO sheets due to the capping reagent used,which played an important role in increasing the thickness of the graphene. Similarly, Wang etalCitation49 also reported that tea polyphenol producedgraphene of increased thickness. Thus, the results of previous reports and the study presented hereconfirm that biomolecules play an important role in reduction and also in increasing the thicknessof graphene. In turn, the increased thickness indicates that most of the oxygen-containingfunctional groups were removed after reduction.
Figure 7 Atomic force microscopy images of (A) graphene oxide and (B)bacterially reduced graphene oxide.
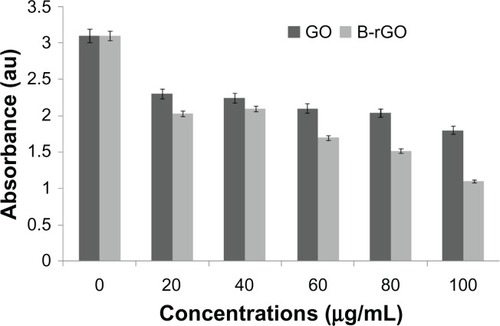
Effect of GO and B-rGO on the viability of MCF-7 cells
The evaluation of the biocompatibility of graphene materials is an important factor in biologicaland bio-medical applications, such as drug delivery and gene transfection. In our study, thecytotoxicity of GO and B-rGO was evaluated in MCF-7 cells. It has been found that3-(4,5-Dimethylthiazol-2-yl)-2,5-diphenyltetrazolium bromide (MTT) assay is inappropriate forcytotoxicity tests of graphene materials, since the graphene reacts with the MTT reagent and formspurple formazan, leading to a false-positive result and overestimated cell viability.Citation27 Thus, to obtain a precise toxic evaluation of GO andB-rGO, we employed the WST-8 assay, which does not react with GO or B-rGO, to measure thecytotoxicity of these two substances.
As already described in the “Methods and materials section,” MCF-7 cells wereincubated with GO and B-rGO for 24 hours, then the dose-dependent cytotoxicity was observed. Asshown in , both substances weresignificantly toxic, but there was an obvious decrease in cell viability with B-rGO of as much as64.0% ± 2.0% when the concentrations were in the range of 100 μg/mL.Li et alCitation50 demonstrated that pristine graphene caninduce cytotoxicity by inducing depletion of the mitochondrial membrane potential, increasinggeneration of intracellular ROS, and subsequently triggering apoptosis by activating themitochondrial pathway.
Figure 8 The effect of graphene oxide (GO) and bacterially reduced graphene oxide (B-rGO) on cellviability of MCF-7 cells.
Notes: The cell viability of MCF-7 cells was determined by WST-8 assay after 24hours of exposure to different concentrations of GO or B-rGO. The results represent the means ofthree separate experiments and error bars represent the standard error of the mean. Treated groupsshowed statistically significant differences from the control group, as determined usingStudent’s t-test (P < 0.05).
ROS generation
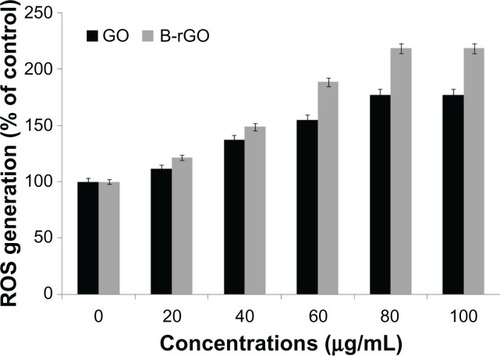
Nanoparticles can cause cell cytotoxicity by inducing the dysfunction of mitochondriaCitation51,Citation52and initiating the consequent accumulation of intracellular ROS. An increased level of ROSgeneration can be observed when cells are exposed to nanomaterials. Accumulation of intracellularROS is the main characteristic of oxidative stress, so the detection of ROS generation reflects theintracellular oxidative stress status, which is an important indicator of cellular health.Citation51 As we were interested to see the effect of GO andB-rGO on MCF-7 cells, we measured the intracellular ROS level in MCF-7 cells after incubation withGO and B-rGO for 24 hours. shows that GOand B-rGO exposure induced intracellular ROS generation in a dose-dependent manner, with the highestROS level found in MCF-7 cells exposed to a 100 μg/mL dose of B-rGO for 24 hours. The levelof ROS production was significantly higher in B-rGO-treated cells than in GO-treated cells. Onereason for this could be the functionalization of GO by the biomass. Li et alCitation50 showed that pristine graphene exposure induced intracellular ROSgeneration in a time- and dose-dependent manner. Chang et alCitation28 explained that loss of viability was dependent on the size (large-GO,medium-GO, and small-GO) and concentration of the GO as well as the length of time the cells wereexposed to graphene materials. The large surface areas of graphene-family nanosheets make surfacereactions potentially important, including ROS production, antioxidant deactivation,Citation53 and ROS quenching.Citation54 However, the action of a graphene material is based on the number oflayers it has, its lateral dimensions, and its surface chemistry as well as its surface area.Akhavan et alCitation30 demonstrated the size- andconcentration-dependent cyto- and genotoxicity of GO sheets and nanoplatelets in human mesenchymalstem cells.
Figure 9 Generation of reactive oxygen species (ROS) in graphene oxide (GO)-and bacterially reducedgraphene oxide (B-rGO)-treated MCF-7 cells.
Notes: The relative fluorescence of 2′,7′-dichlorofluorescein wasmeasured using a spectrofluorometer with excitation at 485 nm and emission at 530 nm. The resultsrepresent the means of three separate experiments and the error bars represent the standard error ofthe mean. Treated groups showed statistically significant differences from the control group, asdetermined by Student’s t-test (P < 0.05).
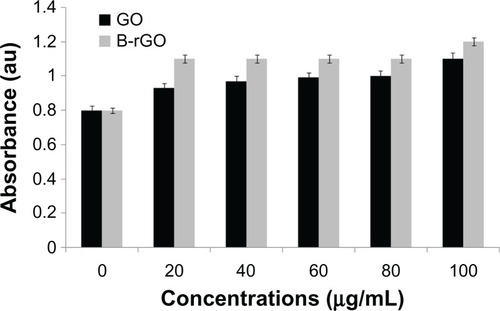
Impact of GO and B-rGO on membrane integrity
LDH is a soluble cytosolic enzyme that is released into the extracellular medium as a result ofmembrane damage; this consequently leads to apoptosis. It is widely accepted as an indicator oflytic cell death. Several studies have shown that nanomaterials can induce apoptosis ornecrosis.Citation51,Citation55 LDH release measures membrane damage, a hallmark of necrosis. Toinvestigate the impact of GO and B-rGO on membrane integrity, the cells were treated with variousconcentrations of GO and B-rGO for 24 hours and then the extracellular LDH activity was measured.The results suggest that cell membrane integrity in MCF-7 cells was compromised by GO and B-rGO at aconcentration of 100 μg/mL in a dose-dependent manner (). LDH activity was slightly increased in comparison to thecontrol cells. The data obtained reveal that MCF-7 cells were sensitive to the GO and B-rGOtreatment. In the LDH assay, increasing the concentration of the GO and B-rGO led to a higherabsorbance reading, which indicates that the membrane integrity was compromised. Further, cellularcontents were found in the media. Chang et alCitation28demonstrated that the LDH levels of GO-treated cells were slightly lower than those of their controlcells.
Figure 10 The effect of graphene oxide (GO) and bacterially reduced graphene oxide (B-rGO) on lactatedehydrogenase (LDH) activity in MCF-7 cells.
Notes: LDH activity was measured by changes in optical densities due to nicotinamideadenine dinucleotide reduction, monitored at 490 nm, as described in “Materials andmethods,” using a cytotoxicity detection lactate dehydrogenase kit. The results representthe means of three separate experiments and the error bars represent the standard error of the mean.Treated groups showed statistically significant differences from the control group, as determined byStudent’s t-test (P < 0.05).
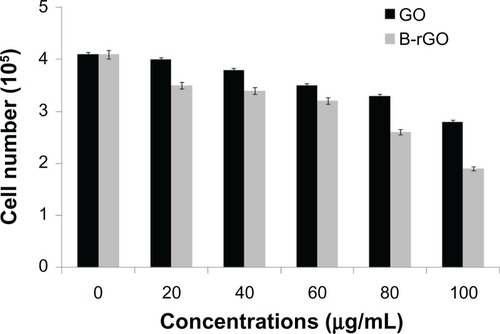
Cell mortality
In general, while viability assays show the activity of cell mitochondria, the mortality analysisindicates cell death.Citation28 In the study reportedhere, cell mortality was monitored by trypan blue exclusion assay, in which dead cells are stainedin blue while the live ones remain unchanged. Mortality is expressed by the ratio of dead cells intotal cells. The cells treated with GO and B-rGO showed significant cell death when compared withuntreated cells ().
Figure 11 The effect of graphene oxide (GO) and bacterially reduced graphene oxide (B-rGO) on the mortalityof MCF-7 cells.
Notes: The mortality of MCF-7 cells was determined using trypan blue assay after 24hours of exposure to different concentrations of GO or B-rGO. The results represent the means ofthree separate experiments and the error bars represent the standard error of the mean. Treatedgroups showed statistically significant differences from the control group, as determined byStudent’s t-test (P < 0.05).
Cheng et alCitation31 observed that biopolymerfunctionalized rGO exhibits an ultralow hemolysis ratio and good compatibility in human umbilicalvein endothelial cells, even at a high concentration of 100 μg/mL. Heparin-functionalizedrGO has been shown to have good stability in aqueous solution, owing to the strong electrostatic andsteric repulsions of the heparin, which adsorb on the surfaces of rGO sheets.Citation42 Moreover, rGO has been shown to exhibit excellent biocompatibilityand anticoagulant activity.Citation42 Hu et alCitation56 observed that human alveolar basal epithelial cells(A549) were sensitive to the presence of GO and showed concentration-dependent cytotoxicity.Further, graphene has been shown to induce cytotoxic effects and mitochondrial injury in humanneuronal cells after 4 and 24 hours in a dose- and shape-dependent manner.Citation57 Ruiz et alCitation58studied the effect of GO film on the attachment and proliferation of mammalian colorectaladenocarcinoma HT-29 cells and suggested that the mammalian cells attached more efficiently to theGO films, without showing significant toxicity. Similarly, Li et alCitation59 reported the good biocompatibility of graphene films with mouseneuronal cells. Akhavan et alCitation20 compared theefficiency of glucose- and hydrazine-reduced graphene for photothermal therapy for cancer cells.They found that the GO suspension reduced and functionalized by glucose in the presence of an ironcatalyst had a biocompatible property, with an excellent near infrared photothermal therapyefficiency that was better than that of the hydrazine-rGO single- and multiwall carbon nanotubesuspensions; these hydrazine-rGO suspensions showed some level of toxicity. Cheng et alCitation31 demonstrated dose-dependent cytotoxicity in humanumbilical vein endothelial cells with GO. They observed no toxicity in biopolymer functionalizedrGO, but a higher level of cytotoxicity was seen when the cells were treated with hydrazine-reducedrGO.
Recently, our g roup also studied the effect of microbially reduced GO and hydrazine-reduced GOon mouse embryonic fibroblast cells. The results of that study suggest that microbially reduced GOhas significant biocompatibility while hydrazine-reduced GO is highly toxic, indicating that themolecules used for the functionalization of GO and the type of cells influencebiocompatibility.Citation20
Although the mechanism responsible for graphene and GO toxicity has been reported on, noconclusions have been reached that are sufficient for risk assessment or regulation.Citation60 Some studies have proposed that oxidative stress isone of the mechanisms involved in the cytotoxic effects of various nanomaterials such as carbonones.Citation23,Citation28,Citation61,Citation62 Other studies have suggested that the cytotoxicity of graphenenanomaterials is due to the damaging of cell membranes through physical interaction withgraphene’s extremely sharp edges.Citation22,Citation26 Tazawa et alCitation63 demonstrated that bacterial cells treated with GO and rGO lostmembrane integrity. Liu et alCitation25 proposed themechanism of toxicity includes initial cell deposition on graphene-based materials and membranestress caused by direct contact with sharp nanosheets. Our previous studies demonstrated thatgraphene nanomaterials interact with cells, eventually inducing toxicity. Both GO and B-rGO inducecytotoxic effects, and these effects are concentration dependent. Finally, toxicity also depends onthe physicochemical properties of graphene-based materials, such as density of functional groups,size, conductivity, and the type of reducing agent used for deoxygenation of GO as well as on thecell types exposed to the materials.
Conclusion
This work demonstrates the synthesis of water-soluble graphene through reduction of GO usingbacterial biomass. The reduction was carried out in aqueous medium at 37°C under mildconditions without toxic substances. The reduction of GO was confirmed by UV–visspectroscopy, XRD, SEM, Raman spectroscopy and AFM. This technique has several advantages overtraditional chemical reduction: it is cost-effective, environmentally friendly, a simple approach,and an easy process for large-scale production. Our results indicate that rGO can be proposed as oneof the promising nanomaterials for application in effective nanotherapy of cancer cells. Moreover,the as-prepared rGO might satisfy various biomedical applications. Thus, the proposed methodprovides a novel and promising approach for the study of the biological and biomedical applicationsof graphene.
This paper was supported by the SMART-Research Professor Program of Konkuk University. DrSangiliyandi Gurunathan was supported by the Konkuk University SMART-Full Time Professorship. Thiswork was supported by the Woo Jang Choon Project (PJ007849) and the next generation of Biogreen 21(PJ009107) from the Rural Development Administration, South Korea.
Disclosure
The authors report no conflicts of interest in this work.
References
- LohKPBaoQG.EdaGChhowallaMGraphene oxide as a chemically tunable platform for opticalapplicationsNatChem20102121015102421107364
- GeimKANovoselovKSThe rise of grapheneNatMater20076318319117330084
- DreyerDRParkSBielawskiCWRuoffRSThe chemistry of graphene oxideChem SocRev201039122824020023850
- NovoselovKSGeimAKMorozovSVElectric field effect in atomically thin carbonfilmsScience2004306569666666915499015
- StankovichSDikinDAPinerRDSynthesis of graphene-based nanosheets via chemical reduction ofexfoliated graphiteoxideCarbon20074515581565
- BergerCSongZLiXElectronic confinement and coherence in patterned epitaxialgrapheneScience200631257771191119616614173
- KimKSZhaoYJangHLarge-scale pattern growth of graphene films for stretchabletransparentelectrodesNature2009457723070671019145232
- LiDMüllerMBGiljeSKanerRBWallaceGGProcessable aqueous dispersions of graphenenanosheetsNatNanotechnol20083210110518654470
- TungVCAllenMJYangYKanerRBHigh-throughput solution processing of large-scalegrapheneNatNanotechol2009412529
- DubinSGiljeSWangKA one-step, solvothermal reduction method for producing reducedgraphene oxide dispersions in organic solventsACSNano2010473845385220586422
- ZhouXLiuZA scalable, solution-phase processing route to graphene oxide andgraphene ultralarge sheetsChem Commun(Camb)201046152611261320449324
- SalasECSunZLüttgeATourJMReduction of graphene oxide via bacterialrespirationACSNano2010484852485620731460
- MinKHanTHKimJJungCHongSMKooCMA facile route to fabricate stable reduced graphene oxide dispersionsin various media and their transparent conductive thin filmsJ. ColloidInterfaceSci20123831364222795947
- FanXPengWLiYDeoxygenation of exfoliated graphite oxide under alkaline conditions:a green route to graphene preparationAdvMater2008202344904493
- TangLALeeWCShiHHighly wrinkled cross-linked graphene oxide membranes for biologicaland charge-storageapplicationsSmall20128342343122162356
- ZhangJYangHShenGChengPZhangJGuoSReduction of graphene oxide via L-ascorbicacidChem Commun(Camb)20104671112111420126730
- ZhuCGuoSFangYDongSReducing sugar: new functional molecules for the green synthesis ofgraphene nanosheetsACSNano2010442429243720359169
- KhanraPKuilaTKimNHBaeSHYuDSLeeJHSimultaneous bio-functionalization and reduction of graphene oxide bybaker’s yeastChem EngJ2012183526533
- EsfandiarAAkhavanOIrajizadAMelatonin as a powerful bio-antioxidant for reduction of grapheneoxideJ MaterChem2011211090710914
- AkhavanOGhaderiEAghayeeSFereydooniYTalebiAThe use of a glucose-reduced graphene oxide suspension forphotothermal cancer therapyJ MaterChem2012221377313781
- GurunathanSHanJWEppakayalaVKimJHMicrobial reduction of graphene oxide by Escherichia coli: a greenchemistry approachColloids Surf BBiointerfaces201310277277723107955
- AkhavanOGhaderiEToxicity of graphene and graphene oxide nanowalls againstbacteriaACSNano20104105731573620925398
- ZhangYAliSFDervishiECytotoxicity effects of graphene and single-wall carbon nanotubes inneural phaeochromocytoma-derived PC12 cellsACSNano2010463181318620481456
- AkhavanOGhaderiEEsfandiarAWrapping bacteria by graphene nanosheets for isolation fromenvironment, reactivation by sonication, and inactivation by near-infraredirradiationJ Phys ChemB2011115196279628821513335
- LiuSZengTHHofmannMAntibacterial activity of graphite, graphite oxide, graphene oxide,and reduced graphene oxide: membrane and oxidative stressACSNano2011596971698021851105
- HuWPengCLuoWGraphene-based antibacterial paperACSNano2010474317432320593851
- LiaoKHLinYSMacoskoCWHaynesCLCytotoxicity of graphene oxide and graphene in human erythrocytes andskin fibroblastsACS Appl MaterInterfaces2011372607261521650218
- ChangYYangSTLiuJHIn vitro toxicity evaluation of graphene oxide on A549cellsToxicolLett2011200320121021130147
- ZhangXYinJPengCDistribution and biocompatibility studies of graphene oxide in miceafter intravenousadministrationCarbon2011493986995
- AkhavanOGhaderiEAkhavanASize-dependent genotoxicity of graphene nanoplatelets in human stemcellsBiomaterials201233328017802522863381
- ChengCNieSLiSBiopolymer functionalized reduced graphene oxide with enhancedbiocompatibility via mussel inspired coatings/anchorsJ Mater ChemB20131265275
- GurunathanSKalishwaralalKVaidyanathanRBiosynthesis, purification and characterization of silvernanoparticles using Escherichia coliColloids Surf BBiointerfaces200974132833519716685
- HummersWSOffemanREPreparation of graphitic oxideJ Am ChemSoc195880613391339
- WangGYangJParkJFacile synthesis and characterization of graphenenanosheetsJ Phys ChemC20081122281928195
- ShimHYParkJHPaikHDNahSYKimDSHanYSAcacetin-induced apoptosis of human breast cancer MCF-7 cells involvescaspase cascade, mitochondria-mediated death signaling and SAPK/JNK1/2-c-JunactivationMolCells20072419510417846503
- KuilaTBoseSKhanraPMishraAKKimNHLeeJHRecent advances in graphene-basedbiosensorsBiosensBioelectron201126124637464821683572
- Fernández-MerinoMJGuardiaLParedesJLVitamin C as an innocuous and safe reductant for the preparation ofgraphene suspensions from graphite oxideJ Phys ChemC201011464266432
- ChenDLiLGuoLAn environment-friendly preparation of reduced graphene oxidenanosheets via aminoacidNanotechnology2011223232560121757797
- MoonIKLeeJRuoffRSLeeHReduced graphene oxide by chemicalgraphitizationNatCommun201017320865806
- YangXZhangXMaYHuangYWangYChenYSuperparamagnetic graphene oxide-Fe3O4 nanoparticles hybrid forcontrolled targeted drug carriersJ MaterChem20091927102714
- HassanHMAbdelsayedVKhderAEMicrowave synthesis of graphene sheets supporting metal nanocrystalsin aqueous and organic mediaJ MaterChem20091938323837
- WangYZhangPLiuCFZhanLLiYFHuangCZGreen and easy synthesis of biocompatible graphene for use as ananticoagulantRSCAdv2012223222328
- McAllisterMJLiJLAdamsonDHSingle sheet functionalized graphene by oxidation and thermalexpansion of graphiteChemMater2007191843964404
- NiyogiSBekyarovaEItkisMESpectroscopy of covalently functionalizedgrapheneNanoLett201010104061406620738114
- KudinKNOzbasBSchnieppHCPrud’hommeRKAksayIACaRRaman spectra of graphite oxide and functionalized graphenesheetsNanoLett200881364118154315
- EdaGChhowallaMChemically derived graphene oxide: towards large-area thin-filmelectronics and optoelectronicsAdvMater201022222392241520432408
- FerrariACMeyerJCScardaciVRaman spectrum of graphene and graphenelayersPhy RevLett20069718187401
- GaoJLiuFLiuYMaNWangZZhangXEnvironment-friendly method to produce graphene that employs vitamin Cand amino acidChemMater201022722132218
- WangYShiZYinJFacile synthesis of soluble graphene via a green reduction of grapheneoxide in tea solution and its biocompositesACS Appl MaterInterfaces2011341127113321438576
- LiYLiuYFuYThe triggering of apoptosis in macrophages by pristine graphenethrough the MAPK and TGF-beta signalingpathwaysBiomaterials201233240241122019121
- NelAXiaTMädlerLLiNToxic potential of materials at thenanolevelScience2006311576162262716456071
- WangYTanSWangJDirect imaging of apoptosis process of neural stem cells exposed toporous silica nanoparticlesCurrNanosci201063292297
- LiuXGurelVMorrisDBioavailability of nickel in single-wall carbonnanotubesAdvMater2007191927902796
- FenoglioITomatisMLisonDReactivity of carbon nanotubes: free radical generation or scavengingactivity?Free Radical BiolMed20064071227123316545691
- ShiLHernandezBSelkeMSinglet oxygen generation from water-soluble quantum dot-organic dyenanocompositesJ Am ChemSoc2006128196278627916683767
- HuWPengCLvMProtein corona-mediated mitigation of cytotoxicity of grapheneoxideACSNano2011553693370021500856
- ZhangLXiaJZhaoQLiuLZhangZFunctional graphene oxide as a nanocarrier for controlled loading andtargeted delivery of mixed anticancerdrugsSmall20106453754420033930
- RuizONFernandoKAWangBGraphene oxide: a nonspecific enhancer of cellulargrowthACSNano20115108100810721932790
- LiYZhangPDuQAdsorption of fluoride from aqueous solution bygrapheneJ Colloid InterfaceSci2011363134835421821258
- GurunathanSHanJWEppakayalaVKimJHBiocompatibility of microbially reduced graphene oxide in primarymouse embryonic fibroblast cellsColloids Surf BBiointerfaces2013105586623352948
- SanchezVCJachakAHurtRHKaneABBiological interactions of graphene-family nanomaterials: aninterdisciplinary reviewChem ResToxicol2011251153421954945
- GurunathanSHanJWDayemAAEppakayalaVKimJHOxidative stress-mediated antibacterial activity of graphene oxide andreduced graphene oxide in Pseudomonas aeruginosaInt JNanomedicine201275901591423226696
- TazawaHTatemichiMSawaTOxidative and nitrative stress caused by subcutaneous implantation ofa foreign body accelerates sarcoma development in Trp53+/−miceCarcinogenesis200728119119816857722