
Abstract
Introduction
SOCS3 (suppressor of cytokine signaling 3) protein is a crucial regulator of cytokine-induced inflammation, and its administration has been shown to have therapeutic effects. Recently, we designed a chimeric proteomimetic of SOCS3, mimicking the interfacing regions of a ternary complex composed of SOCS3, JAK2 (Janus kinase 2) and gp130 (glycoprotein 130) proteins. The derived chimeric peptide, KIRCONG chim, demonstrated limited mimetic function owing to its poor water solubility.
Methods
We report investigations concerning a PEGylated variant of KIRCONG mimetic, named KIRCONG chim, bearing a PEG (Polyethylene glycol) moiety as a linker of noncontiguous SOCS3 regions. Its ability to bind to the catalytic domain of JAK2 was evaluated through MST (MicroScale Thermophoresis), as well as its stability in biological serum assays. The structural features of the cyclic compounds were investigated by CD (circular dichroism), nuclear magnetic resonance (NMR), and molecular dynamic (MD) studies. To evaluate the cellular effects, we employed a PLGA-nanoparticle as a delivery system after characterization using DLS and SEM techniques.
Results
KIRCONG chim PEG-revealed selective penetration into triple-negative breast cancer (TNBC) MDA-MB-231 cells with respect to the human breast epithelial cell line (MCF10A), acting as a potent inhibitor of STAT3 phosphorylation.
Discussion
Overall, the data indicated that miniaturization of the SOCS3 protein is a promising therapeutic approach for aberrant dysregulation of JAK/STAT during cancer progression.
Introduction
Suppressor of cytokine signaling (SOCS) proteins are a family of cytokine-inducible proteins able to inhibit cytokine signaling mainly through the negative regulation of the Janus kinase/signal transducer and activator of transcription (JAK/STAT) pathway.Citation1 JAK/STAT is a major regulator of the expression of many genes related to cellular activation, differentiation, migration, apoptosis and proliferation and thus its dysregulation is involved in chronic inflammatory diseases.Citation2 SOCS protein family includes eight members: SOCS1-SOCS7 and cytokine-inducible SH2-containing protein (CIS). Structurally, these proteins contain a Src homology 2 (SH2) domain, a variable N-terminal domain and a C-terminal SOCS box.Citation3 Two members of this family, SOCS1 and SOCS3 have a motif in the N-terminal region, called kinase inhibitory region (KIR)Citation4 that is crucially involved in the inhibition of JAKs.Citation5 Biochemical studies have highlighted different mechanisms of action (MOAs) of these proteins in the inhibition of JAKs: while the SH2 domain of SOCS1 directly binds to the activation loop of JAK,Citation6 the SH2 domain of SOCS3 binds to phosphorylated tyrosine residues on activated cytokine receptors (glycoprotein (gp) 130 in IL-6 signaling).Citation7 Indeed, SOCS3 has a key role in controlling IL-6 signaling:Citation8 its overexpression demonstrated therapeutic effects in colorectal,Citation9 ovarian cancer linesCitation10 in MCF7 BC (breast cancer) cells, non-small-cell lung cancers (NSCLC)Citation11,Citation12 and solid tumors.Citation13 It revealed the ability to inhibit STAT3 expression,Citation14 tumor growth and metastasis in xenograft models,Citation15 in neovascular age-related macular degeneration (nAMD).Citation16 SOCS3 can function as a positive regulator of TLR4 signaling in osteoblastsCitation17 as well as in immature thymocytes of Precursor T-cell neoplasms (T-cell acute lymphoblastic leukemia/T-cell lymphoblastic lymphoma, T-ALL/LBL)Citation18 and of autophagy dysfunction in uveal melanoma (UM).Citation19 As major regulators of JAK/STAT, SOCSs mimetics and antagonists can exert a major function as intracellular checkpoint agents, and SOCS3 proteomimetics can be conceived as novel therapeutics.Citation20 In our previous studies, a linear peptide spanning SOCS3 22–45 residues, including KIR and ESS (extended SH2 subdomain) regions, called KIRESS, demonstrated a good mimetic of the entire protein. Its administration significantly reduced growth of squamous cell carcinomaCitation21 and, in triple-negative breast cancer (TNBC), prevented the formation of pulmonary metastasisCitation22 and more recently, in an in vivo model of oxygen-induced retinopathy (OIR) attenuated retinal neovascularization.Citation16 We also investigated another peptide-based mimetic, named KIRCONG chim, which is a chimeric peptidomimetic which includes noncontiguous SOCS3 regions connected by two β-alanines (βAla) as spacers: it demonstrated able to bind to the catalytic domain of JAK2 and to act as a potent anti-inflammatory and antioxidant agent in VSMCs (vascular smooth muscle cells) and RAW 264.7 macrophages.Citation23 In structure-based drug design (SBDD), the employment of peptide as drugs is often limited to their short half-lives, rapid degradation and high levels of clearance after systemic administration.Citation24 To overcome these limitations chemical routes generally applied to develop cyclopeptidomimetics.Citation25 However, in subsequent studies KIRCONG chim was disinclined to be conformationally constrained: indeed the insertion of hydrocarbon, disulfide and lactam cycles of different lengths caused a reduction of affinity toward JAK2 despite major serum stability.Citation26 One of the major drawbacks concerning KIRCONG chim is its low aqueous solubility and, in this study, its analog which contains a polyethylene glycol (PEG) moiety was in substitution of β-Ala residues ().
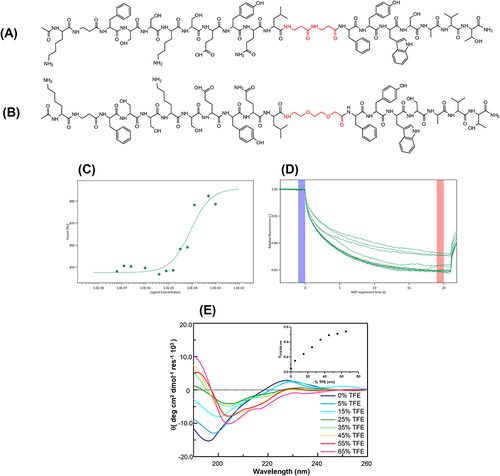
Figure 1 In vitro SAR studies of KIRCONG chim PEG. Schematic chemical structures of (A) KIRCONG chim and (B) KIRCONG chim PEG. β-Ala and PEG structures are highlighted in red. (C) Binding isotherm and (D) thermophoretic traces for MST signals versus KIRCONG chim PEG concentrations. (E) Overlay of CD spectra of KIRCONG chim PEG at indicated at indicated 2,2,2-Trifluoroethanol (TFE) percentages, inset Θratio value vs TFE %.
Indeed, PEGylation of chemical agents can enhance their blood circulation and biocompatibility, and many examples of PEGylated drugs have been approved in clinical trials,Citation27 which can improve their physical stability, solubility, colloidal stability, and melting temperature. In this study, we designed and investigated the conformational features of the PEGylated derivative, KIRCONG chim PEG, using circular dichroism (CD), nuclear magnetic resonance (NMR), molecular dynamic (MD) simulations, and functional abilities using microscale thermophoresis (MST) and serum stability.
Solid tumors are characterized by a heterogeneous population of neoplastic cells supplied by an irregular and discontinuous endothelium with large gaps between the endothelial cells and abnormally thick or thin-basement membranes,Citation28 and often they are easily targeted with nanoparticles (NPs)-based drug-delivery systems.Citation29 Indeed, immunoliposomes or liposomes decorated with monoclonal antibodies or variable monovalent fragments (Fab) promote active targetingCitation30 or covalently linked to an inhibitor of the extracellular matrix (ECM)-related enzyme, lysyl oxidase 1 (LOX), that inhibits the cross-linking of elastin and collagen fibers. This system once loaded with epirubicin chemotherapeutic exhibited greater inhibition of triple negative breast cancer (TNBC) cell growth.Citation31 Interestingly, leukosomes are biomimetic vesicles exhibiting the combined features liposomes and leukocytes, were successfully employed to selectively deliver drugs to the inflamed vasculature.Citation32 Also biodegradable-polymeric NPs demonstrated efficient cargos of a recently developed Poly(DL-lactide-co-glycolide) (PLGA)-based nanocarrier, named PRECIOUS-01, encapsulating a tumour antigen (NY-ESO-1) and an invariant natural killer T cell activator augmented specific antitumor immune responses in patients with NY-ESO-1-expressing advanced solid tumours.Citation33
In this study, to evaluate the cellular effects, we employed an unexplored nanoparticle-based system for SOCS3 mimetics. PLGA NPs were fabricated as they demonstrated promising biomolecule delivery systems.Citation34 PLGA have an excellent safety profile in humans and are FDA-approved for vaccine and drug delivery, as well as in tissue engineering. Moreover, PLGA NPs protect loaded peptides/proteins from proteolytic degradation, resulting in enhanced plasma half-life. Once the in vitro efficiency of encapsulation and release of KIRCONG chim PEG-NPs was determined, the SOCS3 mimetic cellular effects were investigated in triple-negative breast cancer (TNBC) MDA-MB-231 cells and human breast epithelial cell lines (MCF10A).
Material and Methods
Peptide Synthesis
KIRCONG chim PEG and control compounds (Ctrl PEG: βAla-G-βAla-QL-PEG-AAFAARA and Ctrl PEG-Val: βAla-G-βAla-QL-PEG-AAFAARAV) (Table S1) were synthesized as C-terminal amides on rink-amide resins using the 9-fluorenylmethoxycarbonyl/tert-butyl (Fmoc/tBu) strategy as described previously, with or without N-terminal FITC (fluorescein isothiocyanate).Citation35
Circular Dichroism (CD) Spectroscopy
The CD spectra were recorded using a Jasco J-815 spectropolarimeter (JASCO, Tokyo, Japan). KIRCONG chim PEG was analyzed at 100 µM in 10 mM phosphate buffer pH 7.4 in mixtures with TFE (2,2,2-trifluoroethanol), with a final solution of 150 µL in a 0.1 cm long quartz cuvette. The CD signals were converted to mean residue ellipticity in deg × cm2 × dmol−1 × res−1 units. The scan speed, band width 2.0 nm, resolution 0.2 nm, sensitivity 50 mdeg and response were 20 s, 2 s, and 4 s, respectively. Deconvolutions of the CD spectra were obtained using BESTSEL software (http://bestsel.elte.hu/.Citation36
Serum Stability
KIRCONG chim and its PEGylated derivative were mixed with 25% (w/v) FBS to a final concentration of 1 mg/mL and incubated at 37 °C as previously described.Citation23 Fifty microliter aliquots of the incubating mixtures were recovered at different times: 0, 3, 17, 20, 23, and 42 h. Samples were treated with 50 µL of 30% trichloroacetic acid (TCA) and incubated at 2 °C for at least 15 min to precipitate serum proteins. After centrifugation (13,000 rpm for 15 min) the supernatant was collected. The samples were analyzed by reverse-phase high-performance liquid chromatography (RP-HPLC) on an HPLC LC-4000 series (Jasco) equipped with a UV detector using a C18-Kinetek column from Phenomenex (Milan, Italy). Gradient elution was performed at 25 °C (monitored at 210 nm) using a gradient starting with buffer A (0.1% TFA in H2O) and applying buffer B (0.1% TFA in CH3CN) from 5 to 70% in 20 min. The peak areas of recovered compounds over time were then integrated by assuming 100% the peak areas at t=0 min. All stability tests were performed at least in triplicate.
Microscale Thermophoresis
The MST experiment was performed using a Monolith NT 115 system (Nano Temper Technologies) equipped with 40% LED and 40% IR-laser power. Labeling of the His-tag catalytic domain of JAK2 (residues 826–1132) (Carna Biosciences) was achieved using the RED-tris-NTA His-Tag Labeling Kit. KIRCONG chim PEG was used, starting from a 1 mM stock solution in 50 mM Tris-HCl buffer (150 mM NaCl, 0.05% Brij35, 1 mM DTT, 10% glycerol) at pH 7.5. Standard capillaries were used for the analysis, which was performed as previously reported.Citation23 An equation implemented using the MO-S002 MO Affinity Analysis software was used to fit the data.
NMR
The first set of NMR experiments (1D [1H], 2D [1H, 1H] TOCSYCitation37 (total correlation spectroscopy) (70 ms mixing time), NOESYCitation38 (nuclear overhauser enhancement spectroscopy) (300 ms mixing time), and ROESYCitation39 (rotating frame overhauser enhancement spectroscopy) (250 ms mixing time)) were recorded on a Bruker Avance 700 MHz spectrometer equipped with a cryoprobe by employing a KIRCONG chim PEG sample at 600 μM in 10 mM sodium phosphate buffer (NaP) (pH 7.4, 600 μL sample total volume with 10% D2O (deuterium oxide, 98% D, Sigma-Aldrich, Milan, Italy)).
Additional spectra were recorded in a mixture NaP of NaP/TFE (Trifluoroethanol-d3, 99% D Cortecnet, Les Ulis, France) 50/50 v/v at 400 μM on a Bruker Avance Neo 500 MHz spectrometer equipped with a cryoprobe. 1D [1H], 2D [1H, 1H] TOCSY (70 ms mixing time), NOESY (200 and 300 ms mixing times), ROESY (250 ms mixing time), and double quantum filtered correlated spectroscopy (DQFCOSYCitation40) spectra were acquired in the presence of TFE.
NMR experiments were registered at 25°C, with 16–64 scans, 128–256 FIDs in t1 and 1024 and 2048 data points in t2. Water suppression was achieved by either presaturation or excitation sculpting.Citation41 TSP (Trimethylsilyl-3-propionic acid sodium salt-D4, 99% D; Armar Scientific, Switzerland) was used as internal standard for chemical shift referencing (0.0 ppm). Proton resonance assignments were obtained using a standard protocol that relied on a comparison of the TOCSY and NOESY/ROESY spectra.Citation42 Spectra were processed with Bruker TopSpin 4.2.0 and analyzed with the software NEASYCitation43 included in CARA (http://www.nmr.ch/).
Computational Methods
The KIRCONG chim PEG peptide starting model was built by homology using the NMR structure and protonation state of the analog KIRCONG chim,Citation44 the manufacturing VMD plugin.Citation45 The force field parameters for the β-Ala were retrieved from,Citation46 PEG units were parametrized with antechamberCitation47 using bcc charges to generate their GAFF/AMBER topology.Citation48 The free peptidomimetic was placed in a cubic box and solvated with a tip3p water layer (1.0 nm with tleap. Amber topologies were converted into Gromacs topologies using ACPYPECitation49 for subsequent molecular dynamics (MD) simulations. The system was then minimized. Minimization was followed by 100 ps long NVT and NPT equilibrations for 100 ps, and 100 ns long NPT production runs at 300 K. The iteration time step was set to 2 fs using the Verlet integrator and LINCSCitation50 constraint. Periodic boundary conditions were used in this study. Peptide configurations were clustered using the Daura algorithm and cutoff 0.25 nm.
The representative conformation of each of the two most populated clusters was then employed as the starting conformation for subsequent docking to JAK2 (PDB ID:3FUP,Citation51 chain A). The system was prepared using the AutoDock tools.Citation52 (22.5×19.5×22.5)Å docking box was centered on KIR as of the JAK2/KIR complex constructed following the procedure described.Citation44 We used Lamarckian genetic algorithm. Docking was performed with 200 runs, 2,500,000 maximum evaluations, and standard parameters. Then, the peptide:JAK2 complexes underwent the same MD procedure employed for the free peptide, with 500 ns long production NPT runs. The binding free energy was estimated using the MM/GBSA method, with the apolar solvation energy calculated as the solvent-accessible surface area (SASA) and default parameters implemented in the gmx_mmpbsa tool.Citation53
All MD simulations and analyses were performed using the Gromacs package v. 2021.Citation54 Simulations were performed using M100 (CINECA, Italy).
NPs Synthesis and Characterization
6.4 mg FITC-KIRCONG chim PEG and FITC-Ctrl PEG peptides were dissolved in an acetonitrile solution obtained by dissolving poly(lactic-co-glycolic acid) (PLGA) at 5 mg/mL. This solution was injected at 2 mL/min a flow rate into the aqueous phase (0.1% polyvinyl alcohol; PVA) using a perpendicular syringe pump with a magnetic stirring for 48 h to allow the solvent to evaporate. Powder NPs were obtained from the liquid suspensions by freezing/drying cycles after three washes in water at 15,000 rpm for 10 min.
SEM, Static and Dynamic Light Scattering Analyses
KIRCONG chim PEG-NPs were loaded onto a standard SEM pin stub, covered with a 10 nm-thick gold layer, and analyzed by FESEM at 15–25 kV using an SE2 detector. Size distributions and PDI (polydispersity index) of formulated NPs were analyzed using a Zetasizer Nano ZS (Malvern Instruments, Southborough, MA) and a static Mastersizer at a temperature of 25 °C and, material refraction index of 1.33, and viscosity of 0.8872 cp. Data represent the average of three runs for each sample, with the standard deviation consistently below 5%.
Encapsulation Efficacy and Release
The encapsulation efficacy (% n) was evaluated by measuring the fluorescence intensity of FITC (λexc =488 nm, λem =520 nm) in solutions obtained after complete disruption of the NPs. This disruption occurred, by direct method, dissolving 1 mg of NPs in a solution of 50% DMSO/0.5% SDS/0.1 M NaOH for 1 h under vigorous stirring. Similarly, for the evaluation of release, 1 mg of -NPs was resuspended in 1.5 mL of PBS buffer at pH 7.2. Samples were incubated at 37 °C with gentle shaking. At fixed time points (15 min, 1, 2, 3, 4, and 24 h), 1 mL of sample was withdrawn after NP sedimentation for 10 min at 10,000 rpm and analyzed by fluorescence. All experiments were performed in triplicate. In both cases, the quantity of fluorescent compounds was estimated on the basis of FITC signal and using a calibration line of the free peptide built in the two different conditions. The average % release was calculated as (actual drug loading/theoretical drug loading) × 100%.
Cell Culture
MCF10A cells were generously provided by Prof. Stefano Piccolo (University of Padova, Department of Molecular Medicine, Padova, Italy), and MDA-MB-231 by Dr. Francesco Paolo Cammarata (Institute of Molecular Bioimaging and Physiology, National Research Council IBFM-CNR, Cefalù, Italy). MDA-MB-231 cells were cultured in Lonza Dulbecco’s modified Eagle’s medium (DMEM/F-12) supplemented with 10% fetal bovine serum (Microgem), 1% L-glutamine (Himedia), and 1% penicillin–streptomycin (Himedia). MCF10A cells were cultured in DMEM-F12 (Microgem) supplemented with 5% horse serum (Thermo Scientific 16050122), 1% penicillin/streptomycin (HiMedia), 1% L-glutamine (HiMedia), 20 ng/mL epidermal growth factor (EGF; Peprotech AF-100-5), 500 ng/mL human corticosteroids (Sigma-Aldrich H0396), and insulin (Sigma-Aldrich I9278). All human cell lines have been authenticated using STR profiling within the last three years and are listed using the official cell-line name.
Cell Viability Assay
MDA-MB-231 and MCF10A cells were seeded in duplicates in 48-well plates at a density of 12500 cells/well and allowed to adhere overnight. Formulated NPs (empty-, KIRCONG chim PEG- and Ctrl PEG-NPs) were diluted in cell culture medium at final concentrations of 1, 0.5, 0.2 and 0.1 mg/mL and added to the cells for 24 h. After the incubation, 3-(4,5-dimethylthiazol-2-yl)-2,5-diphenyltetrazolium bromide (MTT) assays was used according to the manufacturer’s instructions. Briefly, 200 µL of MTT (final concentration 0.5 mg/mL; Sigma-Aldrich) were added to each well for 3 h. Then, the supernatant was removed and substituted with 200 µL of isopropanol for 10 min at 37 °C, 5% CO2. The optical density of each well sample was determined at 570 nm using a microplate reader. A blank absorbance value of 0.053, obtained from wells without cells, but treated with MTT reagent, was subtracted from all the absorbance values. Then, the average absorbance value of cells treated with NPs was normalized to those of control cells incubated with media and cell viability was expressed as a percentage of the control. Standard deviations of normalized absorbance values were calculated via error propagation.
Quantification of the Uptake of Compounds
To evaluate the cell internalization of KIRCONG chim PEG- and Ctrl PEG-NPs, 25000 MDA-MB-231 and MCF10A cells were seeded in a four-well cell culture chamber (1.9 cm2 per well; Sarstedt, Germany) and allowed to adhere overnight. The day after, the cells were incubated for 24 h with the loaded NPs at a final concentration of 1.0 and 0.1 mg/mL, for KIRCONG chim PEG and Ctrl PEG, respectively, which correspond to a concentration of 7.0 µM of single peptide. After incubation, cells were rinsed five times with PBS to remove non-internalized NPs and fixed with 4% paraformaldehyde for 20 min, washed twice with 1× PBS and stored at 4 °C. Image stacks covering the total cell volume were acquired at 0.5 µm Z-spacing with a confocal laser scanning microscope (ZEISS LSM 900) equipped with diode laser line at excitation wavelengths of 488 nm with respective filter at a band pass of 500–535 nm (NP, green channel) using a 63× oil immersion objective (NA 1.4). The image resolution was fixed at 1192×1192 pixels2 (0.09 µm/px). Image analysis of fluorescent NPs internalized by cells was performed using the Fiji ImageJ software (NIH, Bethesda, MD, USA). Briefly, a maximum projection image for both color channels was constructed from consecutive focal planes. The green channel was used to extract individual cell outlines using the ImageJ ROI manager tool, and internalization was evaluated in terms of the integrated fluorescence intensity of KIRCONG chim PEG or Ctrl PEG within individual cell boundaries normalized to the corresponding cell area.
Colocalization Between KIRCONG Chim PEG and Lysosomes
To evaluate potential colocalization of KIRCONG chim PEG and lysosomes, MDA-MB-231 cells were incubated with KIRCONG chim PEG-NPs, and then with 75 nM LysoTracker DND 99 (L7528, ThermoFisher) at 37 °C for 1 h. After this treatment, cells were rinsed two times with 1× PBS, fixed with 4% paraformaldehyde for 20 min and stored at 4 °C. Images were acquired with a confocal laser scanning microscope (ZEISS LSM 900) equipped with diode laser lines at excitation wavelength of 488 and 640 nm with respective filters at a band pass of 500–535 nm (NP, green channel) and 650–750 nm (lysosomes, far red channel) using a 63× oil immersion objective (NA 1.4) and with 1 airy unit (AU) pinhole aperture. The analysis of colocalization between KIRCONG chim PEG and lysosomes was carried out using the Fiji ImageJ software by performing the following steps: 1) lysosome images were used to extract individual cellular outlines using the ImageJ ROI manager tool; 2) the signals of both green and far red channels, out of the individual cellular ROIs, were cleared; 3) the green and far red channels were combined associating green to KIRCONG chim PEG signal and red to that of lysosomes; 4) merged images were transformed into an RGB image; 5) the color thresholding command was used to select the yellow areas (33–52 range) corresponding to the colocalized regions; 6) the area of the yellow regions was calculated and normalized to that of lysosomes for each cell.
Cellular Stimulation and Quantification of p-STAT3 Staining
MDA-MB-231 and MCF10A cells were cultured and incubated with KIRCONG chim PEG- and Ctrl PEG-NPs for 24 h as previously described. The day after, the cells were extensively washed and incubated for 1 h with interferon gamma (IFNγ) and interleukin (IL-6) diluted in cell culture media at final concentrations of 50 and 100 ng/mL, respectively. After 1 h, cells were fixed with 4% paraformaldehyde for 20 min, washed twice, permeabilized with 0.1% Triton X-100 for 5 min, and blocked with 3% bovine serum albumin (BSA) for 1 h. Immunostaining for phospho-Stat3 (p-STAT3) was performed using a rabbit antihuman polyclonal antibody (Catalog #AF4607, 10 µg/mLin PBS 1X) for 3 h. The cells were then washed twice and incubated with goat anti-rabbit Alexa Fluor 647 conjugated secondary antibody (Thermo Scientific, AB2536165, 1:200 dilution) and Alexa Fluor 546 phalloidin (1:200 dilution) in the dark for 1 h. Finally, nuclei were stained with Hoechst 33342 (1:1000 dilution in PBS 1X) for 15 minutes. The cells were washed three times with 1× PBS and stored at 4 °C. Z-stacks of three images positioned at the middle of the interior cells (where the nuclear cross-sectional area is maximum) were acquired at 0.2 µm Z-spacing with a confocal laser scanning microscope (ZEISS LSM 900). Green (NP) channels were acquired as previously indicated. Diode laser lines at excitation wavelengths of 405, 561 and 640 nm with respective filters at a band pass of 440–480 nm (Hoechst 33342, blue channel), 555–620 nm (phalloidin, red channel) and 650–750 nm (p-STAT3, far red channel) were used for the acquisition of nuclei, actin and p-STAT3, respectively.
Total p-STAT3 expression was investigated using the ImageJ software. Briefly, Z-stacks for the far-red channel (p-STAT3) were projected onto a single image using the “sum projection” function in the ImageJ software. Phalloidin images were used to extract individual cellular outlines using the ImageJ ROI manager tool, and p-STAT3 expression was evaluated in terms of integrated fluorescence intensity within individual cellular and nuclear boundaries. The values of total p-STAT3 expression were normalized to the corresponding cell volume (mean fluorescence) and then reported as a fold change relative to the mean value of p-STAT3 mean fluorescence exhibited by cells incubated with Ctrl PEG-NPs.
Statistical Analysis
Statistical comparisons were performed using Student’s unpaired test when the data exhibited a normal distribution. Otherwise, a nonparametric Kruskal–Wallis test was used. Differences were considered significant when p-values were <0.05. The normality of data was checked using the Shapiro–Wilk test (p < 0.05, non-normal distribution).
Results and Discussion
In vitro Characterization of PEGylated KIRCONG Chim
In the SOCS3 mimetic KIRCONG chim (), two different regions of SOCS3 are connected: the stretch spanning 22–35 residues of KIR, and 46–52 fragment, CONG (Supplementary Table S1), linked by two residues of βAla, in the novel PEGylated analog we substituted this link with a PEG (9 atoms) moiety as schematically reported in and named it KIRCONG chim PEG.
To determine whether the change introduced could change the ability of these compounds to bind JAK2, microscale thermophoresis (MST) experiments were carried out ( and ) by keeping the JAK2 concentration constant and increasing the concentration of KIRCONG chim PEG. The estimated KD value was low micromolar and comparable to that exhibited by the KIRCONG Chim (Table S1).Citation23
The conformational features of KIRCONG chim PEG were investigated through CD analysis; 2,2,2-Trifluoroethanol (TFE) titration was performed, and the related overlay of the CD spectra is shown in . At 0% of TFE, the spectrum indicates a prevalent random content for the position of the minimum at ~195 nm and a positive band at ~230 nm, implying intermolecular aromatic contributions to conformations. The presence of TFE allowed the reach more ordered conformations: from 0 to 25% of TFE, a neat transition of λmin was observed from ~195 to 205 nm, during the same interval of TFE concentrations, the drastic reduction of aromatic positive band suggested a change in conformational environment as well as the formation of a secondary minimum at ~215 to 222 nm that indicating the presence of a poor helical content. This trend was confirmed also by the Θratio profile (calculated as the minimum at 218 divided by that at 205 nm) vs TFE concentration, which reached its maximum value at ~45% of TFE despite the percentage of helix being low, as indicated by the deconvolution of CD spectra (Table S2).
To obtain additional insights into the structural features characterizing the KIRCONG chim PEG NMR analyses were performed in NaP and in a mixture with TFE.
The aqueous buffer spectra indicated a very flexible conformation: a poor signal dispersion is evident in the HN region (approximately 8 ppm) in the 2D [1H, 1H] TOCSY spectrum (Figure S1A, left panel), along with the lack of patterns of cross-peaks in the NOESY spectrum (Figure S1A, right panel), and a few duplicated spin systems similar to those observed for the single tryptophan residue, Trp15 Figure S1B. Signal overlaps and a low number of NOE contacts hampered unambiguous proton resonance assignments. In the presence of 50% TFE, a certain improvement in signal dispersion in 1D [1H] and 2D [1H, 1H] spectra (Figure S2A and B), was observed, pointing out a partial increase in order, even if the compound remained rather flexible and several HN protons in the N-terminal peptide region close to the PEG chain (ie, residues from Ser4 to Ser7) appeared completely solvent exposed and not visible in the spectra, allowing only a partial proton resonance assignment (Table S3). The ROE pattern (Figure S2C), is dominated by a few sequential contacts compatible with a random coil or partially extended peptide conformation.Citation42 The comparison of 1D [1H] spectra of KIRCONG chim and its PEGylated analog, in presence of TFE (Figure S2A), clearly indicated that the first assumed a more ordered conformation as suggested by the larger signal dispersion.Citation23
Computational Results
KIRCONG chim PEG underwent atomistic molecular dynamics (MD) simulations (100 ns) in water to sample conformational space. As expected, due to its flexibility, the PEGylated chimeric sequence changed its conformation along the simulated time, as suggested by its RMSD >1.0 nm (Figure S3A). The conformations sampled along the trajectory were clustered, resulting in 85 clusters. The representative conformation of the largest cluster, sampled after 11 ns and representing only the 29% of all structures, exhibited helical secondary structure. The representative conformation of the second cluster, sampled at 95.5 ns and representing 16% of the sampled conformers, is less ordered (Figure S3A). All other clusters each contained at between 11% and 1% of the sampled conformers. The representative conformations of the two largest clusters were employed for subsequent docking to obtain two peptides and JAK2 complexes. These were solvated and underwent 500 ns MD simulations. In both replicas, the chimeric explored different conformations and positions on the protein-binding site as indicated by the RMSD, reaching 2.0 nm in both cases, and by comparing the snapshots taken after equilibration and at end-simulation (Figure S3B). MMPBSA calculations showed that the polar (de)solvation energy was the major contributor to binding, while electrostatic forces strongly contributed to keeping the chimeric protein bound to its target (Figure S3B).
Serum Stability Assay
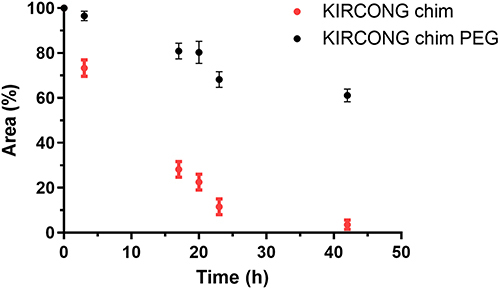
To check the stability of KIRCONG chim PEG in cellular context, a serum stability assay in 25% FBS was performed. The decrease in the area percentages of peptides during the time of analysis is shown in , in comparison with KIRCONG chim. As shown, the PEGylated compound presented a greater stability within 42 h of analysis: after 24 h, KIRCONG chim was already degraded by 85%, while KIRCONG chim PEG was only 30%. At the end, while the reference compound appeared almost completely digested, ~95%, KIRCONG chim PEG remained intact of still 60% with respect to initial amount. These results showed that the insertion of the PEG unit led to a significant increase in serum stability, allowing longer-lasting in-cell action.
Figure 2 Serum stability assay. Residual peptide amount is expressed as the percentage of the initial amount versus time.
Fabrication of PLGA-NPs Encapsulated with KIRCONG Chim PEG
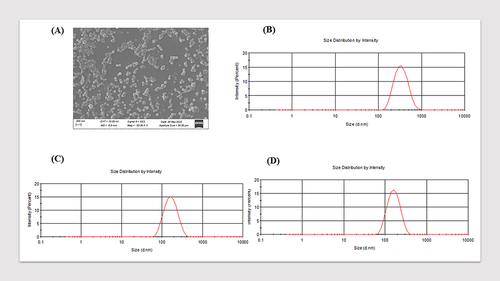
KIRCONG chim PEG and control PEG peptides (see mat and meth sections) were encapsulated in PLGA-NPs. To follow encapsulation, release and cellular assays, the peptides were labelled with FITC at the N-terminus. NPs were synthesized by the single emulsion technique using acetonitrile as organic phase to obtained monodispersed NPs. The morphology of KIRCONG chim PEG-NPs was evaluated by SEM microscopy (): a good monodispersion of particles was observed without any visible aggregation; these data were also confirmed by DLS analysis (). Indeed, NPs loaded with KIRCONG chim PEG showed suitable size distributions with a mean diameter of 206.0±0.2 nm and PDI=0.16, similarly Ctrl PEG-NPs with a diameter=200±0.5 nm and PDI=0.15 for () and Ctrl PEG-Val-NPs providing a diameter=200±0.5 nm and PDI=0.17 (). Similar results were obtained by static analysis and all formulations showed a slight acidic Z-potential as expected (Figure S4).
Figure 3 In vitro characterization of NPs. (A) SEM analysis of KIRCONG chim PEG (B–D) DLS size distribution of KIRCONG chim PEG (B), Ctrl PEG (C), Ctrl PEG-Val (D).
Furthermore, the entrapment efficiency of PLGA-NPs was evaluated and while values for KIRCONG chim PEG and Ctrl PEG appeared quite similar, 22.8±0.7% for, 27.6±0.3% respectively, for Ctrl PEG-Val the entrapment percentage was only 8.0±0.3% likely due to a peptide precipitation in the NP fabrication phase. During the subsequent washing steps, poor fluorescent signals in wash solutions were detected except for Ctrl PEG-Val where an intense signal due to immediate release of poor encapsulated peptide occurred. For the other compounds, upon the break of NPs for the treatment with DMSO, the solutions were evaluated for their FITC signals and subtracted values between supernatants of broken and un-broken NPs allowed to estimate that ~77% of KIRCONG chim PEG and the ~63% of the Ctrl-PEG were adsorbed on the external surface of NPs during particle fabrication. The presence of peptides on the external surface of NPs was usually responsible for the initial drug burst release.Citation55 Often the in vitro release of PLGA-NPs, has an initial burst phase which was observed also in this case as reported in Figure S5, followed by a small exponential phase from 1 to 4 h, and then by a plateau. Indeed, substantial drug release from PLGA micro- and nanoparticles usually occurs in the first hours of soaking.Citation56 A faster release was observed for Ctrl PEG, which reached ~65% in 24 h, while ~45% of KIRCONG chim PEG was released at the same time. This is likely due to the presence of more hydrophilic residues in Ctrl PEG moiety, which could enhance the affinity toward the aqueous phase.Citation57–59 As to the Ctrl PEG-Val a 100% of the release was observed just at 0.5 h (Figure S5); this result is compatible with the scarce amount of adsorbed molecules primarily exposed on the surface of the polymer. For this reason, the Ctrl PEG-Val was excluded for further experiments.
Cytotoxicity and Cell Internalization of KIRCONG Chim PEG-NPs
The cytotoxicity of NPs formulated systems was investigated through MTT assay, in MCF10A and MDA-MB-231 cells, at different doses, 1, 0.5, 0.2, 0.1 mg/mL NPs-formulated compounds in suspension ( and ). Low doses, 0.1–0.5 mg/mL, did not affect the viability of both cell types except when NPs were loaded with Ctrl peptide in the case of tumor cells, MDA-MB-231 (). This could be due to a generic unspecific effect for the high encapsulation value of Ctrl PEG-NPs. Conversely highest dose (1mg/mL) resulted slightly cytotoxic also in the case of KIRCONG chim PEG in MCF10A cells (~20%) (). On the basis of our previous study,Citation23 the required active concentration of KIRCONG chim PEG should be at least 7.0 µM which corresponded for KIRCONG chim PEG-NPs/volume concentration to ~1 mg/mL and for Ctrl PEG-NPs/volume ~0.1 mg/mL (on the basis of entrapment data, 22.8±0.7, 27.6±0.3, respectively). MTT experiment allowed to report on a low cytotoxic effect of encapsulated KIRCONG chim PEG only in healthy cells.
Figure 4 Effects of Empty-NPs, KIRCONG chim PEG-NPs and Ctrl PEG-NPs on viability of MDA-MB-231 (A) and MCF10A (B) incubated with all three types of NPs for 24 h. Control refers to untreated cells as 100% of viable cells. ***p<0.001, **p<0.01, *p<0.05, triplicates. (C) Sum intensity projections of z-stack images taken from fluorescence signals of KIRCONG chim PEG and Ctrl PEG in MDA-MB-231 (a,b) and MCF10A (c,d) shown as rainbow RGB look-up table. Scale bar, 50 μm. (D) Integrated fluorescence of KIRCONG chim PEG or Ctrl PEG within individual cell boundaries normalized to the corresponding cell area. Data are reported as mean ± standard deviation. *** p<0.001. N≥9.
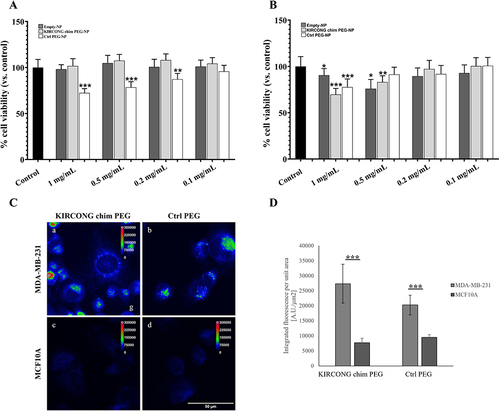
The internalization levels of KIRCONG chim PEG and Ctrl PEG in both MCF10A and MDA-MB-231 cells were evaluated using fluorescence microscopy. The intensity of intracellular NPs in the whole cell volume was measured to quantify internalized NPs ( and ), which resulted significantly lower in healthy cells than in tumor cells (). The selectivity of penetration indicates that NPs are possibly actively transported across the plasma membrane by endocytosis, most likely involving clathrin- and macropinocytosis-mediated pathways, which demonstrated a higher rate in breast cancer stem cellsCitation60 such as MDA-MB-231 cells.Citation61
To gain insights into the mechanism of action of KIRCONG chim PEG, we investigated potential colocalization between lysosomes and the peptidomimetic, in MDA-MB-231 cells reported in Figure S6. In detail, the percentage areas of overlapping regions (yellow) between lysosomes (red) and KIRCONG chim PEG (green) with respect to total lysosomes were quantified. Results indicated that KIRCONG chim PEG colocalized with lysosomes at ~30%. This result suggests that cells could adopt a endocytic mechanism to mediate NP internalization,Citation62,Citation63 and the fact that the most part of KIRCONG chim PEG, ⁓70%, did not colocalize, indicates that its cytoplasmic presence is likely mediated by a diffusion process through the matrix of PLGA-NPs.Citation64
KIRCONG Chim PEG Blocks Nuclear Translocation of STAT3
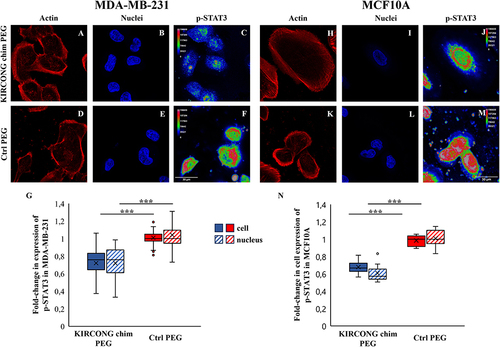
To establish the ability of KIRCONG chim PEG to modulate the JAK/STAT pathway and inhibit the phosphorylation of STAT3 in breast tumors, the expression levels of pSTAT3 in both the cytoplasmic and nuclear compartments were quantified in terms of mean fluorescence (integrated density per unit volume) after 24 h of incubation and stimulation with IFN-γ and IL-6 (). As shown in , KIRCONG chim PEG strongly reduced the expression of pSTAT3 in MDA-MB-231 cells. More importantly, it prevented nuclear translocation of the STAT3 dimer, blocking its transcriptional activity. As expected, similar results were obtained in MCF10A cells as reported in , even if the amount of NPs and, as a consequence, of KIRCONG chim PEG is lower in MCF10A than in MDA-MB-231 cells. Interestingly, ~20% of MDA-MB-231 cells has a prominent reduction of pSTAT3 up to 60–70%, whereas this reduction in MCF10A is at maximum ~40% both with respect to Ctrl PEG.
Figure 5 Representative images of actin of MDA-MB-231 (A, D) and MCF10A (H, K) cells after 24 h of incubation with KIRCONG chim PEG-NPs (A, H) and Ctrl PEG-NPs (D, K). Sum intensity projections of z-stack images taken from nuclei (B, E, I, L) and pSTAT3 (C, F, J, M) of MDA-MB-231 (B-C, E-F) and MCF10A (I-J, L-M) cells after 24 h of incubation with KIRCONG chim PEG-NPs (B-C, I-J) and Ctrl PEG-NPs (E-F, L-M). pSTAT3 is shown as rainbow RGB look-up table (C, F, J, M). (G, N) Box plots in which the mean value, the median, the interquartile, and the outliers of the mean fluorescence of pSTAT3 in cytoplasmic and nuclear compartments of MDA-MB-231 (G) and MCF10A cells (N) are shown. ***P< 0.001. N≥12.
Conclusion
SOCS proteins are central to limiting the immune response to cancer and infection and allow crosstalk between cytokines in nonimmune and immune cells.Citation65
TNBC is a type of breast cancer that lacks selective and effective therapy and exhibits high expression levels of transcription factors (TFs) that are essential for its growth. Thus, as a therapeutic strategy, the inhibition of TFs is crucial. SOCS3 acts as a major regulator of STAT3 signaling, as recently demonstrated in neural stem cells (NSCs), where its TAT-KIR mimetic significantly reduced IL-6 stimulated proliferation by inhibiting STAT3 and AKT.
Herein, we present results concerning the PEGylated form of SOCS3 mimetic,Citation23 where the PEG unit connects SOCS3 regions containing the key amino acid residues responsible for JAK2 recognition.
The novel KIRCONG chim PEG proteomimetic was submitted to SAR investigations, which indicated enhanced water solubility and protease stability due to the presence of hydrophilic and unnatural PEG units, as well as an important low micromolar value of dissociation constants in the binding to JAK2. As expected, NMR and MD studies indicated that the substitution of the two βAla with a PEG moiety increased peptide flexibility, even in the presence of a structuring agent such as TFE. However, the importance of this study lies in the novel SOCS3 mimeticCitation66 cell penetration system employed to evaluate the cellular effects of PEGylated peptide: PLGA-based NPs were conceived and fabricated ad hoc to encapsulate SOCS3 mimetics. The ability of the formulated KIRCONG chim PEG to reduce the pro-inflammatory activation of JAK/STAT was analyzed in two cell lines, metastatic human breast cancer (MDA-MB-231) and non-tumorigenic human breast (MCF10A). No relevant differences were observed in the reduction of pSTAT3 levels between the two cell lines. However, it is relevant to underline that the possibility to tune the efficiency encapsulation of peptides into PLGA-based NPs can help into reducing the concentration of NPs that carry the KIRCONG chim PEG and, therefore, the partial NP cytotoxicity that can be in some measure responsible for the pSTAT3 reduction in MCF10A.
The highly flexible conformation of KIRCONG chim PEG hampers the building of a pharmacophoric model and thus the direct translation of this mimetic to a compound endowed with greater drug-like features. In addition, the introduction of chemical constraints is demonstrating very difficult as reported inCitation26 differently from similar studies carried out on SOCS1 protein.Citation44,Citation67 For the cargo system, the cellular effects herein observed represent the proof of concept that SOCS3 peptidomimetics can exert therapeutic effects also if released by PLGA-NPs but in the future their efficacy could be further improved by their decoration with other signal/therapeutic peptides.Citation68
In conclusion, the unprecedented modular approach for the design of proteomimetics of SOCS3, employing PEG moiety to connect different protein regions along with their entrapment into NPs for efficient cellular delivery, provides crucial principles for the development of more effective SBDD antitumor compounds.
Abbreviations
CD, circular dichroism; ESS, extended SH2 subdomain; gp130, glycoprotein 130; JAK2, Janus kinase 2; KIR, kinase inhibitory region; MD, molecular dynamic; MOAs, mechanisms of action; MST, MicroScale Thermophoresis; nAMD, neovascular age-related macular degeneration; NMR, nuclear magnetic resonance; NOESY, nuclear overhauser enhancement spectroscopy; OIR, oxygen-induced retinopathy; PEG, polyethylene glycol; ROESY, rotating frame overhauser enhancement spectroscopy; SBDD, structure-based drug design; SOCS3, suppressor of cytokine signaling 3; TNBC, triple-negative breast cancer; TOCSY, total correlation spectroscopy; UM, uveal melanoma.
Author Contributions
All authors made a significant contribution to the work reported, whether that is in the conception, study design, execution, acquisition of data, analysis and interpretation, or in all these areas; took part in drafting, revising or critically reviewing the article; gave final approval of the version to be published; have agreed on the journal to which the article has been submitted; and agree to be accountable for all aspects of the work.
Disclosure
The authors report no conflicts of interest in this work.
Acknowledgments
We acknowledge the CINECA Awards N. HP10B3JT25, 2020 for the availability of high-performance computing resources and support. This work was supported by Associazione Italiana per la Ricerca sul Cancro (AIRC) grant IG 2022, Rif. 27378 (D.M.) and #NEXTGENERATIONEU (NGEU), Ministry of University and Research (MUR), National Recovery and Resilience Plan (NRRP), project MNESYS (PE0000006) – a multiscale integrated approach to the study of the nervous system in health and disease (DN). 1553 11.10.2022).
References
- Yoshimura A, Ito M, Mise-Omata S, Ando M. SOCS: negative regulators of cytokine signaling for immune tolerance. Inter Immun. 2021;33(12):711–716. doi:10.1093/intimm/dxab055
- Hu X, Li J, Fu M, Zhao X, Wang W. The JAK/STAT signaling pathway: from bench to clinic. Signal Transduct Target Ther. 2021;6(1):402. doi:10.1038/s41392-021-00791-1
- Galic S, Sachithanandan N, Kay TW, Steinberg GR. Suppressor of cytokine signalling (SOCS) proteins as guardians of inflammatory responses critical for regulating insulin sensitivity. Biochem J. 2014;461(2):177–188. doi:10.1042/BJ20140143
- Yoshimura A, Yasukawa H. JAK’s SOCS: a mechanism of inhibition. Immunity. 2012;36(2):157–159. doi:10.1016/j.immuni.2012.01.010
- Croker BA, Kiu H, Nicholson SE. SOCS regulation of the JAK/STAT signalling pathway. Semin Cell Dev Biol. 2008;19(4):414–422. doi:10.1016/j.semcdb.2008.07.010
- Liau NPD, Laktyushin A, Lucet IS, et al. The molecular basis of JAK/STAT inhibition by SOCS1. Nat Commun. 2018;9(1):1558. doi:10.1038/s41467-018-04013-1
- Kershaw NJ, Murphy JM, Liau NP, et al. SOCS3 binds specific receptor-JAK complexes to control cytokine signaling by direct kinase inhibition. Nat Struct Mol Biol. 2013;20(4):469–476. doi:10.1038/nsmb.2519
- Khan MGM, Ghosh A, Variya B, et al. Hepatocyte growth control by SOCS1 and SOCS3. Cytokine. 2019;121:154733. doi:10.1016/j.cyto.2019.154733
- Chu Q, Shen D, He L, Wang H, Liu C, Zhang W. Prognostic significance of SOCS3 and its biological function in colorectal cancer. Gene. 2017;627:114–122. doi:10.1016/j.gene.2017.06.013
- Shang AQ, Wu J, Bi F, et al. Relationship between HER2 and JAK/STAT-SOCS3 signaling pathway and clinicopathological features and prognosis of ovarian cancer. Cancer Biol Ther. 2017;18(5):314–322. doi:10.1080/15384047.2017.1310343
- Lin YC, Lin CK, Tsai YH, et al. Adenovirus-mediated SOCS3 gene transfer inhibits the growth and enhances the radiosensitivity of human non-small cell lung cancer cells. Oncol Rep. 2010;24(6):1605–1612. doi:10.3892/or_00001024
- Speth JM, Penke LR, Bazzill JD, et al. Alveolar macrophage secretion of vesicular SOCS3 represents a platform for lung cancer therapeutics. JCI Insight. 2019;4(20). doi:10.1172/jci.insight.131340.
- Dai L, Li Z, Tao Y, et al. Emerging roles of suppressor of cytokine signaling 3 in human cancers. Biomed Pharmacother. 2021;144:112262. doi:10.1016/j.biopha.2021.112262
- Barclay JL, Anderson ST, Waters MJ, Curlewis JD. SOCS3 as a tumor suppressor in breast cancer cells, and its regulation by PRL. Int J Cancer. 2009;124(8):1756–1766. doi:10.1002/ijc.24172
- Hill GR, Kuns RD, Raffelt NC, et al. SOCS3 regulates graft-versus-host disease. Blood. 2010;116(2):287–296. doi:10.1182/blood-2009-12-259598
- Wang T, Zhou P, Xie X, et al. Myeloid lineage contributes to pathological choroidal neovascularization formation via SOCS3. EBioMedicine. 2021;73:103632. doi:10.1016/j.ebiom.2021.103632
- Yan C, Cao J, Wu M, et al. Suppressor of cytokine signaling 3 inhibits LPS-induced IL-6 expression in osteoblasts by suppressing CCAAT/enhancer-binding protein β activity. J Biol Chem. 2010;285(48):37227–37239. doi:10.1074/jbc.M110.132084
- Lahera A, López‐Nieva P, Alarcón H, et al. SOCS3 deregulation contributes to aberrant activation of the JAK/STAT pathway in precursor T‐cell neoplasms. Br J Haematol. 2023;201(4):718–724. doi:10.1111/bjh.18694
- Liu B, Yao X, Zhang C, et al. PTK6 inhibits autophagy to promote uveal melanoma tumorigenesis by binding to SOCS3 and regulating mTOR phosphorylation. Cell Death Dis. 2023;14(1):55. doi:10.1038/s41419-023-05590-w
- La Manna S, De Benedictis I, Marasco D. Proteomimetics of natural regulators of JAK-STAT pathway: novel therapeutic perspectives. Front Mol Biosci. 2021;8:792546. doi:10.3389/fmolb.2021.792546
- Madonna S, Scarponi C, Morelli M, et al. SOCS3 inhibits the pathological effects of IL-22 in non-melanoma skin tumor-derived keratinocytes. Oncotarget. 2017;8(15):24652–24667. doi:10.18632/oncotarget.15629
- La Manna S, Lee E, Ouzounova M, et al. Mimetics of suppressor of cytokine signaling 3: novel potential therapeutics in triple breast cancer. Int J Cancer. 2018;143(9):2177–2186. doi:10.1002/ijc.31594
- La Manna S, Lopez-Sanz L, Mercurio FA, et al. chimeric peptidomimetics of SOCS 3 able to interact with JAK2 as anti-inflammatory compounds. ACS Med Chem Lett. 2020;11(5):615–623. doi:10.1021/acsmedchemlett.9b00664
- Seo H, Bae H-D, Pyun H, et al. PEGylation improves the therapeutic potential of dimerized translationally controlled tumor protein blocking peptide in ovalbumin-induced mouse model of airway inflammation. Drug Delivery. 2022;29(1):2320–2329. doi:10.1080/10717544.2022.2100511
- Russo A, Aiello C, Grieco P, Marasco D. Targeting ”undruggable” proteins: design of synthetic cyclopeptides. Curr Med Chem. 2016;23(8):748–762. doi:10.2174/0929867323666160112122540
- La Manna S, Leone M, Mercurio FA, Florio D, Marasco D. Structure-activity relationship investigations of novel constrained chimeric Peptidomimetics of SOCS3 protein targeting JAK2. Pharmaceuticals. 2022;15(4):458. doi:10.3390/ph15040458
- Swierczewska M, Lee KC, Lee S. What is the future of PEGylated therapies? Expert Opin Emer Dru. 2015;20(4):531–536. doi:10.1517/14728214.2015.1113254
- Gagliardi A, Giuliano E, Venkateswararao E, et al. Biodegradable polymeric nanoparticles for drug delivery to solid tumors. Front Pharmacol. 2021;12:601626. doi:10.3389/fphar.2021.601626
- Kuna K, Baddam SR, Kalagara S, Akkiraju PC, Tade RS, Enaganti S. Emerging natural polymer-based architectured nanotherapeutics for the treatment of cancer. Int J Biol Macromol. 2024;129434. doi:10.1016/j.ijbiomac.2024.129434
- Merino M, Lozano T, Casares N, et al. Dual activity of PD-L1 targeted Doxorubicin immunoliposomes promoted an enhanced efficacy of the antitumor immune response in melanoma murine model. J Nanobiotechnol. 2021;19(1):1–15. doi:10.1186/s12951-021-00846-z
- De Vita A, Liverani C, Molinaro R, et al. Lysyl oxidase engineered lipid nanovesicles for the treatment of triple negative breast cancer. Sci Rep. 2021;11(1):5107. doi:10.1038/s41598-021-84492-3
- Molinaro R, Martinez JO, Zinger A, et al. Leukocyte-mimicking nanovesicles for effective doxorubicin delivery to treat breast cancer and melanoma. Biomater Sci. 2020;8(1):333–341. doi:10.1039/C9BM01766F
- Creemers JH, Pawlitzky I, Grosios K, et al. Assessing the safety, tolerability and efficacy of PLGA-based immunomodulatory nanoparticles in patients with advanced NY-ESO-1-positive cancers: a first-in-human Phase I open-label dose-escalation study protocol. BMJ open. 2021;11(11):e050725. doi:10.1136/bmjopen-2021-050725
- Mahapatro A, Singh DK. Biodegradable nanoparticles are excellent vehicle for site directed in-vivo delivery of drugs and vaccines. J Nanobiotechnology. 2011;9(1):55. doi:10.1186/1477-3155-9-55
- Russo A, Diaferia C, La Manna S, et al. Insights into amyloid-like aggregation of H2 region of the C-terminal domain of nucleophosmin. Biochim Biophys Acta Proteins Pro. 2017;1865(2):176–185. doi:10.1016/j.bbapap.2016.11.006
- Micsonai A, Wien F, Bulyaki E, et al. BeStSel: a web server for accurate protein secondary structure prediction and fold recognition from the circular dichroism spectra. Nucleic Acids Res. 2018;46(W1):W315–W322. doi:10.1093/nar/gky497
- Griesinger C, Otting G, Wuethrich K, Ernst RR. Clean TOCSY for proton spin system identification in macromolecules. J Am Chem Soc. 1988; 110:7870–7872
- Kumar A, Ernst RR, Wüthrich K. A two-dimensional nuclear Overhauser enhancement (2D NOE) experiment for the elucidation of complete proton-proton cross-relaxation networks in biological macromolecules. Biochem Biophys Res Commun. 1980;95:1–6.
- Bax A, Davis DG, Practical Aspects of Two-Dimensional Transverse Noe Spectroscopy, J Magn Reson. 1985; 63(1) 207–213.
- Piantini U, Sorensen OW, Ernst RR. Multiple quantum filters for elucidating NMR coupling networks. J Am Chem Soc. 1982;104:6800–6801.
- Hwang TL, Shaka AJ. Water suppression that works - excitation sculpting using arbitrary wave-forms and pulsed-field gradients. J Magn Reson Ser A. 1995;112(2):275–279. doi:10.1006/jmra.1995.1047
- Wuthrich K ed. NMR of Proteins and Nucleic Acids. New York: John Wiley & Sons; 1986.
- Bartels C, Xia TH, Billeter M, Guntert P, Wuthrich K. The program XEASY for computer-supported NMR spectral analysis of biological macromolecules. J Biomol NMR. 1995;6(1):1–10. doi:10.1007/BF00417486
- La Manna S, Lopez-Sanz L, Bernal S, et al. Cyclic mimetics of kinase-inhibitory region of suppressors of cytokine signaling 1: progress toward novel anti-inflammatory therapeutics. Eur J Med Chem. 2021;221:113547. doi:10.1016/j.ejmech.2021.113547
- Humphrey W, Dalke A, Schulten K. VMD: visual molecular dynamics. J Mol Graph. 1996;14(1):33–38. doi:10.1016/0263-7855(96)00018-5
- Oakley MT, Oheix E, Peacock AF, Johnston RL. Computational and experimental investigations into the conformations of cyclic tetra-α/β-peptides. J Phys Chem B. 2013;117(27):8122–8134. doi:10.1021/jp4043039
- Wang J, Wang W, Kollman PA, Case DA. Antechamber: an accessory software package for molecular mechanical calculations. J Am Chem Soc. 2001;222(U403):1.
- Oostenbrink C, Villa A, Mark AE, Van Gunsteren WF. A biomolecular force field based on the free enthalpy of hydration and solvation: the GROMOS force‐field parameter sets 53A5 and 53A6. J Comput Chem. 2004;25(13):1656–1676. doi:10.1002/jcc.20090
- Sousa da Silva AW, Vranken WF. ACPYPE-Antechamber python parser interface. BMC Res Notes. 2012;5(1):1–8. doi:10.1186/1756-0500-5-367
- Hess B, Bekker H, Berendsen HJ, Fraaije JG. LINCS: a linear constraint solver for molecular simulations. J Comput Chem. 1997;18(12):1463–1472. doi:10.1002/(SICI)1096-987X(199709)18:12<1463::AID-JCC4>3.0.CO;2-H
- Williams NK, Bamert RS, Patel O, et al. Dissecting specificity in the Janus kinases: the structures of JAK-specific inhibitors complexed to the JAK1 and JAK2 protein tyrosine kinase domains. J Mol Biol. 2009;387(1):219–232. doi:10.1016/j.jmb.2009.01.041
- Morris GM, Huey R, Lindstrom W, et al. AutoDock4 and autoDockTools4: automated docking with selective receptor flexibility. J Comput Chem. 2009;30(16):2785–2791. doi:10.1002/jcc.21256
- Valdés-Tresanco MS, Valdés-Tresanco ME, Valiente PA, Moreno E. gmx_MMPBSA: a new tool to perform end-state free energy calculations with GROMACS. J Chem Theo Comput. 2021;17(10):6281–6291. doi:10.1021/acs.jctc.1c00645
- Pronk S, Páll S, Schulz R, et al. GROMACS 4.5: a high-throughput and highly parallel open source molecular simulation toolkit. Bioinformatics. 2013;29(7):845–854. doi:10.1093/bioinformatics/btt055
- Batycky RP, Hanes J, Langer R, Edwards DA. A theoretical model of erosion and macromolecular drug release from biodegrading microspheres. J Pharm Sci. 1997;86(12):1464–1477. doi:10.1021/js9604117
- Rodrigues de Azevedo, von Stosch M, de Azevedo CR MS, et al. Modeling of the burst release from PLGA micro-and nanoparticles as function of physicochemical parameters and formulation characteristics. Int J Pharm. 2017;532(1):229–240. doi:10.1016/j.ijpharm.2017.08.118
- Allahyari M, Mohit E. Peptide/protein vaccine delivery system based on PLGA particles. Hum Vaccin Immunother. 2016;12(3):806–828. doi:10.1080/21645515.2015.1102804
- Silva AL, Rosalia RA, Sazak A, et al. Optimization of encapsulation of a synthetic long peptide in PLGA nanoparticles: low-burst release is crucial for efficient CD8(+) T cell activation. Eur J Pharm Biopharm. 2013;83(3):338–345. doi:10.1016/j.ejpb.2012.11.006
- Di Natale C, De Rosa D, Profeta M, et al. Design of biodegradable bi-compartmental microneedles for the stabilization and the controlled release of the labile molecule collagenase for skin healthcare. J Mater Chem B. 2021;9(2):392–403. doi:10.1039/D0TB02279A
- Palaniyandi K, Pockaj BA, Gendler SJ, Chang XB. Human breast cancer stem cells have significantly higher rate of clathrin-independent and caveolin-independent endocytosis than the differentiated breast cancer cells. J Cancer Sci Ther. 2012;4(7):214–222. doi:10.4172/1948-5956.1000144
- Hiraga T, Ito S, Nakamura H. Side population in MDA-MB-231 human breast cancer cells exhibits cancer stem cell-like properties without higher bone-metastatic potential. Oncol Rep. 2011;25(1):289–296.
- Panyam J, Labhasetwar V. Dynamics of endocytosis and exocytosis of poly (D, L-lactide-co-glycolide) nanoparticles in vascular smooth muscle cells. Pharm Res. 2003;20(2):212–220. doi:10.1023/A:1022219003551
- Platel A, Carpentier R, Becart E, Mordacq G, Betbeder D, Nesslany F. Influence of the surface charge of PLGA nanoparticles on their in vitro genotoxicity, cytotoxicity, ROS production and endocytosis. J Appl Toxicol. 2016;36(3):434–444. doi:10.1002/jat.3247
- Verderio P, Bonetti P, Colombo M, Pandolfi L, Prosperi D. Intracellular drug release from curcumin-loaded PLGA nanoparticles induces G2/M block in breast cancer cells. Biomacromolecules. 2013;14(3):672–682. doi:10.1021/bm3017324
- Huang S, Liu K, Cheng A, et al. SOCS proteins participate in the regulation of innate immune response caused by viruses. Front Immunol. 2020;11:558341. doi:10.3389/fimmu.2020.558341
- Jha A, Larkin IIIJ, Moore E. SOCS1‐KIR peptide in PEDGA hydrogels reduces pro inflammatory macrophage activation. Macromol biosci. 2023;23(9):2300237. doi:10.1002/mabi.202300237
- La Manna S, Fortuna S, Leone M, et al. Ad-hoc modifications of cyclic mimetics of SOCS1 protein: structural and functional insights. Eur J Med Chem. 2022;243:114781. doi:10.1016/j.ejmech.2022.114781
- Bressler EM, Kim J, Shmueli RB, et al. Biomimetic peptide display from a polymeric nanoparticle surface for targeting and antitumor activity to human triple-negative breast cancer cells. J Biomed Mater Res A. 2018;106(6):1753–1764. doi:10.1002/jbm.a.36360