 ?Mathematical formulae have been encoded as MathML and are displayed in this HTML version using MathJax in order to improve their display. Uncheck the box to turn MathJax off. This feature requires Javascript. Click on a formula to zoom.
Abstract
The cellular uptake mechanism and intracellular fate of self-assembled nanoparticles (NPs) of cholesterol-modified pullulan (CHSP) by human hepatocellular carcinoma (HepG2) cells were investigated. Covalent conjugation with fluorescein isothiocyanate (FITC) yielded stably labeled CHSP (FITC-CHSP), which was successfully formulated into NPs (mean particle size 63.0 ± 1.9 nm) by dialysis. A cytotoxicity assay clearly indicated that the CHSP NPs did not show significant toxicity in HepG2 cells. The effects of NP concentration, incubation time, and temperature on the cellular uptake of the NPs were systematically evaluated by fluorometry, and the results suggested that cellular uptake of the NPs was concentration-,time-, and temperature-dependent. In vitro experiments with endocytic inhibitors revealed that clathrin-mediated endocytosis and macropinocytosis were involved in the internalization of CHSP NPs. The intracellular trafficking study demonstrated that CHSP NPs were entrapped in the lysosomes at 1 hour after incubation; colocalization of NPs with either the Golgi apparatus or the endoplasmic reticula was not observed during the entire course of the study. These results suggested that the CHSP NPs may serve as a versatile carrier for intracellular delivery of therapeutic agents.
Introduction
Pullulan, a water-soluble and linear polysaccharide with maltotriose repeating units joined by α-1,6-linkages, has been used in many research fields, including food, pharmaceutical, and biomedical sciences, due to its biocompatible and biodegradable nature.Citation1–Citation4 Hydrophobically modified pullulan can self-assemble into nanoparticles (NPs) in aqueous media by means of inter- or intramolecular interactions between its hydrophobic moieties, to minimize interfacial free energy. The self-assembled NPs, consisting of a hydrophobic core and hydrophilic shell, have been recognized as a promising drug carrier, since their hydrophobic domain can encapsulate various hydrophobic drugs.Citation5
In recent years, many studies have been carried out to investigate the synthesis and the application of pullulan-based self-assembled NPs as drug delivery systems,Citation6–Citation12 among which, cholesterol-bearing pullulan (CHP), synthesized by the reaction between cholesteryl N-(6-isocynatohexyl)carbamate and pullulan using 1,6-hexyl diisocyanate linkages, has attracted much attention. CHP can form stable hydrogel NPs by self-assembly,Citation13,Citation14 and can then form complexes with various drugs and proteins by hydrophobic interaction and release them upon exposure to specific proteins or cyclodextrin.Citation15–Citation18 The hydrogel NPs can also be used as a drug carrier system in medicineCitation17,Citation19,Citation20 as well as artificial molecular chaperones in biotechnology.Citation21–Citation23 On the basis of these, our group developed a new method to synthesize cholesterol-modified pullulan (CHSP) by directly grafting proper cholesterol residues onto pullulan using succinyl linkages, thus providing a new strategy for the effective and safe synthesis of CHSP. In vitro studies indicated that CHSP self-assembled NPs showed potential as a sustained-release carrier of mitoxantrone.Citation24
To improve the therapeutic potential of the NP-based carriers for intracellular delivery, it is important to understand the cellular uptake mechanism and the intracellular fate of NPs. To date, a few reports have discussed the internalization of self-assembled NPs of hydrophobically modified chitosan into the cells by endocytic pathways.Citation25,Citation26 However, the cellular uptake mechanism and intracellular fate of self-assembled NPs of hydrophobically modified pullulan remains to be understood. Fluorescently labeled NPs can provide a rapid, simple, and sensitive means to quantify cell-associated NPs by fluorometry.Citation27–Citation29 In the present study, fluorescein isothiocyanate (FITC) was covalently bound to the pullulan, and self-assembled NPs of FITC-labeled CHSP (FITC-CHSP) were prepared by dialysis. Human hepatocellular carcinoma cells (HepG2 cells) were chosen as an in vitro model, and the cellular uptake of the NPs was quantified by fluorometry, to investigate the effect of NP concentration, incubation time, and temperature, on the uptake. Meanwhile, several selective endocytosis inhibitors, chlorpromazine, filipin, and amiloride, were selected to study the potential endocytosis mechanism. Furthermore, the intracellular fate of CHSP NPs was investigated by confocal laser scanning microscopy (CLSM).
Materials and methods
Preparation and characterization of FITC-CHSP
The synthetic route of CHSP was described in our previous report.Citation24 FITC-CHSP was prepared by the method of Kaneo et al.Citation30 Briefly, CHSP (1 g) was dissolved in dimethyl sulfoxide (DMSO; Sigma-Aldrich, St Louis, MO, USA) (10 mL) containing a few drops of pyridine. FITC (Sigma-Aldrich; 100 mg) was added, followed by dibutyltin dilaurate (Sigma-Aldrich; 20 mg), and the mixture was heated for 2 hours at 95°C. After several precipitations in ethanol to remove free dye, the FITC-CHSP fraction was filtered off and dried in vacuo at 80°C. The synthesized FITC-CHSP was further dialyzed, in the dark, against deionized water and replaced on a daily basis until no fluorescence was detected in the supernatant. The resultant FITC-CHSP were lyophilized in a freeze dryer and used to prepare the FITC-CHSP NPs as described above. The chemical structure of the FITC-CHSP conjugates obtained was characterized by Fourier transform infrared spectroscopy (FT-IR) (Nicolet™ Nexus 470-ESP; Thermo Fisher Scientific, Waltham, MA, USA).
Labeling efficiency was calculated as the percent weight of conjugated FITC to the weight of FITC-CHSP. To determine the labeling efficiency, the fluorescence intensity of a solution of FITC-CHSP, dissolved in DMSO and appropriately diluted with phosphate-buffered saline (PBS) (pH 7.4), was measured in the fluorometer (LS-50B, PerkinElmer Inc, Waltham, MA, USA) (λexc 490 nm, λemi 520 nm). The fluorometer was calibrated with different concentration FITC standard solutions prepared by diluting 100 μg/mL DMSO solutions of FITC with PBS (pH 7.4).
Preparation and characterization of FITC-CHSP self-assembled NPs
FITC-CHSP self-assembled NPs were prepared by a dialysis method. In brief, FITC-CHSP was dissolved in anhydrous DMSO, and then the solution was transferred into a preswollen dialysis membrane (molecular weight cutoff [MWCO] 12–14 kDa) (SpectraPor® RC; Spectrum Laboratories Inc, Rancho Dominguez, CA, USA) and dialyzed against deionized water for 24 hours at room temperature (deionized water was exchanged at 3-hour intervals). The dialysate was filtered with a 0.45 μm filter to remove the precipitated material. The morphology of the FITC-CHSP self-assembled NPs was observed using a transmission electron microscope (TEM) (JEM-100CXII, JEOL Ltd Tokyo, Japan). The particle size and size distribution of the NPs were measured by dynamic laser light scattering (DLS) (Zetasizer Nano-ZS; Malvern Instruments Ltd Worcestershire, UK).
In vitro release of FITC from NPs
The in vitro release profiles of FITC from the NPs were evaluated as follows: 2 mL of the FITC-CHSP NP suspension was transferred to a dialysis tube (MWCO 12–14 kDa) (D-Tube™ Dialyzer Maxi; EMD Millipore, Billerica, MA, USA), and the dialysis tube was immersed in 10 mL of PBS (pH 7.4). The tube was stirred at 100 rpm at 37°C. At predetermined time intervals, the release medium was collected and the fresh release medium was then added. Each sample was then subjected to centrifugation at 10,000 × g for 8 minutes (5810R Ependorff AG, Hamburg, Germany), and the concentration of FITC in the supernatant was measured in the fluorometer (λexc 490 nm, λemi 520 nm). Unlabeled CHSP NPs were also prepared by dialysis. The fluorometer was calibrated with standard solutions containing 0.002 to 0.1 μg/mL of FITC dissolved in the supernatant generated from unlabeled CHSP NP suspension that underwent the same procedures as above. Analyses were performed in triplicate. The cumulative release percentage (Q%) was calculated by the following equation:
where Cn is the sample concentration at Tn, V is the total volume of release medium, Vi is the sample volume at Ti, Ci is the sample concentration at Ti (both V0 and C0 were equal to zero), and LE% is labeling efficiency.
Cell culture
HepG2 cells were cultured in Dulbecco’s modified Eagle’s medium (DMEM; Thermo Fisher Scientific, Waltham, MA, USA) (25 mmol/L glucose) supplemented with 10% fetal bovine serum (FBS; Sigma-Aldrich), 100 IU/mL penicillin (PAA Laboratories, Pasching, Austria), and 100 μg/mL streptomycin (PAA Laboratories), at 37°C using a humidified 5% CO2 incubator.
Cytotoxicity
The cytotoxicity of CHSP NPs against HepG2 cells was evaluated by 3-(4,5-Dimethylthiazol-2-yl)-2,5-diphenyltetrazolium bromide (MTT) assay (Sigma-Aldrich). The principle of MTT assay is a reduction in metabolic activity, which is an early indication of cellular damage.Citation31 The cells at logarithmic growth phase were seeded in a 96-well plate (Nunc™ Edge 96-Well Plate; Thermo Fisher Scientific) at 5.0 × 10³ cells/well and grown for 24 hours. The culture medium was then replaced by 200 μL of DMEM containing different concentrations of CHSP NPs, and the cells were further incubated for 24 hours and 72 hours, respectively. DMEM without NPs was used for control. Following incubation, the cells were washed three times with the culture medium. Then, 100 μL of DMEM and 20 μL of MTT solution (5 mg/mL in PBS) were added to each well. After incubation for another 4 hours, the MTT medium was removed 150 μL of DMSO was added and then the mixture was shaken for 10 minutes at room temperature to dissolve the reacted dye. The absorbance was measured at 570 nm with a microplate reader (Varioskan Flash; Thermo Fisher Scientific). The percentage of cell viability (CV%) was calculated as follows:
where ODtreat and ODcontrol are the absorbances of the treated cells and the control cells.
NP uptake by Hepg2 cells
The capacity for cellular internalization of FITC-CHSP NPs was visualized and quantified by CLSM and fluorometry respectively. HepG2 cells were seeded at a density of 1.6 × 10⁵ cells/cm2 in glass bottom culture dishes (P35G-0-10-C, MatTek Corp., Ashland MA, USA) and incubated. Subsequently, cells were rinsed twice with PBS (pH 7.4) and replenished with 1 mL serum-free medium containing the FITC-CHSP NPs for different time intervals (0.5, 1, 2, 3, 4, 5, 6 hours). After incubation, test samples were aspirated. Cells were then washed twice with prewarmed PBS before they were fixed in 4% paraformaldehyde. Finally, the fixed cells were counterstained with 4′,6-diamidino-2-phenylindole (DAPI) (Sigma-Aldrich, St Louis, MO, USA) to visualize nuclei and were examined under a CLSM (TCS SL; Leica Microsystems, Wetzlar, Germany).
To quantify the cellular uptake of NPs, cells were plated in 12-well plates (Costar®, Corning Inc, Corning, NY, USA) at a density of 1.6 × 10⁵ cells/cm2 and incubated with a FITC-CHSP NP suspension in serum-free medium, washed three times with PBS (pH 7.4) and then lysed by incubating them with 1 mL of 0.5% Triton™ X-100 (Sigma-Aldrich) in 0.2 N NaOH. Cell-associated FITC-CHSP NPs were quantifed by analyzing the cell lysate in a microplate reader (λexc 490 nm, λemi 520 nm) calibrated with standard solutions containing 3.5 to 60.0 μg/mL of FITC-CHSP NPs in a cell lysate solution (2 × 10⁵ untreated HepG2 cells dissolved in 1 mL of the Triton X-100 solution). Uptake was expressed as the amount (μg) of FITC-CHSP NPs associated with unit weight (mg) of cellular protein. The protein content of the cell lysate was measured using the Pierce BCA Protein Assay kit (Thermo Fisher Scientific).
Initially, the concentration- and time-dependent cellular uptake of NPs was determined. To study the concentration-dependent NP uptake, cells were incubated with different concentrations of NP suspension (0.05–2 mg/mL) for 4 hours. To study the time-dependent NP uptake, cells were incubated with a suspension of NPs (0.15 mg/mL) for different time periods.
Endocytosis inhibition
The effect of temperature block was studied by preincubating the cells at 4°C for 1 hour, followed by treatment with the FITC-CHSP NPs for 2 hours at 4°C.Citation32 To study the effect of various inhibitors on the uptake of NPs, cells were preincubated with the following inhibitors individually, at concentrations which were nontoxic to the cells: 7 μg/mL of chlorpromazine (Sigma-Aldrich),Citation33,Citation34 to inhibit the clathrin-mediated endocytosis, 1 μg/mL of filipin (Sigma-Aldrich),Citation32 to inhibit caveolae-mediated endocytosis, or 50 μM amiloride (Sigma-Aldrich),Citation26 to inhibit macropinocytosis. Following the preincubation for 1 hour at 37°C, the inhibitor solutions were removed and the freshly prepared FITC-CHSP NPs, in medium containing inhibitors at the same concentrations, were added and further incubated for 2 hours. Subsequently, the cells were washed three times with PBS and analyzed according to the methods mentioned above. The group in the presence of FITC-CHSP NPs but without inhibitor treatment was used as control, and their uptake was expressed as 100%.
Investigation of intracellular fate of CHSP NPs
To study the intracellular fate of CHSP NPs, immunofluorescence staining was used to identify the Golgi apparatus, endoplasmic reticula (ER), and lysosomes. The antibodies used in the study were mouse monoclonal Anti-Giantin antibody (9B6) – Golgi Marker (ab37266; Abcam, Cambridge, UK), mouse monoclonal Anti-Calnexin ER membrane marker antibody (AF18) (ab31290; Abcam), mouse monoclonal Anti-lysosomal-associated membrane protein [LAMP]2 antibody (H4B4) – Lysosome marker (ab25631; Abcam), and goat Anti-Mouse IgG (H+L), CF™ 647 antibody (SAB4600182; Sigma-Aldrich). Briefly, cells were treated with the FTIC-CHSP NPs in the serum-free medium. After incubation, at predetermined time points, cells were washed twice with the prewarmed PBS, fixed in 4% paraformaldehyde, and then washed an additional three times with PBS. Cells were permeabilized (with PBS containing 0.3% Triton X-100 [v/v], 0.1% bovine serum albumin (BSA; Sigma-Aldrich) [w/v]) for 15 minutes at room temperature. The samples were blocked with dilution buffer (PBS containing 10% goat serum (v/v), 0.3 M glycine) for 1 hour and then incubated with the primary antibody (1:200 for Golgi marker; 1:1000 for ER membrane marker and Lysosome marker) for 1 hour at room temperature. Cells were washed three times with permeabilization buffer and then incubated with the secondary antibody (1:1000, goat anti-mouse IgG (H+L), CF 647A antibody) for 45 minutes at room temperature. After the secondary antibody incubation, cells were washed twice with the permeabilization buffer, counterstained to visualize nuclei with DAPI, and examined by CLSM (LSM 710; Carl Zeiss Meditec Inc, Jena, Germany).
Statistical analysis
All data were presented as mean ± standard deviation. Statistical analysis was conducted by using the Student’s t-test, with P < 0.05 as the significant difference.
Results and discussion
Characterization of FITC-CHSP
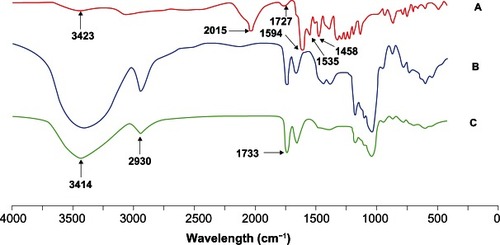
In this study, CHSP (with the substitution of 5.40 cholesterol residues per 100 glucose units in the pullulan), was used to prepare FITC-CHSP. shows the FT-IR spectra of FITC, CHSP, and FITC-CHSP. The spectra of FITC () displayed a hydroxy characteristic peak at 3423 cm−1 and a strong isothiocyanate characteristic peak at 2015 cm−1 as well as a characteristic peak assigned to the carbonyl group of lactone, at around 1727 cm−1. Furthermore, the absorption peaks at 1594, 1535, and 1458 cm−1 were characteristics of benzene ring stretching vibration. For FITC-CHSP (), the peak at 2930 cm−1 was attributed to the stretching vibration of methyl and methylene groups, and the characteristic peak observed at 1733 cm−1 was assigned to the carbonyl group. Compared with FITC, the isothiocyanate characteristic peak at 2015 cm−1 disappeared in the spectra of FITC-CHSP, which suggested the isothiocyanate group was involved in the addition reaction with the hydroxyl group. The labeling efficiency, calculated as the percent weight of conjugated FITC to weight of FITC-CHSP, was 3.0%.
Figure 1 FT-IR spectra of (A) FITC (B) CHSP and (C) FITC-CHSP.
Abbreviations: CHSP, cholesterol-modified pullulan; FITC, fluorescein isothiocyanate; FT-IR, Fourier transform infrared spectroscopy.
Characterization of FITC-CHSP self-assembled NPs
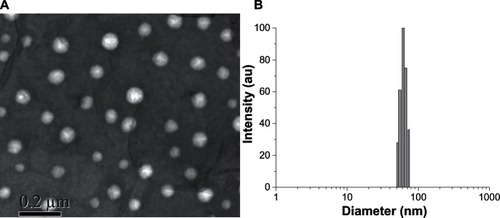
The amphiphilic FITC-CHSP conjugates can form self-assembled NPs in aqueous solution, due to hydrophobic inter- and intramolecular interactions. shows the morphological characteristics of the FITC-CHSP NPs. The NPs had an almost spherical shape and were well dispersed, without any aggregation. Since all the uptake study was performed in serum-free medium, we characterized NPs suspended in serum-free medium. shows the particle size distribution of FITC-CHSP NPs, as measured by DLS. The results indicate that the average diameter of NPs was 63.0 ± 1.9 nm, with a narrow size distribution. In addition, the mean diameter of NPs was not remarkably changed for 3 weeks, and no precipitates were found in the solution.
Figure 2 (A) Morphological characteristics and (B) size distribution of FITC-CHSP NPs, as determined by TEM and DLS, respectively.
Abbreviations: DLS, dynamic light scattering; FITC-CHSP, fluorescein isothiocyanate-labeled cholesterol-modified pullulan; NP, nanoparticle; TEM, transmission election microscopy.
In vitro release of FITC from NPs
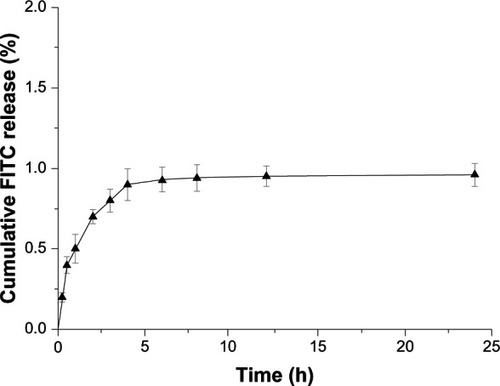
The use of fluorescent markers in NP visualization can lead to the misinterpretation of NP uptake data, due to the leaching or dissociation of fluorescent markers into the released mediumCitation35 and hence, subsequently into the cells. Thus, the in vitro release study of FITC from FITC-CHSP NPs was conducted, and the results were shown in . It can be found that less than 1% of the conjugated FITC was released over 24 hours, which was considered negligible in comparison with the NP uptake outcome of the HepG2 cells. It is thus reasonable to assume that most of the FITC was associated in the NPs and that the fluorescence measured from the uptake samples mainly reflects the cellular-associated fluorescent NPs but not the released fluorescence in the medium.
Figure 3 In vitro release profiles of FITC from FITC-CHSP NPs in PBS (pH 7.4), at 37°C.
Note: Data represents means ± SD (n = 3).
Abbreviations: CHSP, cholesterol-modified pullulan; FITC, fluorescein isothiocyanate; NP, nanoparticle; PBS, phosphate-buffered saline; SD, standard deviation.
Cytotoxicity
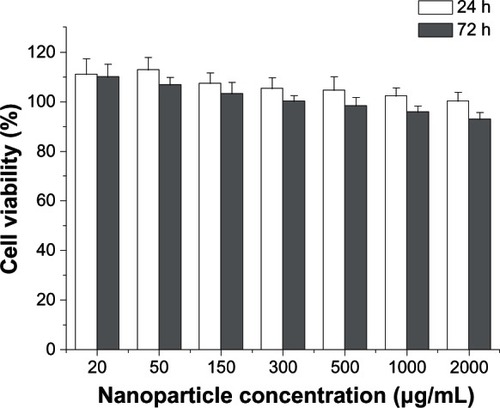
To test the safety of CHSP NPs, we evaluated the cytotoxicity to HepG2 proliferation over a range of concentrations (20, 50, 150, 300, 500, 1000, and 2000 μg/mL). As shown in , after a 24-hour exposure to CHSP NPs at different concentrations, the cell viabilities of HepG2 cells were all over 100%. Furthermore, CHSP NPs did not show significant toxicity at the concentrations applied in this study, at 72 hours. The cell viability of HepG2 cells was up to 93.0%, even at the highest concentration tested (2000 μg/mL) for 72 hours, which clearly indicated that CHSP NPs exhibited excellent cell viability in HepG2 cells. NP uptake by hepg2 cells
Figure 4 Cytotoxicity of CHSP NPs against hepg2 cells.
Note: Data represents means ± SD (n = 6).
Abbreviations: CHSP, cholesterol-modified pullulan; HepG2, hepatocellular carcinoma; NP, nanoparticle; SD, standard deviation.
NP uptake by HepG2 cells
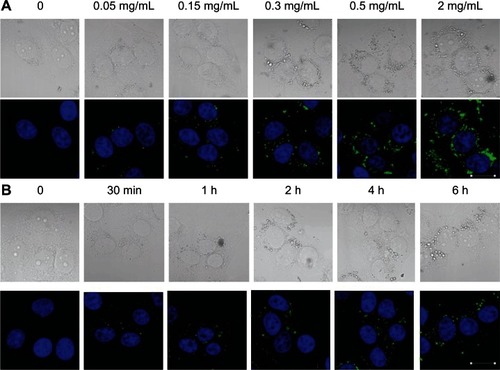
CLSM images of cellular uptake of CHSP NPs as a function of NP concentration and incubation time were shown in . Evidently, the degree of NP uptake was clearly concentration-dependent in the studied concentration range of 0.05 mg/mL to 2 mg/mL (). To investigate the effect of incubation time on NP uptake, CHSP NPs (0.15 mg/mL) were added to the cultured HepG2 cells and incubated at 37°C. At 30 minutes postincubation, the fluorescence signal from the CHSP NPs was detected primarily near the cellular membrane (). As the incubation time increased, the CHSP fluorescence became more intense inside the cells. However, there was no visible difference in fluorescence intensity beyond the 4-hour incubation.
Figure 5 Cellular uptake profile of CHSP NPs as a function of (A) NP concentration (4 hours, 37°C) and (B) incubation time (0.15 mg/mL, 37°C).
Notes: HepG2 cells were incubated with FITC-CHSP NPs under the condition indicated above each image, and the samples were prepared for CLSM investigation (scale bar, 20 μm).
Abbreviations: CHSP, cholesterol-modified pullulan; CLSM, confocal laser scanning microscopy; FITC, fluorescein isothiocyanate; HepG2, hepatocellular carcinoma; NP, nanoparticle.
To quantify the cellular uptake of CHSP NPs, a series of standard solutions containing different amounts of FITC-CHSP NPs in a cell lysate solution (2 × 10⁵ untreated HepG2 cells dissolved in 1 mL of the Triton X-100 solution) were tested to determine the linear relationship between the concentration of FITC-CHSP NPs and the corresponding fluorescence intensity. The results showed that fluorescence intensity (F) in the cell lysate solution varied linearly with concentration (C) of FITC-CHSP NPs in the range of 3.5 to 60.0 μg/mL, obeying the following linear regression:
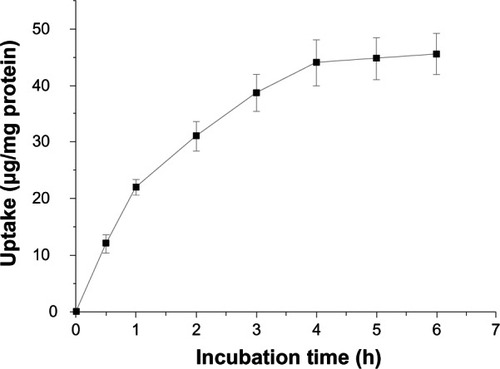
As shown in , the uptake of CHSP NPs by the HepG2 cells was concentration-dependent, and the uptake amount increased with increasing NP concentration from 0.05 to 2.0 mg/mL, while the efficiency of uptake was reduced at higher doses. indicates that uptake of CHSP NPs by HepG2 cells at 37°C was also dependent on the incubation time and increased with the incubation time over a 4-hour period. However, the NP uptake had no significant further increase beyond 4 hours, since the curves showed a plateau effect after that time, which could be due to the limited saturation level.
Figure 6 Effect of NP concentration on cellular uptake by hepg2 cells, at 37°C.
Notes: Various NP concentrations ranging from 0.05 to 2 mg/mL were applied to the HepG2 culture for 4 hours. Data represents mean ± SD (n = 4).
Abbreviations: HepG2, hepatocellular carcinoma; NP, nanoparticle; SD, standard deviation.
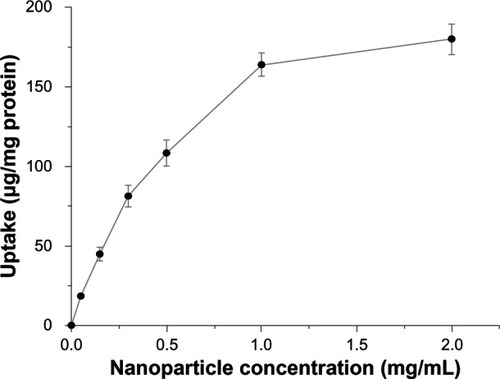
Figure 7 Effect of incubation time on NP uptake by hepg2 cells, at 37°C.
Notes: The concentration of NPs used was 0.15 mg/mL. Data represents mean ± SD (n = 4).
Abbreviations: HepG2, hepatocellular carcinoma; NP, nanoparticle; SD, standard deviation.
Endocytosis inhibition
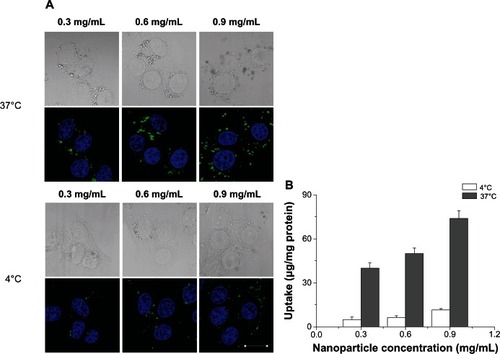
Temperature-dependent uptake studies were carried out with three different NP concentrations (0.3, 0.6, and 0.9 mg/mL) at both 37°C and 4°C. There was a significant reduction (P < 0.05) in CHSP NP uptake by HepG2 cells at 4°C, with the uptake being reduced to 12%–15% of that at 37°C at equivalent dosing concentrations (). These results suggest that an energy-dependent endocytic process could be responsible for up to about 88% of NP uptake, while physical adhesion or diffusion probably describes the remaining uptake of NPs.
Figure 8 Effect of temperature on nanoparticle uptake by hepg2 cells. (A) Confocal images showing cellular uptake of CHSP NPs; (B) quantification of cellular uptake of CHSP NPs by fluorometry.
Notes: Two different temperatures 4°C and 37°C were used to evaluate the uptake of three different concentrations of NPs (0.3, 0.6, and 0.9 mg/mL). For (A), the scale bar = 20 μm; Data in (B) represent mean ± SD (n = 4).
Abbreviations: CHSP, cholesterol-modified pullulan; HepG2, hepatocellular carcinoma; NP, nanoparticle; SD, standard deviation.
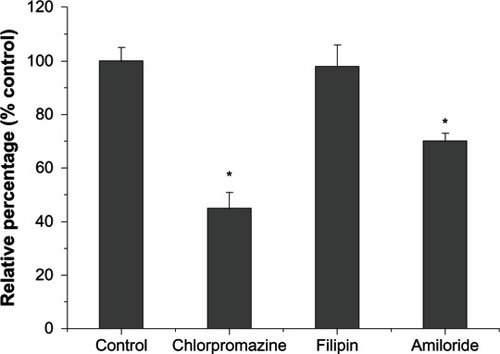
To elucidate their potential cellular uptake pathways, the interaction between CHSP NPs and cell membranes was investigated by treating the cells with different chemical inhibitors, of clathrin-mediated endocytosis, macropinocytosis, and caveolae-mediated endocytosis, and then analyzed by fluorometry. The inhibition of clathrin-mediated endocytosis was tested by using the cationic amphiphilic drug chlorpromazine, which causes clathrin to accumulate in late endosomes, thereby inhibiting coated pit endocytosis.Citation36–Citation39 Compared with the control, the cellular uptake of CHSP NPs was reduced by ~55% (P < 0.05) (), indicating that clathrin-mediated endocytosis may be involved. Caveolae, a specialized type of lipid rafts, are flask-shaped invaginations in the plasma membrane, enriched in proteins as well as cholesterol and sphingolipids.Citation40,Citation41 Filipin (1 μg/mL), an inhibitor of caveolae-mediated transport processes,Citation42 did not affect NP uptake by the HepG2 cells (P > 0.05), which might be due to the absence of caveosomes in HepG2 cells, as reported in the literature.Citation43 Alternatively, the cells treated with amiloride (50 μM), a specific inhibitor of the Na+/H+ exchange required for macropinocytosis,Citation44 caused a significant decrease in NP uptake by ~30% (P < 0.05). Taken together, our inhibition studies suggest that clathrin-mediated endocytosis and macropinocytosis may be involved in the internalization of CHSP NPs.
Figure 9 Effect of endocytic inhibitor on the internalization of FITC-CHSP NPs.
Notes: Hepg2 cells were pretreated with chlorpromazine (7 μg/mL), filipin (1 μg/mL), or amiloride (50 μM), in serum-free medium for 1 hour, and then treated with FITC-CHSP NPs (0.15 mg/mL, 2 hours, 37°C). The group in the presence of FITC-CHSP NPs but without inhibitor treatment was used as control, and their uptake was expressed as 100%. *P < 0.05, compared with the control value.
Abbreviations: FITC-CHSP, fluorescein isothiocyanate-labeled cholesterol-modified pullulan; HepG2, hepatocellular carcinoma; NP, nanoparticle.
Investigation of intracellular fate of CHSP NPs
Generally, NPs are taken up by cellular systems through endocytosis.Citation45 Endocytosis, via clathrin-coated pits or uncoated pits (fluid phase), transfers materials to the lysosomal degradative compartment, while caveolae-mediated endocytosis can result in translocation to the ER, Golgi, or through the cell by trancytosis.Citation46 Understanding the intracellular fate of NPs with respect to their uptake pattern is crucial in designing a new macromolecular carrier.
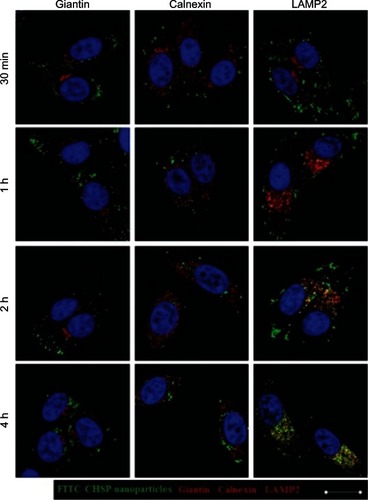
Here, to track the CHSP NPs, Golgi apparatus, ER, and lysosomes were immunofluorescently stained. The position of the nucleus in each cell was labeled with DAPI staining. The intracellular localization of the CHSP NPs was traced at different time points. As shown in , the colocalization of NPs with either the Golgi apparatus (shown by Giantin) or the ER (shown by Calnexin) was not observed throughout the entire course of the study. Instead, NPs were found colocalized with lysosomes (shown by LAMP2), at 1 hour after incubation. Interestingly, as the incubation time increased, the NPs entrapped in the lysosomal compartments gradually migrated toward the perinuclear region. A similar study showed the time-dependent movement of HeLa lysosomes containing hydrophobically modified glycol chitosan NPs toward the nucleus.Citation26
Figure 10 Confocal images of the intracellular trafficking of CHSP NPs at the indicated times using immunofluorescence staining to identify the Golgi apparatus (giantin), endoplasmic reticula (Calnexin), and lysosomes (LAMP2).
Notes: The nucleus in each cell was labeled with DAPI staining (blue color). Colocalization of NPs (green color) with either the golgi apparatus (Giantin, red color) or the ER (Calnexin, red color) was not observed. Instead, NPs were found colocalized with lysosomes (LAMP2, yellow color in merged images) at 1 hour. Scale bar = 20 μm.
Abbreviations: CHSP, cholesterol-modified pullulan, LAMP2, lysosomal-associated membrane protein 2; NP, nanoparticle.
Conclusion
In conclusion, the cellular uptake of CHSP NPs was concentration-, time-, and temperature-dependent. Pretreatment of HepG2 cells with several endocytic inhibitors (eg, chlorpromazine, filipin, and amiloride) indicated that more than one mechanism was involved simultaneously in the NP uptake. Moreover, colocalization studies showed that some of the CHSP NPs were trapped in the lysosomal compartment, while colocalization of NPs with either the Golgi apparatus or the ER was not observed during the entire course of the study. In summary, our findings suggest that the CHSP NPs have potential for improving drug delivery in the treatment of lysosomal storage diseases, cancer, and Alzheimer’s disease.
Acknowledgment
This work was supported by the Doctoral Fund of the Ministry of Education of The People’s Republic of China (Grant No 20101106110042).
Disclosure
The authors declare no conflicts of interest in this work.
References
- SinghRSSainiGKKennedyJFPullulan: Microbial sources, production and applicationsCarbohyd Polym2008734515531
- RekhaMRSharmaCPPullulan as a promising biomaterial for biomedical applications: a perspectiveTrends Biomater Artif Organs2007202116121
- LeathersTDBiotechnological production and applications of pullulanAppl Microbiol Biotechnol2003625–646847312830329
- ShingelKICurrent knowledge on biosynthesis, biological activity, and chemical modification of the exopolysaccharide, pullulanCarbohydr Res2004339344746015013381
- LiuZJiaoYWangYZhouCZhangZPolysaccharides-based nanoparticles as drug delivery systemsAdv Drug Deliver Rev2008601516501662
- JeongYINaHSOhJSChoiKCSongCELeeHCAdriamycin release from self-assembling nanospheres of poly(DL-lactide-co-glycolide)-grafted pullulanInt J Pharm20063221–215416016891068
- ZhangHZGaoFPLiuLRPullulan acetate nanoparticles prepared by solvent diffusion method for epirubicin chemotherapyColloids Surf B Interfaces20097111926
- JungSWJeongYIKimSHCharacterization of hydrophobized pullulan with various hydrophobicitiesInt J Pharm2003254210912112623187
- ZhangHZLiXMGaoFPLiuLRZhouZMZhangQQPreparation of folate-modified pullulan acetate nanoparticles for tumor-targeted drug deliveryDrug Deliv2010171485722747075
- NaKLeeKHBaeYHpH-sensitivity and pH-dependent interior structural change of self-assembled hydrogel nanoparticles of pullulan acetate/oligo-sulfonamide conjugateJ Control Release200497351352515212883
- HuangLChenHZhengYNanoformulation of D-α-tocopheryl polyethylene glycol 1000 succinate-b-poly(ɛ-caprolactone-ran-glycolide) diblock copolymer for breast cancer therapyIntegr Biol (Camb)2011310993100221938302
- NaKBurn LeeTParkKHShinEKLeeYBChoiHKSelf-assembled nanoparticles of hydrophobically-modified polysaccharide bearing vitamin H as a targeted anti-cancer drug delivery systemEur J Pharm Sci200318216517312594010
- AkiyoshiKDeguchiSMoriguchiNYamaguchiSSunamotoJSelf-aggregates of hydrophobized polysaccharides in water. Formation and characteristics of nanoparticlesMacromolecules1993261230623068
- AkiyoshiKDeguchiSTajimaTNishikawaTSunamotoJMicroscopic structure and thermoresponsiveness of a hydrogel nanoparticle by self-assembly of a hydrophobized polysaccharideMacromolecules1997304857861
- NishikawaTAkiyoshiKSunamotoJSupramolecular assembly between nanoparticles of hydrophobized polysaccharide and soluble protein complexation between the self-aggregate of cholesterol-bearing pullulan and a-chymotrypsinMacromolecules1994272676547659
- NishikawaTAkiyoshiKSunamotoJMacromolecular complexation between bovine serum albumin and the self-assembled hydrogel nanoparticle of hydrophobized polysaccharidesJ Am Chem Soc19961182661106115
- AkiyoshiKKobayashiSShichibeSSelf-assembled hydrogel nanoparticle of cholesterol-bearing pullulan as a carrier of protein drugs: complexation and stabilization of insulinJ Control Release19985433133209766251
- AkiyoshiKSasakiYKurodaKSunamotoJControlled association of hydrophobized polysaccharide by cyclodextrinChem Lett19982719394
- TaniguchiIAkiyoshiKSunamotoJSudaYYamamotoMCell specificity of macromolecular assembly of cholesteryl and galactoside groups-conjugated pullulanJ Bioact Compat Polym1999143195212
- MeiLZhangZZhaoLPharmaceutical nanotechnology for oral delivery of anticancer drugsAdv Drug Deliv Rev Epub1272012
- NomuraYIkedaMYamaguchiNAoyamaYAkiyoshiKProtein refolding assisted by self-assembled nanogels as novel artificial molecular chaperoneFEBS Lett2003553327127614572636
- HirakuraTNomuraYAoyamaYAkiyoshiKPhotoresponsive nanogels formed by the self-assembly of spiropyrane-bearing pullulan that act as artificial molecular chaperonesBiomacromolecules2004551804180915360291
- NomuraYSasakiYTakagiMNaritaTAoyamaYAkiyoshiKThermoresposive controlled association of protein with a dynamic nanogel of hydrophobized polysaccharide and cyclodextrin: heat shock protein-like activity of artificial molecular chaperoneBiomacromolecules20056144745215638551
- YangWZChenHLGaoFPSelf-aggregated nanoparticles of cholesterol-modified pullulan conjugate as a novel carrier of mitoxantronepCurr Nanosci201063298306
- ChiuYLHoYCChenYMThe characteristics, cellular uptake and intracellular trafficking of nanoparticles made of hydrophobically-modified chitosanJ Control Release2010146115215920580915
- NamHYKwonSMChungHCellular uptake mechanism and intracellular fate of hydrophobically modified glycol chitosan nanoparticlesJ Control Release2009135325926719331853
- DelieFEvaluation of nano- and microparticle uptake by the gastrointestinal tractAdv Drug Deliver Rev1998342–3221223
- ZhangYTangLSunLA novel paclitaxel-loaded poly(epsilon-caprolactone)/Poloxamer 188 blend nanoparticle overcoming multidrug resistance for cancer treatmentActa Biomater2010662045205219969111
- MaYZhengYZengXNovel docetaxel-loaded nanoparticles based on PCL-Tween 80 copolymer for cancer treatmentInt J Nanomedicine201162679268822114498
- KaneoYTanakaTNakanoTYamaguchiYEvidence for receptor-mediated hepatic uptake of pullulan in ratsJ Control Release200170336537311182206
- MosmannTRapid colorimetric assay for cellular growth and survival: application to proliferation and cytotoxicity assaysJ Immunol Methods1983651–255636606682
- PerumalOPInapagollaRKannanSKannanRMThe effect of surface functionality on cellular trafficking of dendrimersBiomaterials20082924–253469347618501424
- RekhaMRSharmaCPBlood compatibility and in vitro transfection studies on cationically modified pullulan for liver cell targeted gene deliveryBiomaterials200930346655666419726082
- HuangMMaZKhorELimLYUptake of FITC-chitosan nanopar-ticles by A549 cellsPharm Res200219101488149412425466
- SuhHJeongBLiuFKimSWCellular uptake study of biodegradable nanoparticles in vascular smooth muscle cellsPharm Res1998159149514989755907
- RekhaMRSharmaCPHemocompatible pullulan-polyethyleneimine conjugates for liver cell gene delivery: In vitro evaluation of cellular uptake, intracellular trafficking and transfection efficiencyActa Biomater20117137037920659595
- ChoiYThomasTKotlyarAIslamMTBakerJRJrSynthesis and functional evaluation of DNA-assembled polyamidoamine dendrimer clusters for cancer cell-specific targetingChem Biol2005121354315664513
- RejmanJBragonziAConeseMRole of clathrin-and caveolae-mediated endocytosis in gene transfer mediated by lipo- and polyplexesMol Ther200512346847415963763
- LaiSKHidaKManSTPrivileged delivery of polymer nano-particles to the perinuclear region of live cells via a non-clathrin, non-degradative pathwayBiomaterials200728182876288417363053
- PartonRGSimonsKThe multiple faces of caveolaeNat Rev Mol Cell Biol20078318519417318224
- MayorSPaganoREPathways of clathrin-independent endocytosisNat Rev Mol Cell Biol20078860361217609668
- OrlandiPAFishmanPHFilipin-dependent inhibition of cholera toxin: evidence for toxin internalization and activation through caveolae-like domainsJ Cell Biol199814149059159585410
- FujimotoTKogoHNomuraRUneTIsoforms of caveolin-1 and caveolar structureJ Cell Sci2000113Pt 193509351710984441
- HewlettLJPrescottARWattsCThe coated pit and macropinocytic pathways serve distinct endosome populationsJ Cell Biol199412456897038120092
- JonesATGumbletonMDuncanRUnderstanding endocytic pathways and intracellular trafficking. A prerequisite for effective design of advanced drug delivery systemsAdv Drug Deliv Rev200355111353135714597135
- MooreMNDo nanoparticles present ecotoxicological risks for the health of the aquatic environment?Environ Int200632896797616859745