Abstract
Polyethylene glycol (PEG)-ylation is a widely used strategy to fabricate nanocarriers with a long blood circulation time. Further elaboration of the contribution of the surface PEGylation pattern to biodistribution is highly desirable. We fabricated a series of polyion complex (PIC) micelles PEGylated with different ratios (PEG2k and PEG550). The plasma protein adsorption, murine macrophage uptake, and in vivo biodistribution with iodine-125 as the tracer were systematically studied to elucidate the impact of PEGylation patterns on the biodistribution of micelles. We demonstrated that the PEGylated micelles with short hydrophilic PEG chains mixed on the surface were cleared quickly by the reticuloendothelial system (RES), and the single PEG2k PEGylated micelles could efficiently prolong the blood circulation time and increase their deposition in tumor sites. The present study extends the understanding of the PEGylation strategy to further advance the development of ideal nanocarriers for drug delivery and imaging applications.
Introduction
With unique physical and chemical properties, engineered nanoparticles display various interactions with biological environments.Citation1 The nanoparticle/biological interface, which depends on colloidal forces, has received extensive attention in the design of nanocarriers for drug delivery and imaging enhancement. Upon entry into biological environments, different blood proteins would be adsorbed onto the nanoparticle surfaces, depending on the initial physicochemical properties, and form protein coronas, which give them distinct biological identities. Most of these proteins, such as immunoglobins, fibronectin, thrombospondin, and components of the complement system, are opsonins that bind the nanoparticles and recognize the scavenger receptors on the surface of macrophage cells. As a result, the nanoparticles could easily be cleared by macrophage cells of the reticuloendothelial system (RES).Citation2 In this regard, most nanoparticles with organic and synthetic surfaces face rapid clearance by organs of the RES after intravenous (IV) injection. In addition, the uncontrollable and unpredictable localization of nanoparticles after IV injection has created a barrier to efficient cancer diagnosis and therapy. Tailoring the physicochemical properties of the engineered nanoparticles has become a major focus of nanomedicine research.
The protein coronas change the original conformation of the synthetic nanoparticles, and the altered identity plays an important role in biological applications. Recent studies suggest that the composition of the protein coronas and the bio-interactions were determined by the original properties of the synthetic nanoparticles.Citation3–Citation6 Many physicochemical properties, including size, charge, surface modifications, core compositions, and targeting ligand functionalization can substantially affect the biodistribution of nanoparticles after IV administration.Citation7 In order to prolong blood residence time, reduce accumulation in RES organs, and eventually increase the targeted efficiency of nanoparticles in tumor tissues, endeavors have been made to search for ideal drug-delivery nanocarriers. Particle size has been considered a key parameter for preparing long-circulating nanoparticles and obtaining improved therapeutic efficacy. It has been reported that the ideal size of nanoparticles for cancer therapy is between 70 and 200 nm.Citation8 Furthermore, Yamamoto et alCitation9 reported that nanoparticles with slightly negative surface charges were less likely to be captured by RES organs such as the liver or spleen. Furthermore, several polymers, such as polysaccharides, have been used to coat nanoparticles to efficiently increase circulation time.Citation10 Among the various approaches, polyethylene glycol (PEG)-ylation is the most widely used strategy to create a steric barrier on the surface of nanoparticles.Citation11,Citation12 Benefiting from its hydrophilicity, the large excluded volume, and the excellent interaction with surrounding water of the biological medium, PEG is considered a good candidate to prevent protein adsorption. Although the mechanism is still controversial due to the extraordinarily complicated biological environment, it is suggested that nanoparticles coated with PEG could delay opsonization and reduce subsequent macrophage recognition. Branched PEG, PEG-containing block copolymers, and non-covalent PEGylation have often been employed to PEGylate nanoparticles. Depending on the PEGylation strategy, the blood half-lives of nanoparticles vary from minutes to hours, and some can be as long as 24 hours.Citation13–Citation16 Undoubtedly, many nanocarriers with good in vivo performances benefit from PEGylation. However, as ParkCitation17 has pointed out, PEGylation is still not clearly understood, and further investigation is needed to advance PEGylation. Thus, PEGylation patterns should be further studied to expand our knowledge of PEGylation.
Most studies have focused on the grafting density of PEG with specific length on the surface of nanomaterials and the effect of PEG density on their in vivo behaviors.Citation18–Citation21 Here, we designed a novel investigation method to intensively research the widely used PEGylation strategy. Kataoka and colleaguesCitation22–Citation24 reported that polyion complex (PIC) micelles prepared from polymers with opposite charges were efficient nanocarriers for drug delivery. In the present study, PIC micelles self-assembled through electrostatic interaction of poly(ethylene glycol)45-block-poly(L-lysine) (PEG45-b-PLys) and poly(ethylene glycol)12-block-poly(aspartic acid) (PEG12-b-PAsp) with mixed PEG lengths were used as models to explore the impact of PEGylation patterns on the in vivo biodistribution of nanomaterials. We fabricated a series of PIC micelles with mole ratios of PEG2k and PEG550 on the surface. The chloramines-T method was used to label the core of micelles with iodine-125 (125I). We systematically investigated the in vivo biodistribution of different micelles determined via Gamma counter and Gamma camera imaging at various time points in tumor-bearing BALB/c mice. Furthermore, the plasma protein adsorption and macrophage uptake of different micelles were also investigated to determine the effect of micelles with various mixed-length PEG. By investigation of the relative properties of PEGylated nanoparticles in biological environments, this work provides insightful understanding of PEGylation.
Experimental section
Materials
α-Methoxy-ω-aminopoly(ethylene glycol) (CH3O-PEG-NH2; Mw=2,000 or 550; Mw/Mn=1.05) (Mw, the weight- average molecular weight; Mn, the number-average molecular weight) was purchased from J&K Chemical (Beijing, People’s Republic of China) and used after being dried under vacuum. β-benzyl-aspartate-N-carboxyanhydride (BLA-NCA) and ε-(benzyloxycarbonyl)-L-lysine N- carboxyanhydride (Lys(Z)-NCA) were synthesized via the Fuchs-Farthing method using bis(trichloromethyl) carbonate (triphosgene).Citation25 N,N-Dimethylformamide (DMF) was dehydrated using activated molecular sieves (4 Å) and distilled over CaH2 under reduced pressure. N-Butylamine, dichloromethane (CH2Cl2) and methanol (MeOH) were redistilled before use. 1-Ethyl-3-(3-dimethylaminopropyl) carbodiimide hydrochloride (EDC·HCl; ≥98%, Fluka, Shanghai, People’s Republic of China), N-hydroxysuccinimide (NHS; ≥97%, Fluka), trifluoroacetic acid, hydrogen bromide (HBr; 45% in acetic acid), L-tyrosine (99%, Alfa, Beijing, People’s Republic of China), fluorescein isothiocyanate (FITC; 99.5%, J&K Chemical, Beijing, People’s Republic of China) and other chemicals and solvents were used as received. 125I (half-life of 59.6 days) was provided by PerkinElmer (PerkinElmer Inc, CA, USA). 3-(4,5-dimethylthiazol-2-yl)-2,5-diphenyl tetrazolium bromide (MTT), dimethyl sulfoxide (DMSO), and all cell culture media and supplies were from Gibco (Gibco Corporation, Grand Island, NY, USA). NIH-3T3 (mouse embryonic fibroblast cell line), HepG2 (human liver hepatocellular carcinoma cell line) and RAW 264.7 (mouse macrophage-like cell line) cells were cultured in Roswell Park Memorial Institute (RPMI)-1640 medium. The medium was supplemented with 10% fetal bovine serum, 100 U/mL penicillin, and 100 μg/mL streptomycin. The BALB/c mice (average 22 g) were purchased from the Laboratory Animal Center of The Academy of Military Medical Sciences (Beijing, People’s Republic of China).
Synthesis of polymers
The relevant polymers, including PEG45-b-PLys32, PEG45-b-PAsp36, PEG12-b-PAsp16, PAsp42, PLys18, PEG45-b-P(Lys24-co-LysFITC8), and PEG45-b-P(Lys31.7-co-LysTyrosine [Tyr]0.3) were synthesized by ring-opening polymerization (ROP) using CH3O-PEG2k-NH2, CH3O-PEG550-NH2, and N-Butylamine as initiator, respectively, and the side-chain modification methods. The details of synthesis procedures and characterizations are described in the supplementary material. The synthesis scheme and the 1H nuclear magnetic resonance (1H NMR) results can be found in and and .
Preparation and characterization of micelles
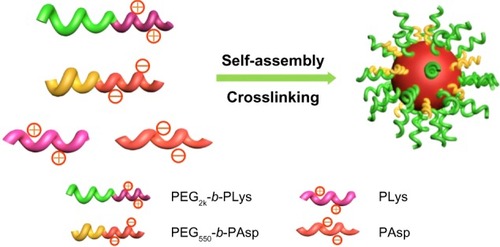
A series of PIC micelles with PEG shell layers of mixed lengths were fabricated via the assembly of specific amounts of the solution of PEG45-b-PLys32, PEG45-b-PAsp36, PEG12-b-PAsp16, PAsp42, and PLys18 at four different mole ratios of PEG45 to PEG12 (M2k/M550) as 1:0, 3:1, 1:1, and 1:3 (PEG-0, PEG-25, PEG-50, and PEG-75, respectively). The preparation scheme is shown in . In the design of the micelles, the N/C (amine/carboxylate) ratio was kept at 1 for each solution. In detail, for the preparation of PEG-0, the calculated amount of PEG45-b-PLys32 and PEG45-b-PAsp36 was mixed in pure water and stirred for 0.5 hours and excess amount of EDC·HCl (the mole ratio is over ten times compared to the amine or carboxylate) was added to the mixture. After stirring overnight at room temperature, the solution was centrifuged three times in an Amicon Ultra-4 device (Millipore, Shanghai, People’s Republic of China) with an ultrafiltration membrane (molecular weight cutoff =100 k) at a speed of 6,000 rpm for 6 minutes using Milli-Q water as the washing agent before lyophilization. The PEG-25, PEG-50, and PEG-75 were similarly prepared through the mixing of PEG45-b-PLys32 and PEG12-b-PAsp16. Furthermore, homopolymer PAsp42 or PLys18 was added to the related micelle solution. For the in vivo biodistribution and murine macrophage uptake experiments, PEG45-b-P(Lys31.7-co-LysTyr0.3) and PEG45-b-P(Lys24-co-LysFITC8), respectively, were added into the micelle solution before crosslinking. The characterization is described in the supplementary material.
Figure 1 Illustration of fabrication of mixed shell micelles.
Abbreviation: PEG, polyethylene glycol.
Cell viability
The cytotoxicity of PEG-0, PEG-25, PEG-50, and PEG-75 was evaluated via MTT assay with NIH-3T3 and HepG2 cells, respectively. The cells were seeded into 96-well plates at a density of 104 cells per well and incubated for 24 hours. The filtrate of the samples (0.22 μm) was added into the cells at different concentrations (0, 0.01, 0.1, 1, 5, 10, 100, and 200 μg/mL). After incubation for another 24 hours, 25 μL of MTT solution (5 mg/mL in phosphate buffered saline [PBS]) was added to each well; 4 hours later, the medium containing MTT was removed and the samples in the wells were air dried. Acidic isopropanol (100 μl, 0.04 M HCl in absolute isopropanol) was added to dissolve the formazan crystals. The optical density of the solution was measured at 570 nm using a microplate reader (Varioskan Flash; Thermo, South Logan, UT, USA).
In vitro protein adsorption
Serum was obtained from healthy BALB/c mice and stored at −20°C. The micelles solutions were incubated with serum at 37°C in 10 mM PBS (pH 7.4). At different time periods, specific amounts of the solution were taken out for size measurements by dynamic light scattering (DLS). To evaluate the protein adsorption efficiency by micelles, 300 μL of PEG-0, PEG-25, PEG-50, or PEG-75 (1 mg/mL) were incubated for 2 hours at room temperature with an equal volume of mouse serum. Unbound protein was then removed by centrifugation at 14,000 rpm for 45 minutes. Supernatants were collected and the protein concentration was detected via Bradford assay to determine the protein adsorption efficiency by micelles.
Murine macrophage uptake
RAW 264.7 cells were seeded into 24-well plates at a density of 2 × 10⁴ cells per well in 500 μL RPMI-1640 medium with 10% fetal bovine serum (FBS). After an incubation of 24 hours, the culture medium of each well was replaced with 500 μL of fresh medium containing 100 μg/mL of PEG-0, PEG-25, PEG-50, or PEG-75. The culture medium was removed 4 hours later and cells were washed three times with 500 μL PBS buffer. The cellular uptake of micelles was observed with an inverted fluorescence microscope (DMI6000B, Leica, Wetzlar, Germany).
125I-radiolabeling of micelles
The micelles were 125I labeled on the phenol group of the tyrosine residues of the side chains of PLys units using the chloramine-T method. Briefly, 300 μL PEG-0, PEG-25, PEG-50, or PEG-75 (1 mg/mL) in 0.1 M pH 7.4 phosphate buffer (PB) solution was placed into a polypropylene micro-centrifuge tube (1.5 mL); 5 μL diluted Na125I (0.25 mCi) and 45 μL chloramine-T (0.160 μM) in 0.1 M pH 7.4 PB solution were added, then the mixtures were rotated on a rotator for 30 minutes at room temperature. Sodium pyrosulfite 45 μL (0.473 μM) in 0.1 M pH 7.4 PB solution was added and rotated for 1 more minute to quench the reaction. Unreacted 125I and other chemicals were removed by centrifugation in an Amicon Ultra-4 device with an ultrafiltration membrane (molecular weight cutoff =100 k) at a speed of 4,000 rpm. The centrifugation was performed five times using 10 mM PB as the washing agent. The labeling rates and radiochemical purities of the micelles were detected by radioactive thin-layer chromatography (TLC) scanner (AR2000; BioScan, Northwest, Washington DC, USA) (90% ethanol and 10% deionized water as mobile phase). The 125I-radiolabeled micelles were added in fresh mouse plasma at 37°C. Radiochemical purity of polymers was detected by TLC scanner at 4, 8, 24, 48, and 72 hours.
In vivo biodistribution in tumor-bearing mice
The Ehrlich ascites carcinoma (EAC) was maintained in ascitic form by weekly intraperitoneal transplantation of 106 tumor cells in BALB/c mice. The ascitic fluid was collected by intraperitoneal puncture using a sterile syringe. A volume of 100 μL (1 × 10⁵ viable cells) of Ehrlich ascitic tumor cell suspension was injected subcutaneously in the flank to produce EAC xenografts. Mice bearing EAC were used for imaging and biodistribution experiments when the diameter of tumor xenografts reached 0.4–0.6 cm. All procedures were performed with male, 6- to 8-week-old BALB/c mice (Laboratory Animal Center of The Academy of Military Medical Sciences, Beijing, People’s China) according to the guidelines of the Regulations for the Administration of Affairs Concerning Experimental Animals (Tianjin, revised in June 2004) and adhered to the Guiding Principles in the Care and Use of Animals of the American Physiological Society. Planar Gamma camera imaging was performed with an in vivo Gamma camera (KODAK IS in vivo FX; Kodak, New Haven, CT, USA). Mice were injected with 10 μCi of 125I-labeled polymers via the tail vein. The mice were anesthetized by intraperitoneal injection with 1% sodium pentobarbital solution (45 mg/kg) at 1, 4, 8, 24, and 48 hours post-injection and then imaged (three per time point). BALB/c mice were randomly divided into four groups and 2 μCi of the radiolabeled micelles in PBS was injected into mice via the tail vein. At 1, 4, 8, 24, and 48 hours post-injection, blood samples were collected via cardiac puncture. Mice were then euthanized and the major organs (heart, liver, lung, spleen, kidney, brain, stomach, muscle, large intestine, small intestine, and genitalia) were removed and weighed (the stomach, large intestine, and small intestine were first emptied and washed with PBS). The radioactivity of organs was detected with a Gamma counter. The results were expressed as percentages of injected dose per gram of organ tissue (%ID/g) (three per time point). All data were corrected to offset decay.
Statistical analysis
One-way analysis of variance (ANOVA) was utilized for statistical analysis. All statistical tests were two-sided, and P-values less than 0.05 were considered statistically significant. The quantitative data of organ accumulation were expressed as %ID/g. The total radioactivity of blood was calculated, assuming that the blood constituted 8% of the total weight of mice. The results are shown as mean ± standard deviation.
Results and discussion
Fabrication of PIC micelles with mixed lengths of PEG on the surface
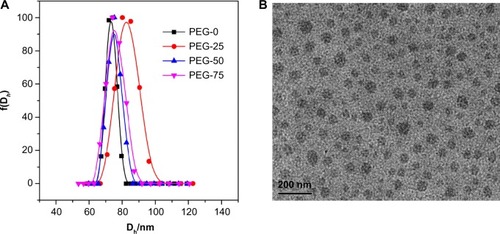
The physicochemical properties of nanoparticles play a determinant role in their biological applications, especially in vivo biodistribution after IV administration.Citation7 In order to determine the effect of surface chemistry on the in vivo biodistribution of nanoparticles, first we should make a series of nanoparticles with similar major physicochemical properties: size, size distribution, shape, surface charge, and core composition, but with different surface properties. In our work, we fabricated four types of PIC micelles with a cross-linked core and mixed PEG shells of PEG2k and PEG550, mainly through electrostatic self-assembly of PEG45-b-PLys32 and PEG12-b-PAsp16 and subsequent chemical crosslinking of the core as shown in . The four types of micelles with gradient mixed shells of different PEG, of which the mole ratio of PEG2k segment to PEG550 segment (MPEG2k/MPEG550) were 1/0, 3/1, 1/1, and 1/3 (PEG-0, PEG-25, PEG-50, and PEG-75, respectively), were successfully obtained by optimizing the micelle formulation. The ratio of 1/0 was used as a control, while the other three types were compared to determine the effect of mixing PEG2k with relatively short hydrophilic PEG550 chains on the in vivo biodistribution of the micelles. For PEG-0 micelles, only PEG45-b-PLys32 and PEG45-b-PAsp36 were used to fabricate the PIC micelles with a single PEG2k shell. In order to avoid gradual dissociation of the PIC micelles in the biological environment, the cores of the micelles were chemically crosslinked via the addition of an excess amount of EDC·HCl. It was suggested that the nanoparticles possessing zero or slightly negative charges had better blood circulation properties. Thus, the ratio of Lys and Asp segments of the micelles were kept at 1 by adding additional amounts of homopolymer PLys or PAsp as calculated to assure micelles charges of nearly zero in neutral conditions. The micelles with similar surface charges were obtained as shown in . Through optimizing the formulation of micelles, various micelles with approximately the same size, size distribution, and similar uniformity as determined by DLS and transmission electron microscopy (TEM) (, and ) were obtained. The average diameter of the micelles was around 70–80 nm with a spherical morphology. The molecular weight of the PEG chain would not affect the zeta potential of micelle nanoparticles; however, it correlated well with the size of nanoparticles as the PEG chain formed the shell of the micelles.
Table 1 Characteristics of micelles with various PEG2k/PEG550 ratios
Figure 2 (A) Hydrodynamic diameter (Dh) distribution of different micelles (PEG-0, PEG-25, PEG-50, and PEG-75) in 100 mM phosphate buffer (pH 7.4) determined by dynamic light scattering. (B) Representative TEM image of PEG-25 at 37°C. The scale bar is 200 nm. The TEM images of PEG-0, PEG-50, and PEG-75 are shown in .
Abbreviations: PEG, polyethylene glycol; TEM, transmission electron microscopy.
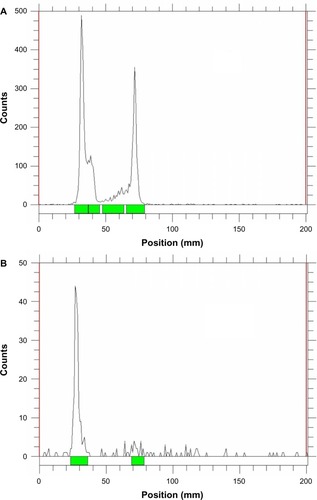
To better track the in vivo localization of micelles, the 125I-labeling method was employed to label the micelles. A calculated amount of PEG45-b-P(Lys31.7-co-LysTyr0.3) was added into the micelle solution before crosslinking. The tyrosine residue could be easily modified with 125I by the chloramine-T method utilizing the phenol group of tyrosine in aqueous medium. As the crosslinked core consisted of hydrophilic polymers, the tyrosine-incorporated micelles could be easily labeled with 125I. The resultant 125I-labeled micelles were purified by centrifugation in an ultrafiltration membrane using PBS to wash the unreacted free 125I ions. shows the TLC chromatograms of 125I-labeled PEG-25 before and after purification (complete information is shown in ). As confirmed by chromatography, free unreacted 125I ions were efficiently separated from the 125I-labeled solution, while 125I-labeled micelles remained at the original position. As shown in , the labeling rate was 90.4%, 59.0%, 87.7%, and 92.3% for PEG-0, PEG-25, PEG-50, and PEG-75, respectively. The radiochemical purities of the micelles were higher than 97%, indicating successful purification of the 125I-labeled micelles. Also, the in vitro stability of 125I-labeled micelles was evaluated by incubating with fresh mouse plasma. Over 90% of the 125I-labeled four micelles remained stable after 72 hours of incubation as summarized in .
Table 2 Characterization of iodine-125-labeled micelles
Figure 3 Representative thin-layer chromatograms of iodine-125-labeled micelles (PEG-25) (A) before and (B) after purification.
Abbreviation: PEG, polyethylene glycol. Green bars indicate the location of detected radioactive peaks.
Cell viability
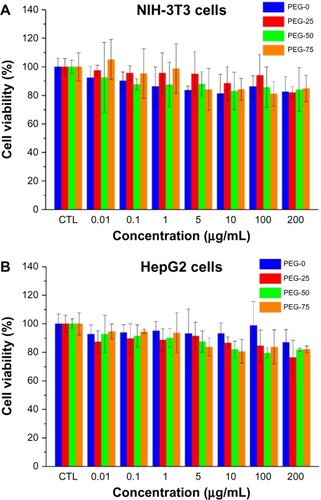
For practical application, biocompatibility is an important factor. In this study, the cytotoxicity of different micelles was assessed using the MTT assays with NIH-3T3 and HepG2 cells. All the micelles from 0.01 μg/mL to 200 μg/mL showed negligible cytotoxicity on both cells, as shown in . As the micelles were composed of biocompatible materials, such as PEG and poly(amino acid), the cell viability of all four types of micelles was over 80%, even at the high concentration of 200 μg/mL.
Figure 4 Cell viability of the micelles (PEG-0, PEG-25, PEG-50, and PEG-75) with (A) NIH-3T3 and (B) HepG2 cells measured by MTT assay.
Abbreviations: PEG, polyethylene glycol; MTT, 3-(4,5-dimethylthiazol-2-yl)-2,5-diphenyl tetrazolium bromide; NIH-3T3, mouse embryonic fibroblast cell line; HepG2, human liver hepa tocellular carcinoma cell line.
In vitro protein adsorption
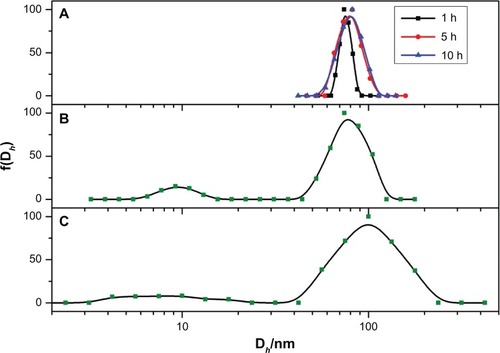
During the circulation with blood, various opsonic proteins would be adsorbed onto the surface of nanoparticles and form a protein corona.Citation2,Citation26 Subsequently, nanoparticles with protein adsorption would undergo size increase and unavoidable aggregation. To better mimic the blood plasma environment and precisely assess the protein adsorption onto the nanoparticles, we incubated the micelles with mouse blood plasma and monitored the alteration of size and size distribution of the protein–micelle complex at 37°C with DLS. As shown in , the size and size distribution of PEG-75 increased with time after incubation with serum. The small size of several nm to 20 nm could be attributed to the high concentration of serum proteins scattered in the solution. For PEG-0, as shown in , the average size of around 70 nm changed little, but the size distribution became much wider than the original micelle. Similar results were also observed with PEG-25, PEG-50, and PEG-75. However, the size of these three types of micelles became more than 100 nm after 10 hours of incubation, much larger than the corresponding micelles in the absence of serum. Furthermore, the intensity of serum proteins contributed less intensity than PEG-0 one, indicating much more protein was adsorbed onto the micelles of PEG-25, PEG-50, and PEG-75. Meanwhile, the size and shape of the protein-adsorbed micelles were measured by TEM (). Compared with the original micelles, the protein-adsorbed micelles became relatively larger, with a clear staining of the protein layer by uranyl-acetate.
Figure 5 The size variation of the micelles (PEG-75) in the absence of serum (10 mM phosphate buffer, pH7.4 at 1, 5, and 10 hours) (A) and incubated with serum at the time period of 5 hours (B) and 10 hours (C) determined by dynamic light scattering at 37°C. The other three kinds of micelles are shown in .
Abbreviations: PEG, polyethylene glycol; f(Dh), the hydrodynamic diameter.
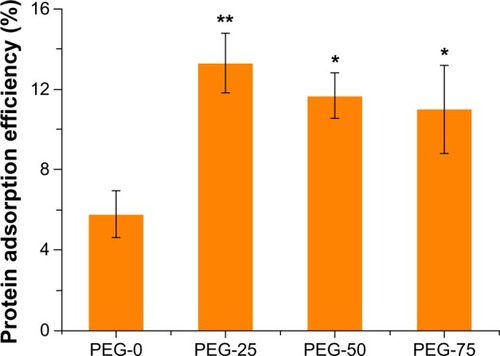
To investigate the protein adsorption efficiency of different micelles, the same amount of micelles was incubated with an equal volume of mouse serum for 2 hours. Upon being centrifuged at 14,000 rpm for 45 minutes, free proteins were removed and the supernatants were collected to determine the protein concentration via Bradford assay. The protein adsorption efficiency of micelles was accordingly determined as summarized in . In contrast to the well documented finding that PEGylation reduces protein adsorption, unexpected results were observed from these PEGylated micelles. For different micelles, the protein adsorption varied with PEGylation patterns. The protein adsorption efficiency of PEG-25, PEG-50, and PEG-75 was 13.3% (P<0.01 compared with PEG-0), 11.7% (P<0.05 compared with PEG-0), and 11% (P<0.05 compared with PEG-0), respectively, which was about two times that of PEG-0 (5.8%) as depicted in . Compared with the protein adsorption efficiency of PEG-0, the protein adsorption efficiency of PEG-25, PEG-50, and PEG-75 had statistically significant differences when analyzed with the ANOVA method. There was no statistically significant difference among PEG-25, PEG-50, and PEG-75. PEG-0 showed higher protein adsorption resistance than the other micelles. A likely explanation for this could be the steric structures of the shell made up of different ratios of PEG2k and PEG550 on the surface. Only with PEG2k in the shell, the core was covered with the longest shell layer, resulting in a thick PEG shell with an improved shielding effect from the adsorption of proteins in the blood, most of which were opsonic proteins. Under the mixing of short chain of PEG, the mixed shell consists of PEG2k and PEG550, which were of different lengths. As a result, the surface would have different heights of PEG. With the domains of the PEG550 scattered in the PEG shell, a concave structure would form on the surface and provide subunit spaces for the physical adsorption of proteins through hydrogen bond, van der Waals interaction, and other non-covalent interactions. The heterogeneity of the surface arose from the mixed length of PEG enlarging the specific surface area for the interaction of protein and micelles. Moreover, as the degree of polymerization (Dp) of PEG550 is only about 12, the length of PEG550 should be less than 5 nm.Citation27 Thus, benefiting from a reduced distance from the micelle core, the interaction of micelles with proteins would increase. Uchida et alCitation28 reported a different result of protein adsorption properties on a flat gold surface with the mixed long and short PEG brushes. In their work, the shorter PEG (PEG2k) as a filler was layered by repetitive introduction. As the amount of PEG5k did not change, the density of the PEG layer would increase with the introduction of PEG2k, which was different from the circumstances reported here. With high PEG surface density, the gold chip showed good resistance to non-specific protein adsorption. While, in our design, according to the formulation shown in , when the PEG2k shell was mixed with PEG550, the relative amount of the PEG2k was decreased, resulting in decreased density of the PEG layer on the surface of the mixed micelles compared with PEG-0. Therefore, upon the mixing of PEG550 in the shell, protein adsorption ability would be increased. Under this assumption, compared with single PEG2k-covered micelles, more proteins would adsorb onto the surface of micelles with mixed length of PEG2k and PEG550. In other words, all the micelles would form protein coronas after incubation with blood plasma and PEG-0 presented better resistance of protein adsorption.
Figure 6 Protein adsorption efficiency of various micelles with mixed PEG shell on the surface. One-way analysis of variance was utilized for the statistical analysis. All statistical tests were two-sided.
Notes: *P<0.05, **P<0.01 compared with PEG-0; n=3.
Abbreviation: PEG, polyethylene glycol.
Murine macrophage uptake
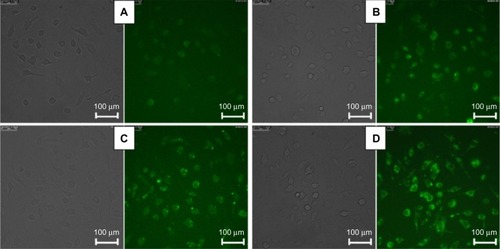
For the murine macrophage uptake experiments, FITC-labeled micelles with various mixed lengths of PEG in the shell were incubated with RAW 264.7 murine macrophages in the FBS-containing medium at 37°C for 4 hours. Internalization of FITC-labeled micelles was visualized with inverted epi-fluorescence microscopy. As shown in , the green fluorescence inside the cytoplasm of cells came from the FITC-labeled micelles, and the fluorescence intensity indicated the level of internalization of micelles. According to the fluorescence images shown in , all the micelles could be efficiently phagocytosed by macrophages. Compared with PEG-25, PEG-50, and PEG-75, PEG-0 showed the weakest fluorescence intensity, indicating the unfavorable uptake of PEG-0 by murine macrophages. It was suggested that size, surface charge, and surface functionality might have the dominant influence in phagocytosis of nanoparticles. In our work, compared with PEG-0, the micelles of PEG-25, PEG-50, and PEG-75 adsorbed more serum proteins on the surface and became larger. Larger nanoparticles would coalesce within the cell membrane into spherical vesicles, which could be easily phagocytosed. Meanwhile, with the opsonic proteins adsorbed on the micelle surface, the possibility of being recognized by murine macrophages increased and subsequently the micelles had a higher tendency to be phagocytosed and cleared by these cells.
Figure 7 Inverted fluorescent microscopy presenting cellular uptake of micelles in RAW 264.7 murine macrophages after 4 hours of incubation with FITC-labeled micelles: (A) PEG-0, (B) PEG-25, (C) PEG-50, and (D) PEG-75 in medium with 10% FBS.
Abbreviations: FBC, fetal bovine serum; FITC, fluorescein isothiocyanate; PEG, polyethylene glycol; RAW 264.7, mouse macrophage-like cell line.
Pharmacokinetics and biodistribution of 125I-labeled micelles
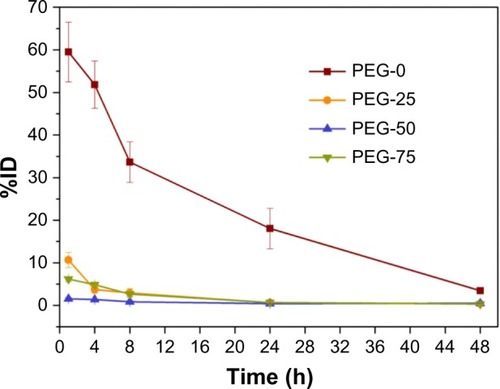
PEGylation has been widely used in various nanoparticles, and several types of PEGylation have demonstrated their efficiency in delaying opsonization and prolonging the blood residence time of nanoparticles. However, PEGylation is still not well understood and the best strategy remains unclear. In this work, we established a new PEGylation strategy to investigate the PEGylation effect on in vivo biodistribution. The PIC micelles were labeled with 125I using the chloramine-T method. By monitoring the radioactive count with a Gamma counter, the in vivo fate of the PEG-0, PEG-25, PEG-50, and PEG-75 was systematically studied over 48 hours. Simultaneously, the Gamma camera images of different micelles were recorded using a small-animal in vivo imaging system. After IV administration with a dose of 5 mg micelles/kg (weight of BALB/c mice), various tissues including the heart, liver, spleen, lung, renal, stomach, large intestine, small intestine, genitalia, skeletal muscle, brain, and blood were harvested; the accumulation of micelles in these tissues is shown in . The micelles rapidly distributed in the organs of tumor-bearing BALB/c mice after IV administration. During the test period, the concentration of different micelles in various tissues, particularly the liver and spleen, generally decreased with time. This could be attributed to the clearance effect of the RES organs. When the micelles entered blood circulation, opsonic proteins would be adsorbed onto the micelles and form a protein corona, which could be recognized by receptors on the surface of macrophages of the liver, spleen, and other RES organs.Citation29 Thus, most of the micelles could be efficiently phagocytosed by these cells and cleared under degradation by various enzymes in these cells. In and , the blood concentration of PEG-0 gradually decreased, while concentration in the liver and spleen first increased and then decreased, indicating the balance of deposition and clearance of micelles in these organs. PEG-0 showed the longest circulation time in the bloodstream and the least accumulation in liver and spleen. For example, the amount of PEG-0 remaining in the bloodstream (33.7%ID) was more than ten times higher than that of PEG-25 (2.9%ID), PEG-50 (0.9%ID), and PEG-75 (2.7%ID) at 8 hours after IV administration. Meanwhile, for PEG-0, only 4.4%ID/g and 3.9%ID/g accumulated in the liver and spleen, respectively, while PEG-25 (23.0%ID/g in liver, 44.4%ID/g in spleen), PEG-50 (13.9%ID/g in liver, 8.1%ID/g in spleen), and PEG-75 (23.1%ID/g in liver, 29.4%ID/g in spleen) mainly accumulated in the RES organs. Moreover, the concentration of PEG-0 accumulated in tumors at 8 hours was about 4.0%ID/g, which was 2-fold, 4.7-fold, and 2.3-fold higher than that of PEG-25 (1.3%ID/g), PEG-50 (0.7%ID/g), and PEG-75 (1.2%ID/g), respectively. Even so, PEG-0 accumulated in the tumor site was still less than 5%ID/g, which corresponded well with comments by Bae and ParkCitation30 that the enhanced permeability and retention effect was inefficient, as most of the nanoparticles were cleared by the liver, spleen, and other RES organs. In this case, further investigations regarding efficient tumor therapy are still needed. We observed that PEG-50 had higher accumulation (eg, about 4-fold at 1 hour) in the heart than other micelles. As we know that the biodistribution of nanoparticles in the body is very complex, we cannot yet give a reasonable explanation for this phenomenon. The heart accumulation mechanism and the application to, for example, heart-targeting drug delivery still need further study. visually presents the distribution images of different micelles in BALB/c mice at 4 hours post-injection. The radioactive intensity was consistent with the concentration of micelles deposited in various parts of the mice. PEG-0 showed less intensive disposal in the liver and scattered widely over the whole body compared with the other three kinds of micelles. From the blood clearance curves of different micelles presented in , we could see clearly that the dose of micelles remaining in the bloodstream decreased with time over 48 hours and PEG-0 showed the lowest elimination rate compared with the other micelles.
Figure 8 In vivo biodistribution of different micelles at various time points (1, 4, 8, 24, 48 hours) after injection with (A) PEG-0, (B) PEG-25, (C) PEG-50, and (D) PEG-75, respectively.
Notes: 5 mg micelles/kg mice body weight; data are expressed as %ID/g ± standard deviation; n=3.
Abbreviations: %ID/g, percent injected dose per gram; PEG, polyethylene glycol.
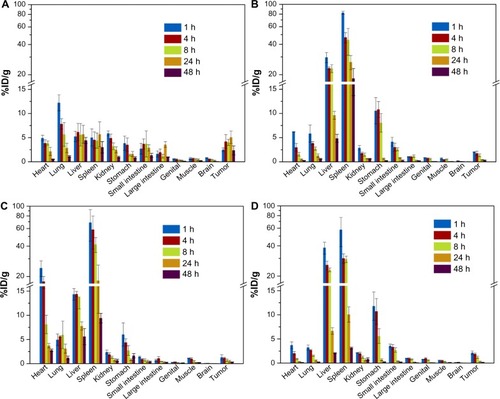
Figure 9 Representative Gamma camera images of the BALB/c mice. (A) PEG-0, (B) PEG-25, (C) PEG-50, and (D) PEG-75 at 4 hours after intravenous administration. (The y axis means the relative radioactive intensity).
Abbreviation: PEG, polyethylene glycol.
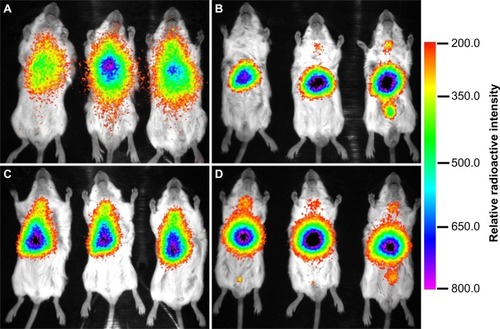
Figure 10 Blood clearance curves of micelles after intravenous administration.
Notes: Data are expressed as percent injected dose (%ID) ± standard deviation; n=3.
As we know, physicochemical properties of nanoparticles, including size, charge, and surface chemistry, have direct influences on the in vivo biodistribution of nanoparticles. With PEG550 on the surface, the micelles of PEG-25, PEG-50, and PEG-75 showed similar in vivo biodistribution results, which were in accordance with the related macrophage uptake efficiency. In the presence of serum, the micelles with different surface properties would form various protein coronas after opsonization in the incubation medium. As the four kinds of micelles possessed similar sizes, charges, and core compositions but different PEGy-lation patterns, the distinction of the macrophage uptake could be attributed to the varied PEG shell. Although the surfaces of four micelles were all covered with the same kind of polymers containing short PEG chains, the surface of the micelles would have different structures, as already discussed. With PEG550 in the mixed PEG shell, the micelles presented lower protein adsorption resistance ability and tended to be more easily phagocytosed by macrophage cells. However, it should be noted that the serum protein adsorption and macrophage uptake were still unavoidable for the longest PEG shell layer covered with PEG-0. Subsequently, under the fast clearance of macrophages in the RES organs, PEG-25, PEG-50, and PEG-75 were eliminated faster than PEG-0. The micelles had different PEGylation patterns. Meanwhile, with the mixed shells of PEG2k and PEG550, the relative PEG thickness on the surface might decrease with the increase of PEG550 segments. Similar investigations also suggest the high density of PEG grafting on the surface of nanoparticles would prolong circulation time and reduce deposition in RES organs.Citation31 In our work, according to the new research method for investigating the effects of PEGylation patterns on in vivo biodistribution, we demonstrated that the mixing of short hydrophilic PEG chains on the surface of nanoparticles significantly decreases blood residence time and increases unfavorable clearance by RES organs. On the contrary, the micelles with single PEG2k cover had prolonged blood circulation, reduced deposits in the liver and spleen, and increased deposits in tumor sites.
Conclusion
We successfully fabricated a series of PIC micelles with tunable shell at different ratios of PEG2k and PEG550 on the surface. Murine macrophage uptake, protein adsorption and in vivo biodistribution were systematically investigated to extend the understanding of the PEGylation patterns for drug delivery nanocarriers. Among the micelles studied, the PEGylated micelles with single PEG2k on the surface exhibited prolonged circulation, reduced accumulation in the liver and spleen, and increased accumulation in tumor sites. According to results of the protein adsorption and murine macrophage uptake experiments, we could make a conclusion that the accumulation of micelles in liver and spleen increased by adding short chain of PEG550 to the PEG2k shell layer. Our work provides new research insight into PEGylation and establishes an experimental basis for rational design of PEGylated nanoparticles with controlled in vivo biodistribution for drug delivery systems.
Acknowledgments
The authors thank the Science Foundation of China (No 91127045, 81171371, 50830103, 20904025 and 51203189), the National Basic Research Program of China (973 Program, No 2011CB932500), the Tianjin Natural Science Foundation (13JCZDJC28100), and the Development Foundation of the Institute of Radiation Medicine, Chinese Academy of Medical Sciences and Peking Union Medical College (SF1209, SZ1334) for financial support.
Supplementary material
Characterization
1H NMR spectra were recorded on a Varian UNITY-plus 400 M NMR spectrometer (Varian Instruments, Palo Alto, CA, USA) at room temperature with tetramethylsilane (TMS) as an internal standard. DLS experiments at a 90° scatter angle were performed on a laser light- scattering spectrometer (BI-200SM, Brookhaven, NY, USA) equipped with a digital correlator (BI-9000AT) at 636 nm at the required temperature. All samples were obtained by filtering through a 0.45 μm Millipore filter into a clean scintillation vial. TEM measurements were performed using a Philips T20ST electron microscope (Amsterdam, Netherlands) at an acceleration voltage of 100 kV. To prepare the TEM samples, the sample solution was dropped onto a carbon-coated copper grid and dried slowly at the required temperature. The zeta potential values were measured on a Brookhaven ZetaPALS (Brookhaven Instruments). The instrument utilizes phase analysis light scattering at 37°C to provide an average over multiple particles.
Synthesis
Synthesis of poly(aspartic acid) (PAsp42), poly(L-lysine) (PLys18), PEG45-b-PLys32, and PEG-b-PAsp (PEG45-b-PAsp36 and PEG12-b-PAsp16)
The homopolymer PAsp42 and PLys18 were synthesized as shown in Gao et al.33 The block copolymers PEG45-b-PLys32, PEG45-b-PAsp36, and PEG12-b-PAsp16 were synthesized with similar methods. The synthesis schemes and 1H NMR spectra are shown in and .
Synthesis of poly(ethylene glycol)-block-poly(L-lysine-co-L-lysine-Tyrosine) (PEG45-b-P(Lys31.7-co-LysTyr0.3)) and poly(ethylene glycol)-block-poly(L-lysine-co-L-lysine-FITC) (PEG45-b-P(Lys24-co-LysFITC8))
PEG45-b-P(Lys31.7-co-LysTyr0.3) was synthesized by the modification of PEG-b-PLys synthesized previously according to Gao et al.Citation32 The synthesis scheme is shown in Scheme S1. In detail, 40 mg NHS was introduced into the solution of 10 mg tyrosine in DMF/H2O. The pH of the mixture was adjusted to about 5.0. Then, 22 mg EDC·HCl was added to the solution. The solution was kept at 4°C for 4 hours followed by the addition of 40 mg PEG45-b-PLys32. The final reaction mixture was stirred for 48 hours at room temperature. The solution was then dialyzed against deionized water in a dialysis membrane (molecular weight cutoff = 2 k) for 3 days. After that, the solution was purified by filtering through a 0.22 μm Millipore filter and lyophilized to obtain 20 mg of PEG45-b-P(Lys31.7-co-LysTyr0.3). For the synthesis of PEG45-b-P(Lys24-co-LysFITC8), 6.4 mg FITC in the mixture solution of DMSO and H2O was added into the aqueous solution of 60 mg PEG2k-b-PLys32. After stirring for 24 hours at room temperature, the reaction solution was dialyzed against deionized water in a dialysis membrane (molecular weight cutoff = 2 k) for 4 days. The solution was then lyophilized, and 64 mg orange powder was obtained. The 1H NMR spectra are shown in .
Scheme S1 Synthesis of (A) PAsp42, (B) PLys18, (C) PEG45-b-PLys32, (D) PEG-b-PAsp (PEG45-b-PAsp36 and PEG12-b-PAsp16), (E) PEG45-b-P(Lys31.7-co-LysTyr0.3) and (F) PEG45-b-P(Lys24-co-LysFITC8).
Abbreviations: PEG, polyethylene glycol; PLys, poly(L-lysine); PAsp, poly(aspartic acid); FITC, fluorescein isothiocyanate; EDC, 1-Ethyl-3-(3-dimethylaminopropyl) carbodiimide; NHS, N-hydroxysuccinimide; DMSO, dimethyl sulfoxide; DMF, N,N-Dimethylformamide; TFA, trifluoroacetic acid; Tyr, tyrosine.
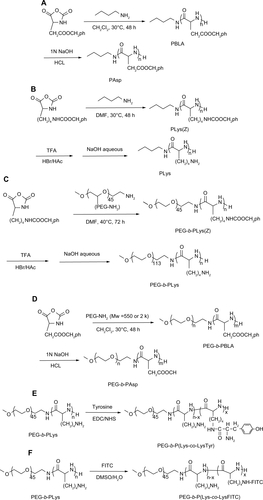
Figure S1 1H NMR spectra of (A) PAsp42, (B) PLys18, (C) PEG45-b-PLys32, (D) PEG45-b-PAsp36, and (E) PEG12-b-PAsp16 in D2O.
Abbreviations: NMR, nuclear magnetic resonance; PEG, polyethylene glycol; PLys, poly(L-lysine); PAsp, poly(aspartic acid).
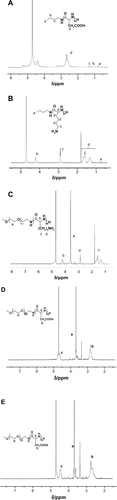
Figure S2 1H NMR spectra of (A) PEG45-b-P(Lys31.7-co-LysTyr0.3) and (B) PEG45-b-P(Lys24-co-LysFITC8) in D2O.
Abbreviations: NMR, nuclear magnetic resonance; PEG, polyethylene glycol; PLys, poly(L-lysine); PAsp, poly(aspartic acid); FITC, fluorescein isothiocyanate; Tyr, tyrosine.
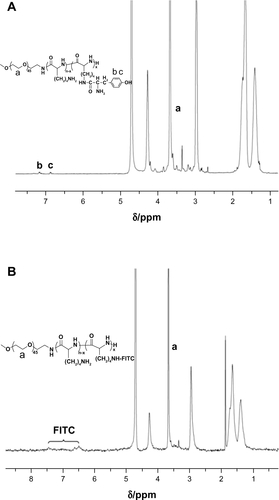
Figure S3 TEM images of micelles in the absence (left) and presence (right) of serum (stained with uranyl acetate) at 37°C (scale bar: 0.2 μm).
Abbreviation: TEM, transmission electron microscopy.
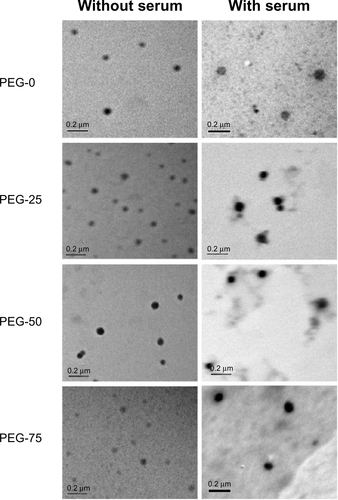
Figure S4 Thin-layer chromatograms of iodine-125-labeled micelles (A) before and (B) after purification. Green bars indicate the location of detected radioactive peaks.
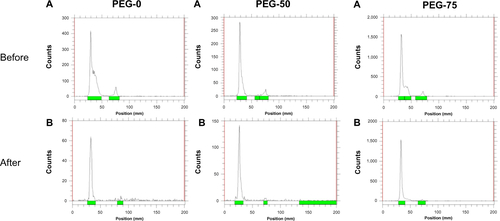
Figure S5 Size distributions of (A) PEG-0, (B) PEG-25, (C) PEG-50, and (D) PEG-75 in phosphate buffer (pH 7.4, 10 mM) at 37°C (a) without serum (1, 5, and 10 hours), and in the presence of serum at different time points, (b) 5 hours and (c) 10 hours.
Abbreviation: PEG, polyethylene glycol; Dh, hydrodynamic diameter.
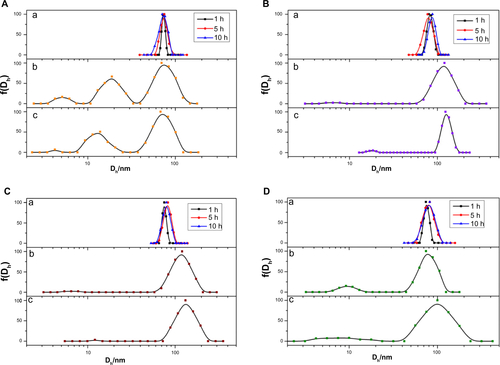
Table S1 Formulation of mixed shell micellesTable Footnotea
Disclosure
The authors report no conflicts of interest in this work.
References
- NelAEMädlerLVelegolDUnderstanding biophysicochemical interactions at the nano-bio interfaceNat Mater20098754355719525947
- MoghimiSMHunterACMurrayJCLong-circulating and target-specific nanoparticles: theory to practicePharmacol Rev200153228331811356986
- ChithraniBDGhazaniAAChanWDetermining the size and shape dependence of gold nanoparticle uptake into mammalian cellsNano Lett20066466266816608261
- ZhangSLiJLykotrafitisGBaoGSureshSSize-dependent endocytosis of nanoparticlesAdv Mater20092141942419606281
- DavisMEChenZGShinDMNanoparticle therapeutics: an emerging treatment modality for cancerNat Rev Drug Discov20087977178218758474
- LundqvistMStiglerJEliaGLynchICedervallTDawsonKANanoparticle size and surface properties determine the protein corona with possible implications for biological impactsProc Natl Acad Sci U S A200810538142651427018809927
- AlexisFPridgenEMolnarLKFarokhzadOCFactors affecting the clearance and biodistribution of polymeric nanoparticlesMol Pharm20085450551518672949
- StormGBelliotSODaemenTLasicDDSurface modification of nanoparticles to oppose uptake by the mononuclear phagocyte systemAdv Drug Delivery Rev19951713148
- YamamotoYNagasakiYKatoYSugiyamaYKataokaKLong-circulating poly(ethylene glycol)-poly(D,L-lactide) block copolymer micelles with modulated surface chargeJ Control Release2001771–2273811689257
- ShengYLiuCYuanYLong-circulating polymeric nanoparticles bearing a combinatorial coating of PEG and water-soluble chitosanBiomaterials200930122340234819150737
- KnopKHoogenboomRFischerDSchubertUSPoly(ethylene glycol) in drug delivery: pros and cons as well as potential alternativesAngew Chem Int Ed Engl201049366288630820648499
- KimYKMinai-TehraniALeeJHChoCSChoMHJiangHlTherapeutic efficiency of folated poly(ethylene glycol)-chitosan-graft-polyethylenimine-Pdcd4 complexes in H-ras12V mice with liver cancerInt J Nanomedicine201381489149823620665
- LiSDHuangLPharmacokinetics and biodistribution of nanoparticlesMol Pharm20085449650418611037
- BallouBLagerholmBCErnstLABruchezMPWaggonerASNoninvasive imaging of quantum dots in miceBioconjug chem2004151798614733586
- PerraultSDWalkeyCJenningsTFischerHCChanWCMediating tumor targeting efficiency of nanoparticles through designNano Lett2009951909191519344179
- LiSDHuangLNanoparticles evading the reticuloendothelial system: role of the supported bilayerBiochim Biophys Acta20091788102259226619595666
- ParkKTo PEGylate or not to PEGylate, that is not the questionJ Control Release2010142214714820096317
- SunGHagoolyAXuJFacile, efficient approach to accomplish tunable chemistries and variable biodistributions for shell cross-linked nanoparticlesBiomacromolecules2008971997200618510359
- LiCZhaoXWangYProlongation of time interval between doses could eliminate accelerated blood clearance phenomenon induced by pegylated liposomal topotecanInt J Pharm20134431–2172523318366
- LinXWangZJHuangFLong-circulating delivery of bioactive polysaccharide from radix ophiopogonis by PEGylationInt J Nanomedicine201162865287222131832
- BeletsiAPanagiZAvgoustakisKBiodistribution properties of nanoparticles based on mixtures of PLGA with PLGA-PEG diblock copolymersInt J Pharm2005298123324115936907
- HaradaAKataokaKChain length recognition: core-shell supramolecular assembly from oppositely charged block copolymersScience1999283539865679872741
- KataokaKHaradaANagasakiYBlock copolymer micelles for drug delivery: design, characterization and biological significanceAdv Drug Deliv Rev200147111313111251249
- BaeYKataokaKIntelligent polymeric micelles from functional poly(ethylene glycol)-poly(amino acid) block copolymersAdv Drug Deliv Rev2009611076878419422866
- DalyWHPocheDThe preparation of n-carboxyanhydrides of alpha-amino-acids using bis (trichloromethyl) carbonateTetrahedron Lett1988294658595862
- FrankMMFriesLFThe role of complement in inflammation and phagocytosisImmunol Today19911293223261755943
- TanfordCNozakiYRohdeMFSize and shape of globular micelles formed in aqueous solution by n-alkylpolyoxyethylene ethersJ Phys Chem1977811615551560
- UchidaKOtsukaHKanekoMKataokaKNagasakiYA reactive poly(ethylene glycol) layer to achieve specific surface plasmon resonance sensing with a high S/N ratio: the substantial role of a short underbrushed PEG layer in minimizing nonspecific adsorptionAnal Chem2005771075108015858988
- BrainJDMolinaRMDeCampMMWarnerAEPulmonary intravascular macrophages: their contribution to the mononuclear phagocyte system in 13 speciesAm J Physiol19992761 Pt 1146154
- BaeYHParkKTargeted drug delivery to tumors: myths, reality and possibilityJ Control Release2011153319820521663778
- FangCShiBPeiYYHongMHWuJChenHZIn vivo tumor targeting of tumor necrosis factor-alpha-loaded stealth nanoparticles: effect of MePEG molecular weight and particle sizeEur J Pharm Sci2006271273616150582
- GaoHXiongJChengTIn vivo biodistribution of mixed shell micelles with tunable hydrophilic/hydrophobic surfaceBiomacromolecules201314246046723281663