Abstract
Silver nanoparticles (AgNP) have been associated with the exacerbation of airway hyperresponsiveness. However, the allergenicity and toxicology of AgNP in healthy and allergic individuals are unclear. We investigated the pathophysiological responses to AgNP inhalation in a murine model of asthma. Continuous and stable levels of 33 nm AgNP were maintained at 3.3 mg/m3 during the experimental period. AgNP exposure concomitant with ovalbumin challenge increased the enhanced pause (Penh) in the control and allergic groups. AgNP evoked neutrophil, lymphocyte and eosinophil infiltration into the airways and elevated the levels of allergic markers (immunoglobulin E [IgE] and leukotriene E4 [LTE4]), the type 2 T helper (Th2) cytokine interleukin-13 (IL-13), and oxidative stress (8-hydroxy-2′-deoxyguanosine [8-OHdG]) in healthy and allergic mice. Bronchocentric interstitial inflammation was observed after AgNP inhalation. After inhalation, the AgNP accumulated predominantly in the lungs, and trivial amounts of AgNP were excreted in the urine and feces. Furthermore, the AgNP induced inflammatory responses in the peritoneum. The inhalation of AgNP may present safety concerns in healthy and susceptible individuals.
Introduction
Asthma is a hyperresponsive airway disease in humans and is a critical public health concern that has become increasingly prevalent. It is estimated that 300 million people worldwide suffer from asthma,Citation1 and this number is expected to increase to 400 million by 2025.Citation2 The risk factors for asthma development can be categorized into host and environmental factors.Citation3 Epidemiological studies have demonstrated an association between the incidence of allergic diseases and exposure to ambient particulate matter (PM).Citation4,Citation5 PM can exert adverse effects on the respiratory tract, which may increase the prevalence of allergic diseases associated with the physicochemistry of PM.Citation6,Citation7 Recent studies have indicated that nano-scaled PM, particularly nanoparticles (NP), induce immunotoxic and allergic responses,Citation8,Citation9 which represent a new and plausible health risk for healthy and asthmatic individuals.
An increasing number of studies have focused on the biomedical applications of NPs because of their distinct physicochemical characteristics.Citation10 Metal-based NPs, for example, have an important application as nano-sized sensors for biological labeling and as vectors for drug delivery.Citation11,Citation12 However, many metal NPs, such as zinc oxide NPs, have adverse effects on human health because of their high bioreactivity.Citation13,Citation14 A number of distinct metal NPs, such as silver NPs (AgNP), are known to reduce inflammation and exhibit antibacterial activities,Citation15 suggesting that AgNP have inflammatory effects and aid wound healing.Citation15,Citation16 Recently, studies have discussed the possibility of using AgNP to treat asthma;Citation16,Citation17 however, the allergenicity and toxicity of AgNP inhalation in healthy and asthmatic individuals are unclear.
To investigate the effects of AgNP in healthy and allergic individuals, we established an ovalbumin (OVA)-sensitized allergic mouse model. We used an evaporation-condensation method to generate AgNP, which were inhaled by allergic and healthy mice. After AgNP inhalation, enhanced pause (Penh), and allergic responses, concurrent with the induction of oxidative stress and inflammation in the pulmonary-to-systemic system, were examined in the allergic and healthy mice. Penh is an index of airway hyperreactivity that has been used in previous allergy studies.Citation16,Citation18 In addition, we evaluated the excretion and distribution of AgNP and examined their systemic tissue distribution after inhalation. The allergenicity and toxicity of inhaled AgNP were determined by evaluating allergic responses and inflammatory and oxidative potencies, which play a role in regulating the immune system.
Materials and methods
AgNP generation system
In this study, we used an evaporation-condensation method to generate the AgNP used for inhalation in mice. The design of this system has been described previously.Citation19,Citation20 Briefly, approximately 3 g of silver powder (>99%, Merck KGaA, Darmstadt, Germany) was evaporated at the center of a 1,100°C tube furnace (Model T11-301, SJ Ltd, Taipei, Taiwan; ), and the generated silver vapor was transported continuously using nitrogen at a flow rate of 6 L/minute. Because the outlets of the furnace were equipped with a chilling system, the silver vapor was quenched suddenly and condensed to form the AgNP. In this study, an additional condition section was introduced between the generation system and the exposure chamber to guarantee that the temperature, relative humidity, and composition of the exposed AgNP stream were close to the constant environmental conditions. The oxygen and nitrogen air (5 L/minute at a flow rate of 1:1; ) was delivered and mixed with the exposed AgNP stream. The oxygen level was maintained at approximately 21% throughout the exposure period. Next, the exposed AgNP stream was split into two routes for filtration with or without high-efficiency particulate air (HEPA) filters before its introduction into the whole-body exposure chambers. The exposure chamber has been described previously.Citation21
Table 1 Operation parameters for generating AgNP using the evaporation-coagulation AgNP generation system and AgNP characterization in the whole-body exposure chamber
AgNP characterization
A TSI scanning mobility particle sizer with nano-DMA (model 3936, TSI Incorporated, Shoreview, MN, USA) was used to monitor the size distribution of the AgNP in the exposure chamber continuously throughout the entire exposure period. The flow rates of the aerosol stream and sheath air of the scanning mobility particle sizer were fixed at 0.3 L/minute and 3 L/minute, respectively. The scanning mobility particle sizer was calibrated before the experiment using 100-nm National Institute of Standards and Technology (NIST)-traceable PSL (Polystyrene Latex Spheres) standard particles. The total particle number concentration, the number-based geometric mean diameter (GMD), and the geometric standard deviation (GSD) were recorded. The total surface area was estimated using TSI Inc software (Aerosol Instrument Manager, AIM 9.0) under the assumption of spherical particles. We collected real-time scanning mobility particle sizer measurements of the generated AgNP every 5 minutes during exposure. To physicochemically characterize the generated AgNP, they were collected onto 37 mm Teflon substrates (Merck Millipore, Darmstadt, Germany), quarters of which were fixed onto 13 mm aluminum scanning electron microscopy (SEM) stubs.Citation22 The samples were platinum (Pt) coated to an average thickness of 10 nm using a sputter coater and were imaged using an Inspect™ SEM (FEI Company, Hillsboro, OH, USA) at an accelerating voltage of 3 kV and a spot size of 2.5. X-ray microanalysis was performed using an energy-dispersive X-ray spectroscopy (EDX) analysis Genesis System.
Animals
Female BALB/c mice (6 weeks old) were obtained from BiOLASCO Taiwan Co., Ltd (Taipei, Taiwan). The mice were maintained at a constant temperature and relative humidity of 22°C±2°C and 55%±10%, respectively, with a light/dark cycle (12 hour/12 hour) throughout the study. The mice weighed between 17 g and 22 g during the experimental period. The animals were housed in plastic cages and were provided Lab Diet 5001 (PMI Nutrition International, St Louis, MI, USA) and water ad libitum during acclimatization as well as pre-exposure and post-exposure. The animal experiments were performed in compliance with the animal and ethics review committee of the Laboratory Animal Centre at the National Taiwan University (Taiwan).
Allergic sensitization, AgNP inhalation, and OVA challenge
To assess the effects of AgNP on allergic responses, we used endotoxin-free OVA (Sigma-Aldrich, St Louis, MI, USA) as an allergen to induce systemic sensitization. The development of allergic airway disease in mice after AgNP exposure was modified from a previously published method.Citation23 The experimental design is shown in . On day 0, the mice in the allergic group received an intraperitoneal injection of 50 μg of OVA in aluminum hydroxide adjuvant, whereas those in the control group received the same volume of adjuvant alone. On day 8, the mice in the allergic group received an intraperitoneal injection of 25 μg of OVA in aluminum hydroxide adjuvant, whereas the control group received the same volume of adjuvant alone. The mice in the control group demonstrated a significantly lower level of OVA-specific IgE than the mice sensitized with OVA (, P<0.001). On day 15, the baseline of Penh was determined before AgNP exposure and OVA challenge. On day 16, the allergic and control mice were divided into two subgroups as follows: 1) mice exposed to AgNPs (Ag; n=6), and 2) mice exposed to HEPA-filtered air (FA; n=5); exposure occurred for 7 days (6 hours/day, from day 16 to 22) for both subgroups. After exposure to Ag/FA, the mice were challenged intranasally with 100 μg of OVA between days 23 and 25, and the Penh was examined on day 26. The animals were euthanized (six mice in the AgNP exposure subgroup and five mice in the FA control subgroup) on day 27, and bronchoalveolar lavage fluid (BALF), blood, and tissue samples were collected. In addition, urine and feces were collected between days 16 and 22 (18 hours/day for 7 days) using metabolic cages (Harvard Apparatus, Holliston, MA, USA).
Figure 1 Experimental design for investigating the effects of AgNP on the allergic response to OVA antigen.
Notes: OVA in aluminum hydroxide adjuvant is prepared in PBS; PBS (control) is aluminum hydroxide adjuvant prepared in PBS.
Abbreviations: A, allergy; AgNP, silver nanoparticles; C, control; FA, filtered air; HEPA, high-efficiency particulate air; OVA, ovalbumin; PBS, phosphate-buffered saline; Penh, enhanced pause.
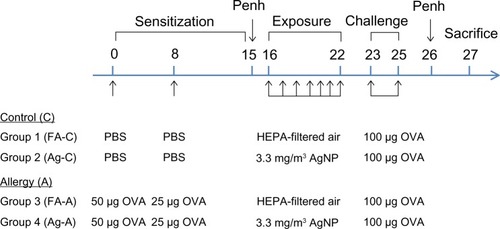
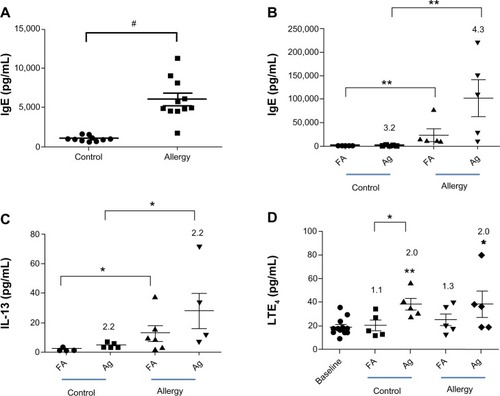
Figure 2 OVA-specific IgE was collected (A) 1 day before and (B) 2 days after AgNP/FA inhalation and OVA challenge in the control and allergic mice. The effects of AgNP/FA on (C) IL-13 levels in the BALF and (D) LTE4 levels in the urine were determined in control and allergic mice.
Notes: Values are expressed as the mean ± standard deviation; n=5–6. #P<0.001;**P<0.01; *P<0.05.
Abbreviations: AgNP, silver nanoparticles; BALF, bronchoalveolar lavage fluid; FA, filtered air; IgE, immunoglobulin E; IL, interleukin; LTE4, leukotriene E4; OVA ovalbumin.
Determination of Penh
A whole-body plethysmograph system (Buxco Electronics, Inc., Wilmington, NC, USA) was used to determine the immediate Penh before and after AgNP exposure and the Penh to methacholine aerosol exposure in unanesthetized and unrestrained mice. The calibration and principles of Penh measurement using this system have been described in previous studies.Citation18,Citation24,Citation25 After acclimatization of the mice in the chamber for 5 minutes, the airway responses were measured for 3 minutes, which represented the baseline response before exposure to phosphate-buffered saline (PBS) or methacholine. PBS or methacholine (5, 10, and 25 mg/mL) was nebulized through an inlet in the main chamber for 3 minutes. The Penh was measured for 3 minutes after exposure to PBS or methacholine, and the signals representing airway reactivity were recorded in accordance with previous studies.Citation18,Citation24 Penh reflects changes in the waveform of the chamber pressure signal from both inspiration and expiration.
Animal necropsy, sample collection, and analysis
Animal necropsy and BALF, blood, and tissue collections were performed as described previously.Citation6 Briefly, animals were euthanized with a single intraperitoneal injection of 2 mL of sodium pentobarbitone (200 mg/mL) after the determination of Penh. A single 1 mL volume of PBS was used to lavage the lungs. We retained this first BALF in a separate tube to analyze biochemical markers. Subsequently, we lavaged the lungs a further three times with 1 mL volumes of PBS. All samples were centrifuged at 1,500 × g for 5 minutes at 4°C, the supernatant was removed and the cell pellet from the first lavage was combined with the cells from the subsequent lavage before resuspension in 1 mL of PBS. Cytospin preparations were made using 10,000 cells centrifuged at 15 × g for 3 minutes onto glass slides. Two hundred cells were counted per slide. The differential cells in the BALF samples were treated with Liu’s stain (ASK, Taipei, Taiwan) and identified under light microscopyCitation26 The differential cell counts were presented in percentages of the total number of cells. The plasma OVA-specific IgE levels before (on day 15) and after (on day 23) AgNP exposure and OVA challenge were measured using an enzyme-linked immunosorbent assay (ELISA; R&D Systems, Inc, Minneapolis, MN, USA).Citation18 The proinflammatory cytokine interleukin-13 (IL-13) was quantified in the BALF samples using ELISA in accordance with the manufacturer’s instructions (R&D Systems).
Urinary leukotriene E4 and 8-hydroxy-2′-deoxyguanosine
Urine and feces samples were collected from each mouse during the 8 consecutive exposure days (between days 15 and 22). Samples were collected every 18 hours post-exposure. The urinary leukotriene E4 (LTE4) level was measured using an enzyme immunoassay (Cayman Chemical Company, Ann Arbor, MI, USA) in accordance with the manufacturer’s instructions. The principle of the immunoassay has been described previously in a clinical studyCitation27 Briefly, the assay is based on the competition between LTE4 and an LTE4–acetylcholinesterase conjugate for a limited amount of LTE4 antiserum. A PowerWave microplate reader (BioTek Instruments, Inc., Winooski, VT, USA) was used to determine the absorbance of LTE4 at 410 nm. In addition, an ELISA kit (JaICA, Tokyo, Japan) was used to determine the oxidative DNA damage, which was assessed by measuring the urinary 8-hydroxy-2′-deoxyguanosine (8-OHdG) levels; the absorbance was measured on a microplate reader at 450 nm. The excretion ratio was used to adjust the urinary 8-OHdG levels by urination volume, collection hour, and body weight and was expressed as the 8-OHdG excretion ratio (ng · hour−1 · kg−1), in accordance with the manufacturer’s instructions.
AgNP in urine, feces and tissues
The AgNP concentrations in the urine, feces, and tissues (ie, the brain, lung, heart, liver, spleen, and kidney) were determined using inductively coupled plasma-mass spectrometry (ICP-MS; Agilent 7500C, Agilent Technologies, Santa Clara, CA, USA). The feces and tissue samples were lyophilized to obtain the dry weight. The lyophilized samples were digested using concentrated nitric acid (Thermo Fisher Scientific, Waltham, MA, USA) in a MARS 5 microwave system (CEM Corporation, Matthews, NC, USA) in CEM advanced Teflon-lined composite vessels.Citation28 The digestion temperature was increased to 150°C for 30 minutes. Nitric acid and deionized (>18 MΩ) water were added to the urine, feces, and tissue samples to a final concentration of 5% nitric acid. Nitric acid and deionized water blanks were used to detect contamination during the analysis process. A NIST standard reference material (SRM) solution was used to check the accuracy of the analyses. The recovery rate and coefficient of variation for the SRM were 97.6% and 15.7%, respectively.
Histological analysis
For histological analysis, the brain, lungs, heart, liver, spleen, and kidneys were excised and washed with ice-cold PBS. Each organ was fixed in 10% neutral buffered formalin and embedded in paraffin, sectioned, and stained with hematoxylin and eosin (H&E). A histopathologist examined the histological samples in a blinded fashion under a light microscope.
Data analysis
The statistical analyses were performed using GraphPad version 5 (GraphPad Software, Inc., La Jolla, CA, USA) for Windows. The Mann–Whitney U-test was used for comparisons between groups.Citation29 The level of significance was set at P<0.05.
Results
Characterization of AgNP
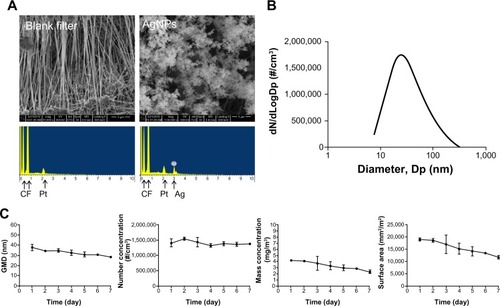
The AgNP spheres generated using the evaporation-condensation method were physicochemically characterized using an SEM equipped with EDX. Comparison of the EDX spectrum of the filter with and without collecting the AgNP demonstrated that only silver-containing NPs were produced by the system () along with the background elemental signals from the Teflon substrate (carbon [C] and fluorine [F]) and coating material (Pt). The SEM-EDX results excluded the possibility that other uncertain effects were introduced by impurities or contamination during the AgNP generation processes. The AgNP produced using this system demonstrated a normal number-size distribution (). In , the geometric mean diameter and the daily average exposure concentrations of the AgNP based on their number, mass, and surface area, as determined by SMPS, are presented. The corresponding numerical average values (standard deviation [SD]) were 33 nm GMD (2.1 for GSD), 1.4 × 10⁷ (7.0 × 10⁴) #/cm3 for number concentration, 3.3 (0.7) mg/m3 for mass concentration, and 1.6 × 10⁴ (2.7 × 10³) mm2/m3 for surface area concentration (). The total number concentration was stable, although the other three parameters of the AgNP distributions decreased slightly over the exposure period (7 days; ). In general, the AgNP generated and delivered to the whole-body exposure chamber were stable and uniform in size, number, and mass concentration and surface area over the exposure period.
Figure 3 (A) Scanning electron microscopy images of AgNP collected from the evaporation-coagulation AgNP generation system and EDX data of the blank Teflon substrate and AgNP collected on the Teflon substrate. (B) Number-size distribution of AgNP produced by the evaporation-coagulation system. (C) Daily change in average GMD, number concentration, and mass concentration of AgNP measured in the whole-body exposure chamber.
Abbreviations: AgNP, silver nanoparticles; EDX, energy-dispersive X-ray spectroscopy; GMD, geometric mean diameter.
AgNP increased Penh
A significant Penh response to methacholine was not observed in the allergic and control groups before AgNP exposure (). After AgNP exposure and OVA challenge, dose-dependent responses to methacholine were observed in the allergic and control groups (). In the allergic mice treated with 25 mg/mL methacholine, AgNP exposure increased the Penh levels 14.5-fold compared to the baseline values (P<0.001; ); exposure of the allergic mice to FA increased the Penh levels 9.5-fold compared with the baseline values (P<0.001). Exposure of the control mice to the AgNP and FA increased the Penh levels 8.2-fold (P<0.001) and 4.7-fold (P<0.001), respectively, compared to the baseline levels for 25 mg/mL methacholine. Following the administration of PBS, significant changes in the Penh compared with baseline were not observed. Furthermore, there was no significant increase in the Penh levels after AgNP exposure compared to the Penh levels after FA exposure in the allergic and control mice.
Figure 4 Penh response to aerosolized methacholine measured (A) 1 day before AgNP/FA exposure and OVA challenge, and (B) 1 day after AgNP/FA exposure and OVA challenge in the control (FA-C and Ag-C) and allergic mice (FA-A and Ag-A). Penh response to 5 (M5), 10 (M10), and 25 mg/mL methacholine (M25) measured (C) 1 day after AgNP/FA exposure and OVA challenge, and (D) 1 day before and after AgNP/FA exposure and OVA challenge in the control and allergic mice.
Notes: Values are expressed as the mean ± standard deviation; n=5–6. #P<0.001; **P<0.01; *P<0.05.
Abbreviations: A, antigen; AgNP, silver nanoparticles; C, control; FA, filtered air; M, methacoline; OVA, ovalbumin; PBS, phosphate-buffered saline; Penh, enhanced pause.
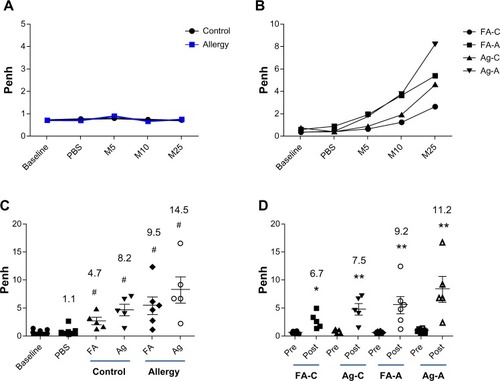
The Penh responses in the allergic mice were 11.2-fold higher than before AgNP exposure and OVA challenge (P<0.01; ) and 9.2-fold higher than before FA exposure and OVA challenge (P<0.01). The control mice exhibited a similar increase in Penh levels; however, this increase was lower than observed in the allergic mice, ie, 7.5-fold higher than before AgNP exposure (P<0.01) and 6.7-fold higher than before FA exposure (P<0.01; ).
Effects of inhaled AgNP on allergic development
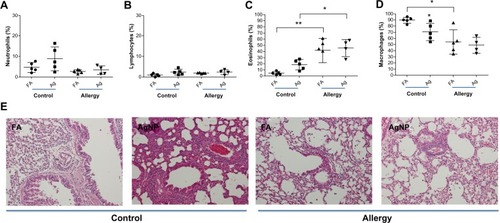
A slight increase in the percentage of neutrophils and lymphocytes were observed in the BALF of the allergic and control mice after 3.3 mg/m3 AgNP exposure and OVA challenge compared to after FA exposure (); however, these differences were not statistically significant. In the control mice, a significant increase in the percentage of eosinophils was observed after AgNP exposure compared to after FA exposure (P<0.001; ), whereas a significant difference in the eosinophil percentage was not observed in the allergic mice after the AgNP and FA exposures. By contrast, the eosinophil percentage was significantly higher in the allergic mice than in the control mice after the AgNP and FA exposures (P<0.05; ). When exposed to AgNP, both groups of mice, particularly the control mice, demonstrated a decrease in the percentage of BALF macrophages compared to the mice exposed to FA (P<0.05, ). Moreover, the allergic mice exposed to FA exhibited significantly lower macrophage levels than the control mice (P<0.05; ). The histological observations were consistent with the cytological results, which showed that lymphocytic and neutrophilic inflammatory infiltration was present in the control mice exposed to AgNP and the allergic mice exposed to FA or AgNP (); this infiltration was more prominent in the control mice exposed to the AgNP. In particular, interstitial inflammation occurred in the bronchial center (), with eosinophils and macrophages infiltrating the lungs, particularly in the allergic mice.
Figure 5 Percentages of (A) BALF neutrophils, (B) lymphocytes, (C) eosinophils, and (D) macrophages recovered 2 days after AgNP/FA exposure and OVA challenge in control and allergic mice. (E) Photomicrographs (200×) of hematoxylin and eosin staining of the lungs from the control and allergic mice after AgNP/FA exposure and OVA challenge. In the control mice, AgNP exposure induced lymphocytic and neutrophilic inflammatory infiltration; in the allergic mice, AgNP/FA exposure resulted in lymphocytic and neutrophilic inflammation as well as the recruitment of eosinophils and macrophages into the lungs.
Notes: Values are expressed as the mean ± standard deviation; n=5–6. **P<0.01; *P<0.05.
Abbreviations: AgNP, silver nanoparticles; BALF, bronchoalveolar lavage fluid; FA, filtered air; OVA ovalbumin.
After exposure to the AgNP, the allergic mice demonstrated higher levels of allergic and inflammatory responses than the control mice, as determined by the serum levels of OVA-specific IgE (P<0.05, ) and the BALF levels of IL-13 (P<0.05, ), respectively, in samples collected 2 days after OVA challenge. In the allergic mice, AgNP inhalation resulted in IgE levels that were 4.3-fold higher and IL-13 levels that were 2.2-fold higher than after FA inhalation (). In the control mice, AgNP exposure produced IgE and IL-13 responses similar to those in the allergic mice, which were 3.2-fold higher and 2.2-fold higher, respectively, compared to after FA exposure.
A significant difference in the LTE4 level was not observed in the ratios of allergic mice to control mice after the AgNP and FA exposures over the 7-day period. On the last day of exposure, the AgNP induced a 2-fold increase in the LTE4 levels compared to the baseline levels before exposure in both the allergic and control mice (). In addition, after FA exposure, the LTE4 levels were 1.1-fold higher than baseline in the control mice and 1.3-fold higher than baseline in the allergic mice (). Differences were only observed in the control mice with respect to the AgNP and FA exposures (P<0.05; ).
Oxidative stress induced by AgNP
Throughout the exposure period, AgNP exposure resulted in a slight increase in the 8-OHdG levels in the allergic mice compared to the control mice, after adjustment for the levels during FA exposure (); however, the difference was not statistically significant. On the last day of exposure, the AgNP produced 5.2- and 3.9-fold increases in 8-OHdG formation relative to the baseline 8-OHdG levels in the allergic and control mice, respectively (P<0.01). Furthermore, the 8-OHdG levels induced by AgNP inhalation were significantly higher than the levels induced by FA exposure in the allergic and control mice (P<0.05).
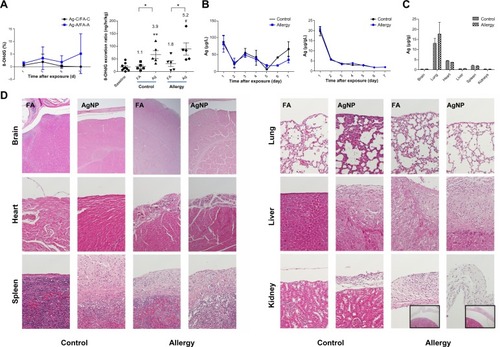
Figure 6 (A) Effect of AgNP on the 8-OHdG percentage (ratios of the AgNP exposure group to the FA exposure group; Ag/FA) in the control and allergic mice determined over 7 successive exposure days; comparisons between AgNP/FA in the control and allergic mice with respect to the 8-OHdG excretion ratio (ng/hour/kg) determined on the last day of exposure. (B) AgNP excretion in the urine and feces over the 7 successive days of exposure in the control and allergic mice. (C) Ag distribution in the brain, lungs, heart, liver, spleen, and kidneys after AgNP exposure. (D) Photomicrographs (200×) of hematoxylin and eosin staining of the brain, lungs, heart, liver, spleen, and kidneys from the control and allergic mice after AgNP/FA exposure and OVA challenge. Significant histological changes were not observed in the peri-brain or peri-lung. Focal dystrophic calcification was observed in the pericardium in the allergic mice exposed to AgNP/FA. Fibrosis with inflammation and dystrophic calcification were observed in the capsule of the liver and spleen of the control mice exposed to AgNP and the allergic mice exposed to AgNP/FA. These mice also demonstrated focal and mild inflammation in the perirenal soft tissue (bottom-right, 20× for allergic mice).
Notes: Values are expressed as the mean ± standard deviation; n=5–6; #P<0.001; **P<0.01; *P<0.05.
Abbreviations: 8-OHdG, urinary 8-hydroxy-2′-deoxyguanosine; A antigen; Ag, silver; AgNP, silver nanoparticles; C, control; FA, filtered air; OVA ovalbumin.
Excretion and tissue distribution of AgNP
AgNP concentrations in the urine and feces were determined over the 7 consecutive days of exposure in the allergic and control mice. The brain, lungs, heart, liver, spleen, and kidney were collected from the allergic and control mice and were analyzed for Ag levels. Significant differences were not observed between the allergic and control mice in the Ag concentrations in the urine, feces, or tissues (). The level of Ag excretion in the urine was insignificant over the 7 day period (17–80 μg/g; ), whereas the Ag concentration in the feces decreased significantly 1 day after exposure and was maintained at a stable level after 3 days of exposure (2–21 μg/g; ). After 7 days of exposure, the AgNP had accumulated predominantly in the lungs (17.6 μg/g), followed in decreasing order by the heart (3.6 μg/g), spleen (1.9 μg/g), liver (0.6 μg/g), kidneys (0.3 μg/g), and brain (0.3 μg/g; ). There was no difference between the AgNP and FA groups regarding the Ag levels in the spleen, liver, kidneys, and brain.
Histopathology
Changes in the histology of the brain, lungs, heart, liver, spleen, and kidneys were evaluated after AgNP inhalation and OVA challenge. Importantly, consistent histopathological changes were observed in the peri-tissues. Focal dystrophic calcification was observed in the pericardium of the allergic mice exposed to the AgNP or FA (). Fibrosis accompanied by inflammation and dystrophic calcification was observed in the capsule of the liver and spleen in the control mice exposed to the AgNP and in the allergic mice exposed to the AgNP or FA (). In addition, these mice exhibited focal and mild inflammation in the perirenal soft tissue.
Discussion and conclusions
To investigate the effects of AgNP in healthy and allergic individuals, the clinical markers of asthma, ie, IgE and IL-13 together with other markers (ie, LTE4) suggested by Szefler et al,Citation30 were used to determine the allergenicity and toxicity of AgNP generated using the evaporation-condensation method in allergen provocation mouse models. Our results demonstrated that the successive inhalation of AgNP produced a positive allergic response that regulated asthmatic responses, inflammatory responses, and oxidative stress in healthy mice. The asthmatic exacerbation responses partially occurred in the AgNP-exposed mice. In addition, we examined the excretion and accumulation of AgNP in the major tissues and examined the histopathology of these tissues after AgNP inhalation. Our results demonstrated that after inhalation for 7 days, the majority of the AgNP had accumulated in the lungs, with bronchiolocentric interstitial inflammation and inflammatory responses in the pericardium, capsules of the liver and spleen, and perirenal soft tissue, indicating that for nanomedical applications, AgNP inhalation should be used with caution.
Inhalation is a major route for occupational and environmental exposure and is the most relevant route with respect to safety assessment studies. Landsiedel et al suggested the urgency of performing toxicokinetic and inhalation studies to investigate the hazards associated with NP exposure.Citation31 The evaporation-condensation method was used to produce AgNP for the investigation of allergic responses after successive inhalation of AgNP in mice, and the principle of the method has been described by Singh et al.Citation20 The advantage of this system is that AgNP can be generated continuously and stably for long-term inhalation within a range of levels, reflecting the natural exposure route for respirable NPs rather than exposure via intratracheal instillation or pulmonary aspiration. Moreover, the SEM-EDX showed that the spherical AgNPs generated by this system were uncontaminated, suggesting that the allergenicity and toxicity observed in this study were attributable to the AgNP.
Allergic asthma is a chronic disease broadly defined by inflammation of the airways associated with Penh and mucus hypersecretion.Citation32 Penh was determined based on the airway response to methacholine inhalation. Examination of the airway responses to methacholine before and after AgNP inhalation and OVA challenge demonstrated that OVA sensitization alone induced an insignificant alteration in Penh (relative to the responses in the control mice) and significantly increased OVA-specific IgE production in the allergic mice compared to the levels observed before AgNP exposure and OVA challenge. AgNP exposure and OVA challenge induced the highest increase in Penh to methacholine and OVA-specific IgE in the allergic mice compared to the control mice. Therefore, this allergen provocation model is suitable for the evaluation of airway responses after AgNP exposure. Importantly, the Penh was changed moderately by AgNP alone in the control mice or by AgNP/FA in the OVA-sensitized mice. The effect was not observed in the AgNP-treated and OVA-sensitized mice. Previous studies have established that AgNP are causative agents of asthma development,Citation33,Citation34 and the disease could be attributed to inflammatory responses. Indeed, our findings also suggested that the exposure of healthy mice to AgNP resulted in an increase in inflammatory reactions (ie, interstitial lymphocytic and neutrophilic inflammatory infiltration in the lungs). However, a previous study showed that AgNP inhalation attenuated airway inflammation and hyperresponsiveness; the contrasting findings could have resulted from the exposure concentration.Citation16 Importantly, we observed a mild increase in Penh after consecutive AgNP and OVA challenge in the allergic mice. Moreover, a significant difference was not observed in the lymphocytic and neutrophilic inflammatory infiltration in the lungs of the allergic mice after AgNP or FA inhalation. Additionally, the BALF macrophages decreased after AgNP (allergic and control) and FA exposure (allergic), which was consistent with a previous study.Citation25 This decrease may have occurred because the alveolar macrophages became a part of the specific immune response and ingested the AgNP for presentation to lymphocytes. The other important histological finding was the bronchiolocentric interstitial inflammatory responses in the allergic and control mice exposed to the AgNP, which indicates the progression of bronchiolocentric fibrosis. Bronchiolocentric fibrosis is characterized by the pathological pattern of constrictive fibrotic bronchiolitis obliterans,Citation35 which is related to airflow obstruction. Therefore, we suggest that the AgNP induced the increased airway response and bronchiolocentric inflammation.
The clinical quantification of inflammatory cells in the airway demonstrated that the predominant inflammatory cells responsible for the asthmatic inflammation were eosinophils, T helper (Th) lymphocytes, mast cells, and basophils.Citation3 Eosinophilic inflammation of the airways accompanied by an increase in activated and degranulated eosinophils is the phenotype of allergic and nonallergic asthma.Citation36 This study demonstrated a significant increase in the recruitment of eosinophils in the lungs of the allergic mice compared to the healthy controls under the same exposure conditions (FA/AgNP). A previous study investigated the toxicity of metal nanoparticlesCitation37 and suggested that the allergenicity of nanoparticles may depend on its physicochemical characteristics. Our observation was consistent with the observed levels of OVA-specific IgE, indicating that specific IgE binds to mast cell receptors and initiates a series of membrane events that increase the levels of mediators (eg, histamine). The sequence of cellular events may exacerbate asthma symptoms, as reflected in the allergic reactions. Furthermore, the recruitment of eosinophils in the lungs is primarily controlled by Th lymphocytes and is enhanced by cytokines (eg, IL-13);Citation38 infiltration is characteristic of airway inflammation during bronchial asthma. Lymphocytes, including T and B cells, are considered cells of the adaptive immune system. In allergic reactions (ie, asthma), adaptive immunity requires antigen-presenting cells to stimulate Th2 cell responses.Citation39 Th2 cells produce several cytokines, such as IL-5, which regulates allergen-specific IgE and IL-13, the latter of which is associated with airway responses.Citation39,Citation40 Additionally, IL-13 exerts important effects on both structural and inflammatory cells within the airway and has the capacity to initiate the clinical features of airway diseases.Citation41 In this study, significantly increased levels of IL-13 were observed in the BALF of the mice exposed to AgNP. Our results indicated that the successive inhalation of AgNP plus OVA challenge resulted in eosinophilic recruitment in the lungs of the healthy control mice, suggesting that AgNP inhalation induces allergic reactions in healthy and allergic mice.
Urinary LTE4 is a known marker of cysteinyl leukotriene activity and is associated with allergic inflammation.Citation30 In this study, LTE4 was used as a supplementary marker for asthmatic reactions, as suggested by Szefler et al.Citation30 LTE4 is associated with allergic inflammation,Citation42 and this inflammation may be attributed to oxidative stress imbalance. An increasing number of studies have demonstrated the potency of the oxidative stress induced by NP exposure.Citation16,Citation43 Continuous AgNP inhalation induced significant LTE4 production in the allergic and control mice. We determined that the AgNP significantly induced the production of systemic oxidative stress in the allergic mice. AgNP inhalation by allergic/healthy mice may increase oxidative stress, which could associate with the increased LTE4 and IL-13 levels.
Before AgNP can be applied extensively in nanomedicine, it is important to evaluate their excretion, distribution, and toxicity. This study showed that after sustained exposure for 7 days, few AgNP were excreted via the urinary and digestive systems, and the inhaled AgNP accumulated predominantly in the lungs. Our results suggest that after inhalation, few AgNP are distributed in secondary tissues. Strikingly, the histopathological observations in this study demonstrated that fibrosis and dystrophic calcification were observed primarily in the pericardium, capsules of the liver and spleen, and perirenal soft tissues in the OVA-sensitized mice. These pathological changes occurred in the peripheral regions of the tissues, suggesting that peritoneal inflammation occurred in these mice. The development of fibrosis and dystrophic calcification in the peri-tissues indicates that the intraperitoneal injection of OVA may have caused the inflammatory response in the peritoneum, which led to inflammatory reactions on the surface of these tissues. Notably, the inflammatory responses in the peritoneum were also observed in the control mice after AgNP inhalation; we suspect that this inflammation was caused by the inhalation of AgNP. A previous study demonstrated that 30 mg/m3 of carbon nanotubes reached the subpleura of mice after 6 hours of inhalation and resulted in focal inflammatory cell infiltration.Citation44 A similar finding was observed in office workers; after inhalation into the lungs, carbon NPs could be transported via the lymphatic and blood vessels, after which they accumulated in the peritoneum.Citation45 Our data on AgNP excretion and distribution and the histopathological examination indicated that the exposure of the mice to AgNP allowed focal accumulation of these NPs in the respiratory system, and no significant difference in Ag levels between the AgNP and FA control mice was detected in the spleen, liver, or kidneys. Therefore, we suggest that the AgNP were transported via the lymph nodes from the lungs to the abdominal cavity and caused peritoneal inflammation. The safety of AgNP in healthy and allergic subjects requires further investigation.
In summary, our study provides a better understanding of the allergenicity and toxicity of AgNP inhalation in asthma. This study suggests that AgNP inhalation has allergic and inflammatory effects in both healthy and allergic mice, which exhibited bronchiolocentric inflammatory infiltration. Furthermore, the inhaled AgNP accumulated predominantly in the lungs after 7 days of exposure and induced inflammatory responses in the peritoneum. However, further study regarding the use of house dust mites for the sensitization of mice is required. The allergic responses caused by AgNP synthesized using wet chemical methods should be investigated. Given this uncertainty, precautions that minimize inhalation during AgNP administration would be prudent until further studies can assess the long-term pulmonary and peripheral cytological responses to repeated AgNP exposure. The safety of AgNP in airway therapeutic strategies should be examined carefully before commercial application.
Acknowledgments
The authors wish to thank Dr Yuan-Horng Yan, Dr Kuo-Liang Huang, Miss Yin-Jyun Lin, and Miss Karen Cheng for their technical assistance for this research. This study was founded by the National Science Council of Taiwan (grant number 100-2621-M-002-005 and 101-2621-M-002-004) and Taipei Medical University (TMU101-AE1-B53).
Disclosure
The authors report no conflicts of interest in this work.
References
- Global Initiative for Asthma [homepage on the Internet]Global Strategy for Asthma Management and Prevention 2011Publisher2011 Available from: http://www.ginasthma.org/local/uploads/files/GINA_Report_March13.pdfAccessed September 18, 2013
- ToTStanojevicSMooresGGlobal asthma prevalence in adults: findings from the cross-sectional world health surveyBMC Public Health20121220422429515
- KazaniSIsraelEUpdate in asthma 2011Am J Respir Crit Care Med20121861354022753688
- LaumbachRJKipenHMRespiratory health effects of air pollution: update on biomass smoke and traffic pollutionJ Allergy Clin Immunol20121291311 quiz 1222196520
- BrunekreefBForsbergBEpidemiological evidence of effects of coarse airborne particles on healthEur Respir J200526230931816055881
- LiNWangMBrambleLAThe adjuvant effect of ambient particulate matter is closely reflected by the particulate oxidant potentialEnviron Health Perspect200911771116112319654922
- AlbergTCasseeFRGroengECDybingELøvikMFine ambient particles from various sites in europe exerted a greater IgE adjuvant effect than coarse ambient particles in a mouse modelJ Toxicol Environ Health A200972111318979350
- LiuHYangDYangHComparative study of respiratory tract immune toxicity induced by three sterilisation nanoparticles: silver, zinc oxide and titanium dioxideJ Hazard Mater201324824947848623972665
- LeeSKimMSLeeDThe comparative immunotoxicity of mesoporous silica nanoparticles and colloidal silica nanoparticles in miceInt J Nanomedicine2013814715823326190
- RobertsMSRobertsMJRobertsonTAIn vitro and in vivo imaging of xenobiotic transport in human skin and in the rat liverJ Biophotonics20081647849319343674
- LeeCNWangYMLaiWFSuper-paramagnetic iron oxide nanoparticles for use in extrapulmonary tuberculosis diagnosisClin Microbiol Infect2012186E149E15722439904
- SzelenyiINanomedicine: evolutionary and revolutionary developments in the treatment of certain inflammatory diseasesInflamm Res20126111922057873
- ChoWSDuffinRHowieSEProgressive severe lung injury by zinc oxide nanoparticles; the role of Zn2+ dissolution inside lysosomesPart Fibre Toxicol201182721896169
- BeckettWSChalupaDFPauly-BrownAComparing inhaled ultrafine versus fine zinc oxide particles in healthy adults: a human inhalation studyAm J Respir Crit Care Med2005171101129113515735058
- ChaloupkaKMalamYSeifalianAMNanosilver as a new generation of nanoproduct in biomedical applicationsTrends Biotechnol2010281158058820724010
- ParkHSKimKHJangSAttenuation of allergic airway inflammation and hyperresponsiveness in a murine model of asthma by silver nanoparticlesInt J Nanomedicine2010550551520957173
- JangSParkJWChaHRSilver nanoparticles modify VEGF signaling pathway and mucus hypersecretion in allergic airway inflammationInt J Nanomedicine201271329134322457593
- HaoMComierSWangMLeeJJNelADiesel exhaust particles exert acute effects on airway inflammation and function in murine allergen provocation modelsJ Allergy Clin Immunol2003112590591414610479
- HoMWuKYCheinHMChenLCChengTJPulmonary toxicity of inhaled nanoscale and fine zinc oxide particles: mass and surface area as an exposure metricInhal Toxicol2011231494795622122307
- SinghYJavierJRNEhrmanSHMagnussonMHDeppertKApproaches to increasing yield in evaporation/condensation nanoparticle generationJ Aerosol Sci200233913091325
- MaciejczykPChenLCEffects of subchronic exposures to concentrated ambient particles (CAPs) in mice. VIII. Source-related daily variations in in vitro responses to CAPsInhal Toxicol2005174–524325315804942
- MorenoTGibbonsWJonesTRichardsRThe geology of ambient aerosols: characterising urban and rural/coastal silicate PM10-12.5 and PM2.5 using high-volume cascade collection and scanning electron microscopyAtmos Environ2003373042654276
- PichavantMGoyaSHamelmannEGelfandEWUmetsuDTAnimal models of airway sensitizationCurr Protoc Immunol2007 Chapter 15: Unit 15.18
- JangASChoiISLeeJHParkCSParkCSProlonged ozone exposure in an allergic airway disease model: adaptation of airway responsiveness and airway remodelingRespir Res200672416472404
- GavettSHHaykal-CoatesNCopelandLBHeinrichJGilmourMIMetal composition of ambient PM2.5 influences severity of allergic airways disease in miceEnviron Health Perspect2003111121471147712948886
- WanGHLiCSLinRHAirborne endotoxin exposure and the development of airway antigen-specific allergic responsesClin Exp Allergy200030342643210691903
- MichelettoCTognellaSViscontiMTrevisanFDal NegroRWChanges in urinary LTE4 and nasal functions following nasal provocation test with ASA in ASA-tolerant and -intolerant asthmaticsRespir Med2006100122144215016678396
- JonesTMorenoTBéruBéKRichardsRThe physicochemical characterisation of microscopic airborne particles in south Wales: a review of the locations and methodologiesSci Total Environ20063601–3435916257436
- SitkauskieneBRådingerMBossiosAJohanssonAKSakalauskasRLötvallJAirway allergen exposure stimulates bone marrow eosinophilia partly via IL-9Respir Res200563315823208
- SzeflerSJWenzelSBrownRAsthma outcomes: biomarkersJ Allergy Clin Immunol2012129Suppl 3S9S2322386512
- LandsiedelRMa-HockLHaussmannHJvan RavenzwaayBKayserMWienchKInhalation studies for the safety assessment of nanomaterials: status quo and the way forwardWiley Interdiscip Rev Nanomed Nanobiotechnol20124439941322639437
- KimSHHongJHLeeYCUrsolic acid, a potential PPARγ agonist, suppresses ovalbumin-induced airway inflammation and Penh by down-regulating IL-5, IL-13, and IL-17 in a mouse model of allergic asthmaEur J Pharmacol20137011–313114323201068
- XuYTangHLiuJHWangHLiuYEvaluation of the adjuvant effect of silver nanoparticles both in vitro and in vivoToxicol Lett20132191424823454833
- BezemerGFBauerSMOberdörsterGActivation of pulmonary dendritic cells and Th2-type inflammatory responses on instillation of engineered, environmental diesel emission source or ambient air pollutant particles in vivoJ Innate Immun20113215016621099199
- CordierJFChallenges in pulmonary fibrosis. 2: Bronchiolocentric fibrosisThorax200762763864917600295
- ChungKFInflammatory biomarkers in severe asthmaCurr Opin Pulm Med2012181354122045348
- ChoWSDuffinRPolandCADifferential pro-inflammatory effects of metal oxide nanoparticles and their soluble ions in vitro and in vivo; zinc and copper nanoparticles, but not their ions, recruit eosinophils to the lungsNanotoxicology201261223521332300
- MaesTProvoostSLanckackerEAMouse models to unravel the role of inhaled pollutants on allergic sensitization and airway inflammationRespir Res201011720092634
- LinKWLiJFinnPWEmerging pathways in asthma: innate and adaptive interactionsBiochim Biophys Acta20111810111052105821596099
- Wills-KarpMThe gene encoding interleukin-13: a susceptibility locus for asthma and related traitsRespir Res200011192311667960
- BrightlingCESahaSHollinsFInterleukin-13: prospects for new treatmentsClin Exp Allergy2010401424919878194
- ParuchuriSTashimoHFengCLeukotriene E4-induced pulmonary inflammation is mediated by the P2Y12 receptorJ Exp Med2009206112543255519822647
- MeiNZhangYChenYSilver nanoparticle-induced mutations and oxidative stress in mouse lymphoma cellsEnviron Mol Mutagen201253640941922576574
- Ryman-RasmussenJPCestaMFBrodyARInhaled carbon nanotubes reach the subpleural tissue in miceNat Nanotechnol200941174775119893520
- TheegartenDBoukerchaSPhilippouSAnhennOSubmesothelial deposition of carbon nanoparticles after toner exposition: case reportDiagn Pathol201057721126365