
 ?Mathematical formulae have been encoded as MathML and are displayed in this HTML version using MathJax in order to improve their display. Uncheck the box to turn MathJax off. This feature requires Javascript. Click on a formula to zoom.
Abstract
In this study, four types of standardized ZnO nanoparticles were prepared for assessment of their potential biological risk. Powder-phased ZnO nanoparticles with different particle sizes (20 nm and 100 nm) were coated with citrate or L-serine to induce a negative or positive surface charge, respectively. The four types of coated ZnO nanoparticles were subjected to physicochemical evaluation according to the guidelines published by the Organisation for Economic Cooperation and Development. All four samples had a well crystallized Wurtzite phase, with particle sizes of ∼30 nm and ∼70 nm after coating with organic molecules. The coating agents were determined to have attached to the ZnO surfaces through either electrostatic interaction or partial coordination bonding. Electrokinetic measurements showed that the surface charges of the ZnO nanoparticles were successfully modified to be negative (about −40 mV) or positive (about +25 mV). Although all the four types of ZnO nanoparticles showed some agglomeration when suspended in water according to dynamic light scattering analysis, they had clearly distinguishable particle size and surface charge parameters and well defined physicochemical properties.
Introduction
ZnO, one of the most widely utilized nanomaterials, has been of considerable interest in both research and industry, with applications as sunscreens, rubber, dyestuffs, animal feed ingredients, antistatic paint additives, and photocatalysts.Citation1,Citation2 Because of their widespread uses, the toxicity and biological applicability of ZnO nanoparticles, along with other frequently used nanoparticles like TiO2, SiO2, and carbon nanoparticles, are now emerging issues.Citation3,Citation4 Many studies of the potential toxicity and ecological risk associated with such nanoparticles have been reported, but their results are controversial because the characterization of nanoparticles is not standardized.Citation5,Citation6
In this context, it is very important to ensure the reliability of experiments by using standardized nanoparticle samples with well controlled physicochemical properties, and to analyze all parameters in the samples very precisely.Citation7,Citation8 The Working Party on Manufactured Nanomaterials (WPMN) in the Organisation for Economic Cooperation and Development (OECD) Working Party on Manufactured Nanomaterials has issued a guideline suggesting various physicochemical parameters of nanomaterials for evaluation of ecotoxicity, and recommends several techniques for analysis.Citation9 These parameters include crystalline phase, particle size, chemical composition, and chemical properties for single particles, surface chemistry for powder-phased samples, and surface charge, size distribution in suspension, and solubility for colloidal samples.
This study focused mainly on preparation of standardized ZnO nanoparticle samples for biological assay and determination of their physicochemical properties using the parameters suggested by the OECD guideline. Given that particle size and surface charge are generally known to play key roles in determining the biological behavior of nanoparticles, this study focused on preparation of standardized nanoparticles with a well-defined particle size and surface charge. Nanoparticle size is reported to affect the cellular uptake of nanoparticles and their interaction with cell membranes.Citation10,Citation11 Formation of protein coronas and aggregates are also influenced by nanoparticle size.Citation12 Hydroxyapatite nanoparticles show different types of cell membrane damage as their surface charge changes from −30 mV to −10 mV,Citation13 the zeta potential of bovine serum albumin-coated nanoparticles strongly affects their cellular uptake,Citation14 and iron oxide nanoparticles exhibited surface charge-dependent DNA laddering effects when exposed to cells.Citation15
In order to control the surface charges on ZnO nanoparticles so that they have positive and negative values while preserving their particle size and colloidal behavior, coating techniques utilizing charged organic molecules have been adopted. For the purpose of minimizing the toxicity concerns considering the utility of prepared standard sample to biological evaluation, the coating agents were selected from biocompatible molecules, such as amino acids and citrate. Citrate has three carboxylates, so the positively charged ZnO surface can be modified to have a strong negative charge.Citation16 Although ZnO itself can be utilized as a positively charged sample for comparison, its surface was coated with L-serine with both cationic and anionic sites to preserve the positive surface charge of ZnO. During the coating process, extra care was taken to preserve physicochemical properties other than surface chemistry after coating with an organic moiety because treating inorganic nanoparticles with organic molecules can result in particle aggregation or crystal phase transformation.Citation17 Efforts were then made to understand the physicochemical properties of the coated ZnO nanoparticles and the chemical interaction between the ZnO and the coating agents in more depth using standardized methods to analyze the samples. Although ZnO is one of the most widely studied nanomaterials and there are many reports on the coating of ZnO nanoparticles, there are only a few trials that have comprehensively characterized these nanoparticles according to the OECD guideline.Citation9 The present paper describes a simple method for preparation of a standard ZnO sample with a controlled surface charge that can be used for biological assays without concern about any toxicity arising from the coating process. This work provides basic research data on standardized ZnO nanoparticles for biologists who intend to evaluate the toxic parameters of these nanoparticles.
Materials and methods
Preparation of surface-treated ZnO nanoparticles
ZnO nanoparticles of different sizes, ie, 20 nm (ZnOSM20) and 100 nm (ZnOAE100), were purchased from Sumitomo Osaka Cement Co, Ltd, Tokyo, Japan (Lot 141319) and American Elements, Los Angeles, CA, USA (Lot 1871511079–673), respectively. Using a previously published method,Citation18 their surfaces were coated to prepare ZnO nanoparticles with different surface charges under identical pH conditions (pH 7.0±0.3). ZnO nanoparticles with a negative surface charge (ZnOSM20(−) and ZnOAE100(−)) were prepared using citrate/HEPES buffer solution (). A 20 mM HEPES (CAS 7365-45-9; Sigma-Aldrich Co, LLC, St Louis, MO, USA) buffer solution was prepared in deionized water and titrated with a 1 M sodium carbonate solution (CAS 497-19-8; Duksan Pure Chemical Co, Ltd, Kyungki-Do, South Korea) to pH 7.0. Subsequently, 1 wt/v% sodium citrate (CAS 6132-04-3; Sigma-Aldrich Co, LLC,) was dissolved in 20 mM HEPES buffer solution, and both ZnOSM20 and ZnOAE100 were suspended in citrate/HEPES buffer solution for one minute. The products, ZnOSM20(−) and ZnOAE100(−), were resuspended for 30 seconds by vortex before testing. ZnO nanoparticles with a positive surface charge (ZnOSM20(+) and ZnOAE100(+)) were prepared using L-serine/HEPES (). 20 mM HEPES buffer solution was then prepared in deionized water and titrated with 1 M sodium carbonate solution to pH 6.0. Next, 1 wt/v% L-serine (CAS 56-45-1; Sigma-Aldrich Co, LLC) was dissolved in 20 mM HEPES buffer solution. To prepare ZnOSM20(+) and ZnOAE100(+), ZnO nanoparticles were suspended in L-serine/HEPES buffer solution for one minute. Both ZnOSM20(+) and ZnOAE100(+) were resuspended for 30 seconds by vortex before testing. summarizes the weights and molar ratios of the ZnO and coating agents.
Table 1 Weight and molar ratio of ZnO and coating agents
Physicochemical properties of surface-coated ZnO nanoparticles
X-ray diffraction (XRD) patterns were determined for all the samples (ZnOSM20, ZnOSM20(−), ZnOSM20(+), ZnOAE100, ZnOAE100(−), and ZnO AE100(+)) using an AXS D2 Phaser X-ray diffractometer (Bruker Optik GmbH, Ettlingen, Germany) with Ni-filtered Cu-Kα radiation (λ=1.5418 Å) in the 2θ range of 25–80 degrees. To verify the primary particle size and morphology of the pristine and surface-coated ZnO nanoparticles, transmission electron microscopy (TEM) images were obtained using a JEM-2100F microscope (JEOL Ltd, Tokyo, Japan) at the Korea Basic Science Institute (Kangneung, South Korea). The ZnO samples were diluted in deionized water, and a drop of suspension was loaded onto a copper grid. The specimens were dried in air and subjected to microscopic study. The average primary particle size of the ZnO nanoparticles was determined using approximately 200 randomly selected particles from the TEM images. A frequency table and a histogram of the particle size distribution were prepared and converted to a normalized distribution using Microsoft Excel® (Microsoft Office 2013; Microsoft Corporation, Redmond, WA, USA). The Student’s t-test was used to determine the size difference between the samples. The chemical composition, surface chemistry, and chemical environment around a certain element of surface-coated ZnO nanoparticle were evaluated by X-ray photoelectron spectroscopy (XPS) using a K-Alpha spectrophotometer (Thermo Fisher Scientific, Waltham, MA, USA). The X-rays generated by XPS can penetrate approximately 1 μm19 and the information depth of XPS is generally agreed as 10 nm for this instrument.Citation20 In order to validate the binding energy of Zn 2p3/2, O 1s, N 1s, and C 1s, the four peaks were analyzed by OriginPro 8 (version 8.0724; OriginLab Corporation, Northampton, MA, USA) utilizing the Gaussian function in the range of 1,025–1,015, 535–525, 405–395, and 295–275 ev, respectively. Carbon-13 magic angle spinning solid-state nuclear magnetic resonance (Bruker AXS Advance II+ 400; Korea Basic Science Institute, Daegu Center, Korea) spectra were obtained for the dry powder samples at room temperature. The Fourier transform infrared (FTIR) spectra of the samples were obtained on a Spectrum One B version 5.0 instrument (Perkin-Elmer, Downers Grove, IL, USA), using the KBr pellet method, in the range of 4,000–450 cm−1. The surface charge and hydrodynamic size were verified by evaluating the zeta potential and dynamic light scattering with an ELSZ-1000 particle size analyzer (Otsuka Electronics Co, Ltd, Osaka, Japan). All surface-coated ZnO suspensions used to analyze the zeta potential or hydrodynamic size were dispersed in deionized water in the concentration ranges of 7–200 μg/mL and 7–50 μg/mL, respectively, and were vigorously stirred at 298 K for one hour. In order to obtain reproducible data and optimize the measurement conditions, the zeta potential and hydrodynamic size measurements were carried out ten times using a zeta flow cell (Otsuka Electronics Co, Ltd) and a disposable dynamic light scattering cuvette (Ratiolab GmbH, Dreieich, Germany), and the data obtained were automatically calculated from the Smoluchowski and Contin equations, respectively. The refractive index of the deionized water was 1.330. The results, including average value and distribution pattern of zeta potential and hydrodynamic size were obtained using ELSZ version 3.00 software (Otsuka Electronics Co, Ltd). The measurement reports were acknowledged as results when the zeta potential distributions from the different height in cuvette were parabolic from its center and, at the same time, the difference between the upper and lower value was less than 40 mV. The reports on hydrodynamic size were chosen by 100 accumulated results from the software, which showed OK sign. The zeta potentials of the coated samples were analyzed after 48 hours in order to evaluate the stability of ZnO nanoparticle dispersion over time.
Results
X-ray diffraction
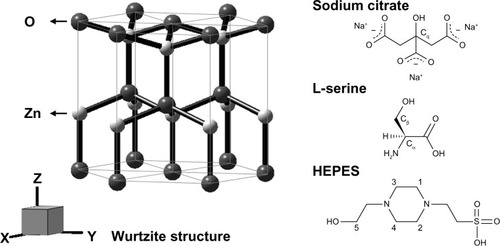
According to the powder XRD patterns, all the coated ZnO nanoparticles showed a classic hexagonal crystal Wurtzite structure (JPCDS No 36–1451), with a highly crystalline phase. Characteristic peaks at 2θ=31.8°, 34.4°, 36.3°, 47.5°, 56.6°, 62.9°, and 67.9° were assigned to the (100), (002), (101), (102), (110), (103), and (112) lattice planes.Citation21 The lattice parameters of the coated ZnO nanoparticles calculated from the 2θ values of the peaks were a=3.251 Å and c=5.206 Å, and corresponded well to those of the reference Wurtzite (a=3.249 Å and c=5.207 Å). Thus, it can be concluded that size and the surface coating process did not affect the crystalline phase of the ZnO nanoparticles. The peak intensity and width obtained from XRD patterns are related to the preferred growth of a certain crystal plane as well as the degree of crystallinity in solid crystalline materials. In small-sized materials like nanoparticles, the crystallinity or preferred growth is highly dependent on the particle size and morphology. Overall, the larger ZnO particles (ZnOAE100, ZnOAE100(−), and ZnOAE100(+)) showed 2.2-fold higher peak intensities than the smaller ZnO particles (ZnOSM20, ZnOSM20(−) and ZnOSM20(+), and ), and this result coincides well with the results of our previous study.Citation18 Additional information on the crystalline properties of the nanoparticles was obtained by calculating Scherrer’s equation, which is known to provide information on crystallite size along a certain lattice plane and crystalline size, as follows:Citation22
Figure 1 Powder X-ray diffraction patterns for (a) ZnOSM20(−), (b) ZnOSM20(+), (c) ZnOAE100(−), and (d) ZnOAE100(+).
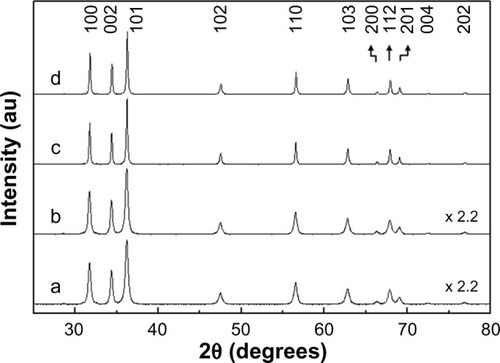
The crystallite sizes for the four coated ZnO nanoparticles were calculated utilizing the (100), (002), (101), (103), and (112) peaks. ZnOSM20, ZnOSM20(−), ZnOSM20(+), ZnOAE100, ZnOAE100(−), and ZnOAE100(+) showed crystallite sizes of 20, 19, 20, 66, 66, and 68 nm, respectively, regardless of the lattice plane, and were in good agreement with the primary particle size obtained by the microscopy studies.
Transmission electron microscopy
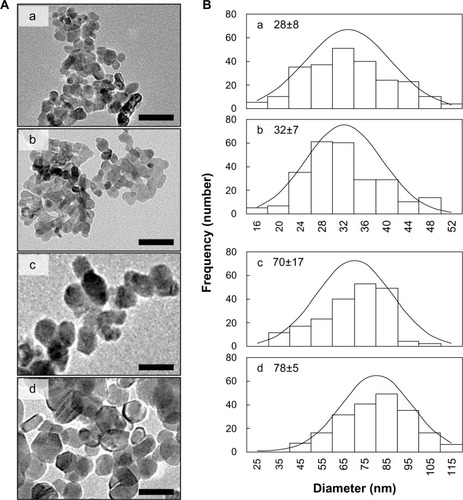
The TEM results and particle size distributions obtained from the TEM images are shown in . ZnOSM20(−), ZnOSM20(+), ZnOAE100(−), and ZnOAE100(+) had average primary particle sizes of 28, 32, 70, and 78 nm, respectively. All the particles had an irregular spherical shape, and no anisotropic growth was observed (). The particle sizes of the uncoated ZnO nanoparticles were very similar to those of the coated ones (). Size distribution histograms were obtained for 220±30 particles randomly selected from the TEM images (). Homogeneous and narrow size distributions were confirmed for all four types of coated ZnO nanoparticles. The histograms were further fitted to the normal distribution curve using Microsoft Excel®. The kurtosis and skewness values obtained lay in the ranges of −0.5∼0.2 and −0.10∼0.41, respectively, indicating that the size distributions were close to normal in spite of the slight inclination.
Figure 2 (A) Transmission electron microscopy images and (B) histogram and normal distribution from these images for (a) ZnOSM20(−), (b) ZnOSM20(+), (c) ZnOAE100(−), and (d) ZnOAE100(+).
Notes: (A) 100 nm scale bar; (B) mean ± standard deviation of approximately 200 samples. The x-axis of (a) and (c) have the same scale as (b) and (d) respectively.
X-ray photoelectron spectroscopy
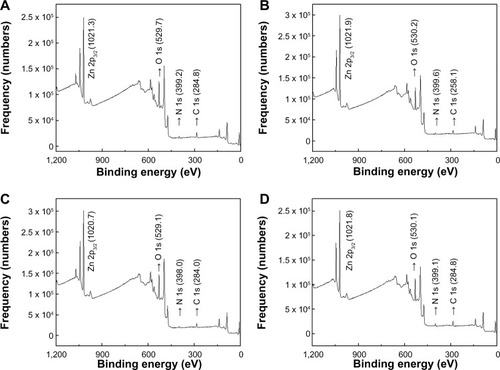
The chemical environments at the surface of the coated ZnO nanoparticles were quantitatively and qualitatively evaluated by XPS (). The XPS spectra and binding energy values for Zn 2p3/2 and O 1s in the uncoated ZnO are provided in the supporting information (). The binding energy of electrons in the Zn 2p3/2, O 1s, N 1s, and C 1s orbitals was reported to appear at 1,021, 530, 399, and 284 eV, respectively.Citation23–Citation26 All the coated ZnO nanoparticles showed strong peaks at the corresponding positions, suggesting the existence of both ZnO and the coating agents. Zn was included in the ZnO nanoparticles, and the O in both the ZnO and coating agents. Organic elements such as N and C were included in the coating agents as well as in the HEPES dispersant. Because XPS enables quantitative analysis of each element and the analysis depth is around 10 nm, the ratio of nanoparticles and coating agents at the surface of the ZnO nanoparticles could be determined.Citation19,Citation20 The empirical formulae determined at the surface of nanoparticles were (ZnO) (citrate)0.07(HEPES)0.08, (ZnO)(citrate)0.08, (HEPES)0.07, (ZnO) (L-serine)0.16(HEPES)0.00, and (ZnO)(L-serine)0.2(HEPES)0.01 for ZnOSM20(−), ZnOAE100(−), ZnOSM20(+), and ZnOAE100(+), respectively. Characteristically, the citrate-coated ZnO particles contained more of the HEPES moiety while the L-serine-coated ZnO particles contained little HEPES. The chemical environment around any given element can be evaluated based on the binding energy values of the peaks. The binding energy values of the Zn 2p3/2 electrons were higher in the 20 nm ZnO particles than in the 70 nm ZnO particles, and were also higher in the L-serine-coated ZnO particles than in the citrate-coated ZnO particles.
Figure 3 X-ray photoelectron spectra for (A) ZnOSM20(−), (B) ZnOSM20(+), (C) ZnOAE100(−), and (D) ZnOAE100(+).
Nuclear magnetic resonance spectroscopy
Solid-state 13C nuclear magnetic resonance was used to verify the existence of surface-coating organic moieties, citrate and L-serine (). As shown in , the coating agents and the citrate, L-serine, and HEPES dispersants contain various carbon centers with different chemical environments, which were clearly distinguished in the nuclear magnetic resonance spectra. All four types of coated ZnO nanoparticles showed δ11(COO−) and δ22(COO−) peaks, and these were attributed to the carboxylates in citrate and L-serine.Citation27,Citation28 In the citrate-coated ZnO nanoparticles, the characteristic peak of the quaternary carbon (Cq) of citrate was found at 76.6 ppm, and C1, C2, C3, C4, and C5 peaks originating from HEPES were observed in the range of 50–60 ppm ().Citation29 On the other hand, the nuclear magnetic resonance spectra for the L-serine-coated ZnO samples showed peaks at 63.2 ppm and 56.1 ppm, corresponding to the Cβ and Cα carbons in the amino acids.Citation28 These results again confirmed that the C, O, and N peaks in XPS were attributable to the coating agents and dispersants.
Figure 4 13C nuclear magnetic resonance results for (a) ZnOSM20(−), (b) ZnOSM20(+), (c) ZnOAE100(−), and (d) ZnOAE100(+).
Notes: As shown in , (COO−) represents carboxyl carbon of L-serine and citrate; Cα and Cβ represent peaks of L-serine; Cq represents quaternary carbon of citrate; and 1–5 represent peaks of HEPES (4-(2-hydroxyethyl)-1-piperazineethanesulfonic acid).
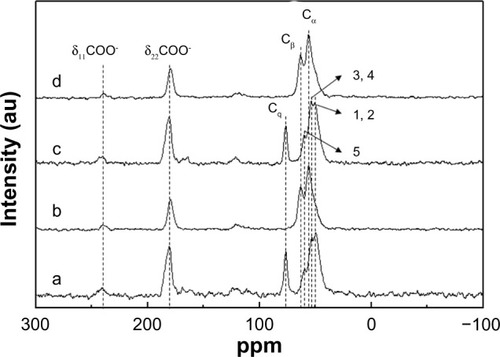
Figure 5 Schematic structure of ZnO with wurtzite phase, sodium citrate, L-serine, and HEPES.
Abbreviation: HEPES, 4-(2-hydroxyethyl)-1-piperazineethanesulfonic acid.
Fourier transform infrared spectroscopy
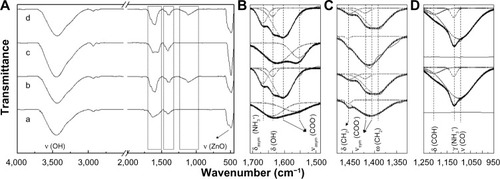
The infrared spectra (), in conjunction with the XPS and NMR spectra, provided the chemical information on both the inorganic ZnO material and the organic coating molecules, ie, citrate and L-serine. The infrared spectra for all four types of coated ZnO nanoparticles showed the expected absorption peaks corresponding to the chemical bonds existing in the ZnO or coating agents. As shown in , all four samples exhibited clear peaks at around 3,500 cm−1 and 490 cm−1, which were attributable to the ν(−OH) and ν(Zn–O) stretching vibration modes coming from the cores of the ZnO nanoparticles. shows the magnified spectra from the dotted box in , and the merged peaks were separated using the Gaussian multipeak separation function of OriginPro 8 version 8.0724. Each separated peak reflects the characteristic chemical bonds of the organic moieties. In the spectra for the L-serine-coated samples ((b) ZnOSM20(+) and (d) ZnOAE100(+)), the amine-originated bands, ie, δasym(NH3+) and γ(NH3+), could be observed at 1,656 cm−1 and 1,120 cm−1, respectively. The characteristic peaks of amino acids, ie, ω(CH2) at around 1,395 cm−1, δ(COH) at around 1,207 cm−1, and ν(CO) at 1,096 cm−1, were also clearly present (). When the carboxylic acids deprotonated, the infrared bands split into two peaks, ie, symmetric and asymmetric stretching vibrations. The L-serine-coated ZnO particles showed νasym(COO−) and νsym(COO−) at 1,600 cm−1 and 1420 cm−1, respectively, while the citrate-coated ZnO particles showed corresponding peaks at 1,564 cm−1 and 1,408 cm−1. The differences between νasym(COO−) and νsym(COO−), ie, (∆ν), a standard for evaluating the degree of coordination of carboxylate, were determined to be ∼180 cm−1 and ∼150 cm−1 for the L-serine coating and citrate coating, respectively.
Table 2 Characteristic Fourier transform infrared bands for ZnOSM20(−), ZnOSM20(+), ZnOAE100(−), and ZnOAE100(+)
Figure 6 Fourier transform infrared spectra in the ranges of (A) 4,000–450, (B) 1,710–1,490, (C) 1,490–1,320, and (D) 1,250–950 cm−1 for (a) ZnOSM20(−), (b) ZnOSM20(+), (c) ZnOAE100(−), and (d) ZnOAE100(+).
Notes: The dotted and solid lines of the pristine and multipeaks fit the spectra shown in (B), (C), and (D).
Abbreviations: ν, bond stretching; δ, bending; ω, wagging; γ, rocking (out of plane); asym, asymmetric; sym, symmetric.
Zeta potential
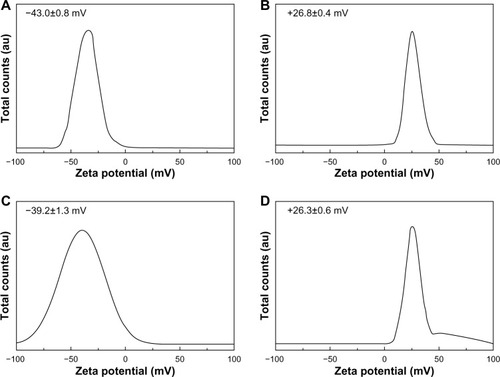
shows the zeta potential distributions for the four types of coated ZnO nanoparticles. Generally, Wurtzite-type ZnO nanoparticles are known to have positive surface charges in the as-prepared state. Before coating, the ZnO particles in this study showed zeta potentials of 28.8 mV and 26.3 mV for ZnOSM20 and ZnOAE100, respectively (). After citrate coating, these values shifted to −43.0 mV and −39.2 mV for ZnOSM20(−) and ZnOAE100(−), respectively. On the other hand, L-serine coating did not alter these values significantly, with zeta potentials of +26.8 and +26.3 mV found for ZnOSM20(+) and ZnOAE100(+), respectively. The overall zeta potentials were distributed in narrow ranges, ie, −60 to −10, +10 to +50, and 0 to +50 mV for ZnOSM20(−), ZnOSM20(+), and ZnOAE100(+), respectively (), except for ZnOAE100(−), which showed a relatively broad zeta potential distribution in the range of +10 to −100 mV. Zeta potential measurement was carried out at least three times for each sample, and the standard deviation values for all the four samples were below 2 mV. Further, the absolute values for the zeta potential were larger than 25, indicating high colloidal stability for the coated ZnO nanoparticles in deionized water. Forty-eight hours after coating, the variation in zeta potential values between the four samples was within ±5 mV (). The zeta potential values for the coated ZnO nanoparticles in the different types of medium, ie, phosphate-buffered saline (Cat 10010-023, Thermo Fisher Scientific Inc.), and Eagle’s Minimum Essential Medium (Cat 11095-080, Thermo Fisher Scientific Inc.), showed values shifted towards zero, suggesting a possible interaction between the countercharged electrolytes and the ZnO surface ().
Figure 7 Zeta potential distributions for (A) ZnOSM20(−), (B) ZnOSM20(+), (C) ZnOAE100(−), and (D) ZnOAE100(+) at pH 7.0±0.3 (mean ± standard deviation of n=10).
Dynamic light scattering
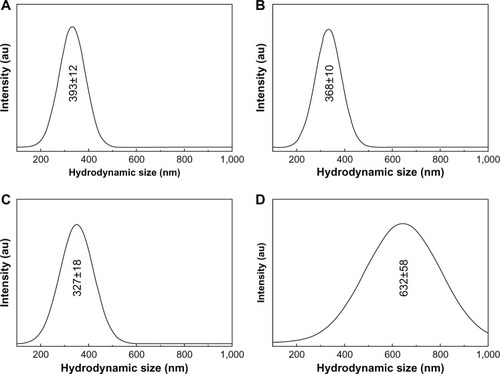
Among the important nanoparticle parameters in the suspension state, the hydrodynamic size and its distribution are considered important. The hydrodynamic sizes and particle size distribution patterns for pristine ZnO and the four types of coated ZnO nanoparticles in deionized water are shown in and , respectively. The average hydrodynamic sizes of the four samples (393, 368, 237, and 632 nm for ZnOSM20(−), ZnOSM20(+), ZnOAE100(−), and ZnOAE100(+), respectively) were larger than the primary particle size obtained by TEM and the crystallite size calculated from XRD. The hydrodynamic sizes of ZnOSM20(−), ZnOSM20(+), and ZnOAE100(−) were distributed in the range of 200–500 nm, while those of ZnOAE100(+) showed a wide distribution in the range of 300–1,000 nm.
Figure 8 Hydrodynamic size of (A) ZnOSM20(−), (B) ZnOSM20(+), (C) ZnOAE100(−), and (D) ZnOAE100(+) at pH 7.0±0.3 (mean ± standard deviation of n=3).
Discussion
The physicochemical parameters of nanomaterials relevant to ecotoxicity studies include crystalline phase, chemical composition, particle size, specific surface area, chemical properties of a single particle, surface chemistry, size distribution in suspension, and surface charge. In a previous study, we evaluated the physicochemical properties of coated ZnO nanoparticles, mainly to investigate their overall appearance, using XRD, scanning electron microscopy, and measurement of zeta potential.Citation18 In this study, we concentrated more on evaluating the surface chemical parameters of standardized ZnO nanoparticles coated with an organic moiety utilizing various spectroscopy methods. Further, in an extension of our previous report,Citation18 we studied the crystalline phase, particle size, chemical composition, and surface chemistry of coated ZnO in more detail. Further, size distribution and surface charge of coated ZnO were comprehensively studied by optimizing our characterization methods.
The XRD patterns ( and ) show that all four types of coated ZnO nanoparticles had a Wurtzite crystalline phase with good crystallinity. From the peak intensities, the 20 nm and 70 nm ZnO particles were determined to have different primary particle sizes, and the coating process was deemed not to affect the crystallinity of these nanoparticles. Analysis using Scherrer’s equation demonstrated that the crystallite size was independent of the crystal plane, implying that the ZnO nanoparticles had homogeneous crystal growth along the x, y, and z axes. The calculated crystallite sizes were comparable with the primary particle size obtained by TEM, so we could conclude that each particle was composed of one ZnO crystal. Because the surface coating did not affect the particle size, it could be determined that the surface coating process did not involve chemical reactions, such as crystal dissolution or additional growth.
The primary particle sizes of the coated ZnO nanoparticles were more precisely measured using TEM and did not show significant changes upon coating with an amino acid or a citrate. Although the particle size obtained by TEM was slightly different from the crystallite size calculated by XRD (Scherrer’s equation), it was within the error range of the measurement method used. It seemed that the average particle size increased upon coating with L-serine, but there was no statistically significant difference between citrate coating and L-serine coating (95% confidence interval). The analyzed particle size distribution was determined to be close to the normal distribution; thus, the surface coating was shown to be highly homogeneous, and no serious aggregation occurred upon coating.
The XPS spectra provided more information on the surface chemistry of the nanoparticles (signal depth ∼10 nm), including their chemical composition, chemical properties, and surface chemistry.Citation19,Citation20 Quantitative analyses at the surface of the nanoparticle samples suggested that they consisted mainly of ZnO, with some quantity of coating agent. In fact, XPS provided the ratio of the elements on the nanoparticle surface but no information concerning the molecular structure of the coating agent. Thus, the XPS and NMR results were combined to obtain the ratios of the chemicals present on the coated ZnO nanoparticles. The existence of citrate, L-serine, and HEPES was clearly confirmed by NMR, and as such, C, N, and part of O were assumed to have come from the coating agents and dispersants.
According to the results of quantitative analysis by XPS, the surfaces of both the 20 nm and 70 nm ZnO nanoparticles were sufficiently coated with either citrate or L-serine. The coating agents were not easily detached by washing because of their fairly stable interaction with the surfaces of the ZnO nanoparticles (). The binding energy of XPS sensitively reflects the chemical environment around a given element, such as oxidation state, coordination, and electron shielding effect. For example, if there was electron shielding from chemical bonds or electron-donating groups around certain elements, the binding energy values would decrease. Nanoparticles composed of metal oxides have fully coordinated metal cations in their core, whereas surface-exposed metals lack coordination. The less coordinated metal would have less of an electron shielding effect compared with the fully coordinated ones, resulting in enhancement of binding energy.Citation33 In this study, the binding energy of the Zn 2p3/2 electrons increased with decreasing particle size, and the Zn 2p3/2 binding energy was larger with the citrate coating than with the L-serine coating. It could be inferred that the 20 nm ZnO particles had larger surface areas than the 70 nm ZnO particles, and citrate is more effective in blocking surface defect sites compared with L-serine. This effectiveness can be explained by the number of sites available, ie, three carboxylates in citrate and one in L-serine.
FTIR spectroscopy, in combination with XPS and NMR, was used to evaluate the chemical properties and surface chemistry of the coated ZnO nanoparticles. When studying the surface chemistry of nanoparticles, it is important to understand the nature of the bonding between the surface ligand and the core nanoparticles. Because infrared absorption sensitively reflects chemical bonding and its force constant, infrared spectra were used to comprehend the state of the coating agents. As in the NMR spectra, the characteristic chemical bonds of citrate or L-serine were observed in the FTIR spectra, confirming that the coating process was well carried out, with no serious chemical reaction between the coating agents and ZnO. It is worth noting that the splitting width (∆νa–s) of L-serine was different from that of citrate when the carboxylic acid peak split into asymmetric and symmetric stretching. The ∆νa–s value was reported to be the largest when the carboxylate was unidentated to cation, and gradually decreased in ionic or bidentate coordination.Citation34,Citation35 The ∆νa–s of L-serine (180 cm−1) was larger than that of citrate (150 cm−1) by 30 cm−1, reflecting the different bonding nature of the coating agents and ZnO. As in a previous report showing that amino acids such as glycine or lysine bind with metal oxide nanoparticles via carboxylate-metal coordination,Citation36 part of the carboxylate in L-serine was considered to have coordinated to Zn in a unidentate manner. Although citrate can also bind to Zn via carboxylate-Zn coordination, the highly negatively charged citrate prefers electrostatic attraction with ZnO nanoparticles.
The OECD guideline suggests evaluating the zeta potential and hydrodynamic size distribution for liquid (eg, suspension, colloid) samples. Determination of the precise parameters for physicochemical properties of nanomaterials for biological assay was the aim of this study. Thus, the properties of the coated ZnO particles in aqueous media were also investigated in detail. The zeta potentials of the citrate-coated and L-serine-coated ZnO particles were positive and negative, respectively, as expected. Because the ZnO nanoparticles have positive surface charges in a neutral water suspension, they were easily modified to have negatively charged sites by citrate coating. Capping nanoparticles with citrate to give them a strong surface charge and colloidal stability is a well-known technique, and is used in the synthesis of gold nanoparticles.Citation37 L-serine, a zwitterionic molecule, was not expected to significantly change the surface charge on ZnO, and indeed the zeta potential of ZnO did not significantly change upon coating with L-serine. Instead, L-serine modified the surface of ZnO with an organic moiety, making the L-serine-coated ZnO a comparative sample for citrate-coated, negatively charged ZnO. According to the FTIR results, the carboxylates of L-serine were partly attached onto ZnO electrostatically and partly through coordination bonding. Neither bonding route affected the surface charge on the ZnO nanoparticles. Interestingly, the citrate-coated ZnOAE100(−) had a relatively wide zeta potential distribution () compared with the others, which might be due to the large amount of citrate used for coating. However, the zeta potential distribution still had a negative value, and the shape was close to a normal distribution. Thus, the four types of coated ZnO nanoparticles were evenly coated and control of surface charge via coating was successful.
The colloidal stability of suspended nanoparticles can be determined on the basis of either the zeta potential or the hydrodynamic size. The zeta potential value is a criterion that is used to evaluate interparticle repulsion via charge–charge interaction, and the hydrodynamic size can reflect aggregation or agglomeration of primary particles. According to our dynamic light scattering study, all four types of coated ZnO samples showed hydrodynamic sizes that were approximately ten-fold larger than the primary particle size. These phenomena have often been reported when powder-phased nanoparticles are dispersed in water.Citation18,Citation38,Citation39 However, formation of such agglomerations was not regarded as indicating that the samples had lost their nanosized properties because the agglomerations were reversibly redispersed by stirring. It had been confirmed that the grain boundary of ZnO nanoparticles is preserved after coating with organic moieties. Xia et alCitation38 and Dhawan and SharmaCitation39 have reported that ZnO nanoparticles larger than 200 nm can agglomerate in water. Other powdered nanoparticles, such as TiO2, SiO2, and carbon nanotubes, have been reported to form large agglomerates in aqueous medium even though their primary particles are less than 70 nm in size.Citation39 Therefore, the coated ZnO nanoparticles, in spite of their relatively large hydrodynamic size, can be regarded as having maintained their nanosized material properties.
Coating of the ZnO nanoparticles has been done to prepare standardized samples for toxicological evaluation,Citation40 and chemically well-defined ZnO nanoparticles with different coatings have been determined to have different biological behaviors, such as biological absorption and toxicity.Citation41,Citation42
Conclusion
Herein, standardized size-controlled and charge-controlled ZnO nanoparticles were developed for use in biological assays of nanomaterials. Further, the physicochemical parameters of these nanomaterials were evaluated according to the Organisation for Economic Cooperation and Development guideline, and an attempt was made to understand their precise chemical properties in detail. Using various spectroscopic and analytical techniques, four types of coated ZnO nanoparticles were characterized, focusing especially on their crystalline phase, chemical composition, single particle size, surface chemistry, and colloidal properties. The 20 nm and 70 nm ZnO nanoparticles preserved their original primary particle size and crystallinity after coating. The surface charge in water suspension was successfully controlled as highly negative or positive upon coating with charged organic molecules. The coated ligands were determined to have attached onto the ZnO surfaces through either electrostatic interactions or partial coordination bonding. Coating inorganic nanoparticles with organic molecules can be considered a simple route for controlling surface chemistry and charge while maintaining crystallinity and size. The four types of coated ZnO nanoparticles used in this study, ie, ZnOSM20(−), ZnOSM20(+), ZnOAE100(−), and ZnOAE100(+), had clearly distinguishable physicochemical properties with well-defined chemical characteristics, and can be utilized as standard samples for biological assay of nanoparticles.
Disclosure
The authors report no conflicts of interest in this work.
Acknowledgments
This research was supported by the Ministry of Food and Drug Safety for 2010–2013 (grant 10182MFDS991) and by the National Research Foundation of Korea funded by the Korean government (grant 2005–0049412).
Supplementary materials
shows the powder X-ray diffraction patterns for ZnOSM20 and ZnOAE100. Both ZnO nanoparticle samples were determined to have a well crystallized wurtzite structure (JPCDS No 36–1451), which was preserved after coating with either citrate or L-serine. The X-ray diffraction peaks for ZnOAE100 were sharper and had higher intensity compared with ZnOSM20, indicating higher crystallinity in the larger-sized nanoparticles.
The transmission electron microscopy results for pristine ZnO nanoparticles, ie, ZnOSM20 and ZnOAE100, are shown in . All ZnOSM20 and ZnOAE100 particles were determined to have an irregular spherical morphology with an average particle diameter of 26±6 nm and 68±17 nm, respectively, which increased slightly after coating with citrate or L-serine ().
As shown in , the binding energy for the O 1s and Zn 2p3/2 of both ZnOSM20 and ZnOAE100 was observed at around 530 eV and 1,021 eV, respectively, which was in good agreement with previous reports.Citation1,Citation2 The O:Zn atomic ratios for ZnOSM20 and ZnOAE100 were automatically calculated as 57.5:42.5 and 59.3:40.7, respectively, showing an almost 1:1 ratio between Zn and O.
shows the zeta potential for ZnOSM20 and ZnOAE100 with average values of +28.8±0.9 mV and 26.3±0.9 mV, respectively. The zeta potential distribution showed a fairly narrow peak (0 to +50 and +10 to +40 mV for ZnOSM20 and ZnOAE100, respectively).
shows the zeta potential values for the surface-coated ZnO nanoparticles 48 hours after their preparation. These values were fairly comparable with those of the as-prepared coated ZnO samples. Because the zeta potential of the coated ZnO did not change significantly, we could conclude that the colloidal stability of the coated ZnO nanoparticles was not seriously affected by time.
The average value and distribution pattern of zeta potential for the coated ZnO nanoparticles in various types of medium, such as phosphate-buffered saline and Minimum Essential Medium, are shown in . Because the zeta potential apparatus measures the electrophoretic mobility of charged particles, it is strongly affected by the existence of ionic species in the medium, often resulting in errors in the electrodes. Therefore, for correct measurement of surface charge of nanoparticles interacting with electrolytes, we gently removed the excess amount of supernatant after precipitation of the nanoparticles and resuspended it in deionized water before measurement. As shown in , the average zeta potentials for ZnOSM20(−), ZnOSM20(+), ZnOAE100(−), and ZnOAE100(+) at pH 7.0±0.3 were −24±0.4, +18±0.3, −27±1.1, and +20±0.4 mV, respectively, in phosphate-buffered saline, and were −25±0.8, +21±0.2, −23±1.0, and +22±0.6 mV, respectively, at pH 7.0±0.3 in Minimum Essential Medium. The zeta potential values for ZnO nanoparticles in phosphate-buffered saline and Minimum Essential Medium () shifted towards zero compared with those for ZnO nanoparticles in deionized water, suggesting adsorption of the electrolyte having counter-ions on ZnO nanoparticles.
The average hydrodynamic size of the uncoated ZnO nanoparticles was 396±12 nm and 907±16 nm at pH 7.0±0.3 (). The overall hydrodynamic sizes of the ZnOSM20 and ZnOAE100 ranged widely, but their polydispersity indices (0.348 and 0.298, respectively) indicated their relative homogeneity in suspension. Their hydrodynamic sizes were larger than the primary particle sizes obtained by transmission electron microscopy and the crystallite sizes calculated by X-ray diffraction, implying formation of agglomerates.
We checked the solubility of ZnO nanoparticles in an aqueous system, because there has been a report indicating that ZnO is not an appropriate sample for evaluation of nanotoxicity as a result of its high solubility.Citation3 Referring to the paper by Larner and Rehkämper, we utilized the inductively coupled plasma-mass spectrometry technique (SCIEX™; Perkin-Elmer, Downers Grove, IL, USA) to evaluate the solubility of Zn2+ ions from ZnO nanomaterials.Citation3 One gram each of pristine and coated ZnO nanoparticles was dispersed in 100 mL of aqueous solution at pH 7.4. After vigorous stirring for 48 hours, an aliquot was collected, and the supernatant was diluted ten times and subjected to inductively coupled plasma mass spectroscopy in order to evaluate the Zn2+ ions dissolved from the ZnO nanoparticles. The dissolved ZnO compared with the total amount of ZnO in the nanoparticles was calculated in wt% unit. We found that less than 0.22% of Zn2+ was dissolved in neutral pH, suggesting that the solubility was not a serious concern in our coated ZnO samples for the preparation of standardized nanoparticle samples ().
In order to verify that citrate and L-serine stably coated the ZnO nanoparticles, we carried out an elemental analysis (2400 series II CHNS/O System, Perkin-Elmer) on the coated samples before and after washing (Table S2). Because the coating agents were attached on the surface of the ZnO nanoparticles by a combination of coordination bonding, electrostatic interaction, and hydrophobic interaction (between coating agents), some of the coating agent could be detached from the surface on washing. Nevertheless, about half of the coating agent (30%–60% in terms of carbon quantity and 35%–40% in terms of nitrogen quantity) was seen to remain after washing. This result indicates that the coating agents were fairly well coated on the surface of the nanoparticles as a result of stable interaction between the ZnO surface and the coating agents. Although some of the coating agent could be released in the medium, it would not strongly affect the biological assay because agents such as citrate, L-serine, and HEPES are generally recognized to be safe.
Figure S1 Powder X-ray diffraction patterns for pristine ZnO nanoparticles, ie, (a) ZnOSM20 and (b) ZnOAE100.
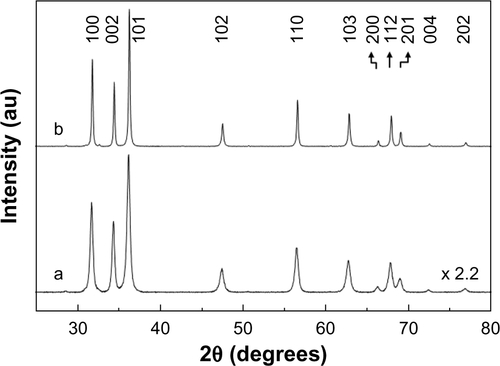
Figure S2 Transmission electron microscopic images of pristine ZnO nanoparticles. (A) ZnOSM20 and (B) ZnOAE100.
Note: 100 nm scale bar.
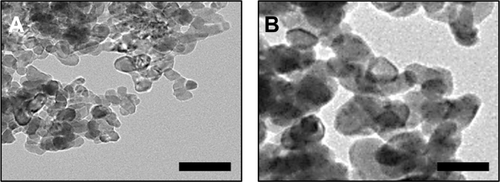
Figure S3 X-ray photoelectron spectra for pristine ZnO nanoparticles. (A) ZnOSM20 and (B) ZnOAE100.
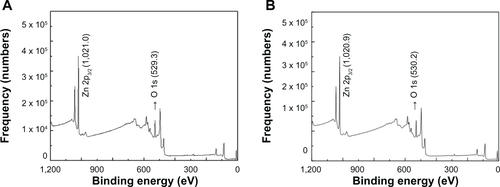
Figure S4 Zeta potential distributions for (A) ZnOSM20 and (B) ZnOAE100 at pH 7.0±0.3 (mean ± standard deviation of n=10).
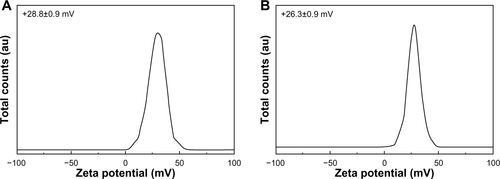
Figure S5 Zeta potential distributions for (A) ZnOSM20(−), (B) ZnOSM20(+), (C) ZnOAE100(−), and (D) ZnOAE100(+) at pH 7.0±0.3 48 hours after coating (mean ± standard deviation of n=10).
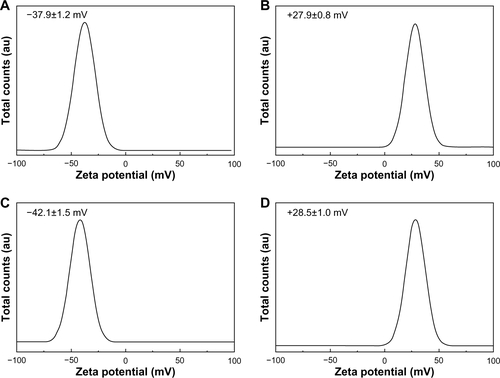
Figure S6 Zeta potential distributions for (a) ZnOSM20(−), (b) ZnOSM20(+), (c) ZnOAE100(−), and (d) ZnOAE100(+) at pH 7.0±0.3 in (A) phosphate-buffered saline and (B) Minimum Essential Medium (mean ± standard deviation of n=10).
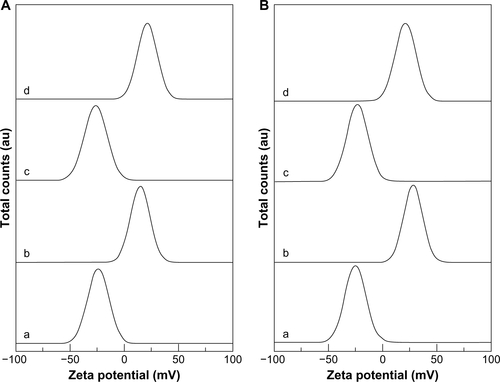
Figure S7 Hydrodynamic size of (A) ZnOSM20 and (B) ZnOAE100 at pH 7.0±0.3 (mean ± standard deviation based on the polydispersity index).
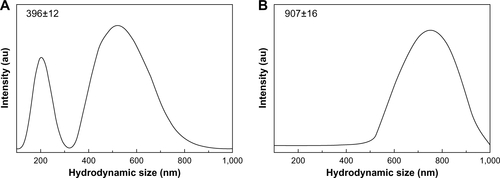
Table S1 Solubility of ZnOSM20, ZnOSM20(−), ZnOSM20(+), ZnOAE100, ZnOAE100(−), and ZnOAE100(+)
Table S2 Elemental analysis for ZnOSM20(−) ZnOSM20(+), ZnOAE100(−), and ZnOAE100(+) before and after washing in deionized water
References
- PesikaNSHuZStebeKJQuenching of growth of ZnO nanoparticles by adsorption of octanethiolJ Phys Chem B200210669856990
- WangZZhangHZhangLLow-temperature synthesis of ZnO nanoparticles by solid-state pyrolytic reactionNanotechnology2003141115
- LarnerFRehkämperMEvaluation of stable isotope tracing for ZnO Nanomaterials – new constraints from high precision isotope analyses and modelingEnviron Sci Technol2012464149415822394426
References
- LeeSPieJEKimYREffects of zinc oxide nanoparticles on gene expression profile in human keratinocytesMol Cell Toxicol20128113118
- KimKMKangJHVinuAInorganic nanomedicines and their labeling for biological imagingCurr Top Med Chem20131348850323432011
- AzamAAhmedASOvesMAntimicrobial activity of metal oxide nanoparticles against Gram-positive and Gram-negative bacteria: a comparative studyInt J Nanomedicine201276003600923233805
- KimHMKimK-MLeeKNano-bio interaction between graphite oxide nanoparticles and human blood componentsEur J Inorg Chem201220123253435349
- Braydich-StolleLKSchaeublinNMHussainSMIn vitro toxicity assessment of metallic nanomaterialsLeszczynskiJerzyPuzynTomaszTowards Efficient Designing of Safe Nanomaterials: Innovative Merge of Computational Approaches and Experimental TechniquesCambridge, UKRSC Publishing2012
- SharifiSBehzadiSLaurentSToxicity of nanomaterialsChem Soc Rev2012412323234322170510
- Rivera GilPOberdörsterGElderACorrelating physico-chemical with toxicological properties of nanoparticles: the present and the futureACS Nano201045527553120973573
- StoneVNowackBBaunANanomaterials for environmental studies: classification, reference material issues, and strategies for physico-chemical characterisationSci Total Environ20104081745175419903569
- Organisation for Economic Cooperation and DevelopmentGuidance notes on sample preparation and dosimetry for the safety testing of manufactured nanomaterialsPresented at the 10th Meeting of the Working Party on Manufactured NanomaterialsParis, FranceJune 27–29, 2012
- ChoiSJOhJMChoyJHSafety aspect of inorganic layered nanoparticles: size-dependency in vitro and in vivoJ Nanosci Nanotechnol200885297530119198442
- VeeranarayananSPouloseACMohamedMSSynthesis and application of luminescent single CdS quantum dot encapsulated silica nanoparticles directed for precision optical bioimagingInt J Nanomedicine201273769378622888233
- ZhangXDWuDShenXSize-dependent in vivo toxicity of PEG-coated gold nanoparticlesInt J Nanomedicine201162071208121976982
- LiangCJosephMMJamesCMLThe role of surface charge on the uptake and biocompatibility of hydroxyapatite nanoparticles with osteoblast cellsNanotechnology20112210570821289408
- MerhiMDombuCYBrientAStudy of serum interaction with a cationic nanoparticle: implications for in vitro endocytosis, cytotoxicity and genotoxicityInt J Pharm2012423374421801821
- de FreitasERSoaresPRSantos RdePIn vitro biological activities of anionic-Fe2O3 nanoparticles on human melanoma cellsJ Nanosci Nanotechnol200882385239118572653
- BergJMTymoczkoJLStryerLBiochemistry7th edNew York, NY, USAWH Freeman and Company2012
- ZhuXMWangYXLeungKCEnhanced cellular uptake of aminosilane-coated superparamagnetic iron oxide nanoparticles in mammalian cell linesInt J Nanomedicine2012795396422393292
- KimKMKimTHKimHMColloidal behaviors of ZnO nanoparticles in various aqueous mediaToxicol Environ Health Sci20124121131
- SiegbahnKNordlingCFahlmanAESCA; Atomic, Molecular and Solid State Structure Studied by Means of Electron SpectroscopyUppsala, SwedenAlmqvist and Wiksell International1967
- BrundleCREvansCAWilsonSEncyclopedia of Materials Characterization: Surfaces, Interfaces, Thin FilmsHouston, TX, USAGulf Professional Publishing1992
- ShenGBandoYLeeCJSynthesis and evolution of novel hollow zno urchins by a simple thermal evaporation processJ Phys Chem B2005109105781058316852283
- MaensiriSLaokulPPromarakVSynthesis and optical properties of nanocrystalline ZnO powders by a simple method using zinc acetate dihydrate and poly(vinyl pyrrolidone)J Cryst Growth2006289102106
- PesikaNSHuZStebeKJQuenching of growth of ZnO nanoparticles by adsorption of octanethiolJ Phys Chem B200210669856990
- ZhijianWHaimingZLigongZLow-temperature synthesis of ZnO Nanoparticles by solid-state pyrolytic reactionNanotechnology20031411
- ZubavichusYFuchsOWeinhardtLSoft X-ray-induced decomposition of amino acids: an XPS, mass spectrometry, and NEXAFS StudyRadiat Res200416134635815108703
- GeLJingXWangJTrisodium citrate assisted synthesis of ZnOH spheres via a facile precipitation route and their application as gas sensorJ Mater Chem2011211075010754
- LiJChatterjeeKMedekAAcid-base characteristics of bromophenol blue-citrate buffer systems in the amorphous stateJ Pharm Sci20049369771214762908
- KamedaTTeramotoHPhase transition of L-ser monohydrate crystal studied by 13C solid-state NMRMagn Reson Chem20064431832416477688
- MohamedMMAEquilibrium studies, synthesis and characterisation of zwitterionic buffer (HEPES and HEPPS) dimethyltin(IV) complexesMain Group Chemistry200766384
- HongRPanTQianJSynthesis and surface modification of ZnO nanoparticlesChem Eng J20061197181
- JarmeloSRevaICareyPRInfrared and raman spectroscopic characterization of the hydrogen-bonding network in L-serine crystalVib Spectrosc200743395404
- FloateSHosseiniMArshadiMRAn in-situ infrared spectroscopic study of the adsorption of citrate on Au(111) electrodesJ Electroanal Chem20035426774
- KimKMKimHMChoiMHColloidal properties of surface coated colloidal silica nanoparticles in aqueous and physiological solutionsSci Adv Mater20146715731581
- NaraMToriiHTasumiMCorrelation between the vibrational frequencies of the carboxylate group and the types of its coordination to a metal ion: an ab initio molecular orbital studyJ Phys Chem19961001981219817
- YangJHHanYSParkMNew inorganic-based drug delivery system of indole-3-acetic acid-layered metal hydroxide nanohybrids with controlled release rateChem Mater20071926792685
- MarcuAStanilaARusuDSpectroscopic studies of some copper (II) complexes with amino acidsJ Mol Struct2007834364368
- HofmannASchmielPSteinBControlled formation of gold nanoparticle dimers using multivalent thiol ligandsLangmuir201127151651517522029627
- XiaTKovochichMLiongMComparison of the mechanism of toxicity of zinc oxide and cerium oxide nanoparticles based on dissolution and oxidative stress propertiesACS Nano200822121213419206459
- DhawanASharmaVToxicity assessment of nanomaterials: methods and challengesAnal Bioanal Chem201039858960520652549
- ChoiSJLeeJJeongJToxicity evaluation of inorganic nanoparticles: considerations and challengesMol Cell Toxicol20139205210
- PaekHJLeeYJChungHEModulation of the pharmacokinetics of zinc oxide nanoparticles and their fates in vivoNanoscale20135114161142723912904
- ParkYHBaeHJangYEffect of the size and surface charge of silica nanoparticles on cutaneous toxicityMol Cell Toxicol201396774