 ?Mathematical formulae have been encoded as MathML and are displayed in this HTML version using MathJax in order to improve their display. Uncheck the box to turn MathJax off. This feature requires Javascript. Click on a formula to zoom.
Abstract
The aim of the present work is the presentation of a quantification methodology for the control of the amount of superparamagnetic iron oxide nanoparticles (SPIONs) administered in biological materials by means of the ferromagnetic resonance technique (FMR) applied to studies both in vivo and in vitro. The in vivo study consisted in the analysis of the elimination and biodistribution kinetics of SPIONs after intravenous administration in Wistar rats. The results were corroborated by X-ray fluorescence. For the in vitro study, a quantitative analysis of the concentration of SPIONs bound to the specific AC133 monoclonal antibodies was carried out in order to detect the expression of the antigenic epitopes (CD133) in stem cells from human umbilical cord blood. In both studies FMR has proven to be an efficient technique for the SPIONs quantification per volume unit (in vivo) or per labeled cell (in vitro).
Introduction
Superparamagnetic iron oxide nanoparticles (SPIONs) are known to consist of ferromagnetic single domains with great potential for biological and medical applications.Citation1–Citation3 A considerable number of preliminary studies have been performed to address issues such as toxicity,Citation4–Citation6 kinetics of elimination and biodistribution of the nanoparticles in the different tissues,Citation7–Citation9 biocompatibility,Citation9 cellular labeling,Citation10–Citation12 qualitative visualization of the tissue or the labeled cell,Citation5,Citation13–Citation15 viability and cellular proliferation,Citation5,Citation6,Citation14 differentiation assays,Citation16,Citation17 kinetics of the SPIONs-trapping capability,Citation18 analysis of the qualitative biodistribution,Citation19 efficiency of cellular labeling,Citation6,Citation13,Citation14,Citation16 and qualitative analysis of the iron content,Citation5,Citation20–Citation22 among others.
In biological and medical applications, an important point involved with the utilization of the SPIONs is the iron quantitative analysis. For example, in in vivo studies, it is necessary to determine: i) the quantity of iron that was absorbed or bound to the different tissues after SPIONs administration; ii) the iron absorption or elimination rate; iii) whether the amount of iron administered per volume unit is toxic or not to the tissue or to the cell; iv) and what is the ideal dose to obtain the desired effect in the particular application, among others. In applications of magnetic resonance imaging (MRI), these parameters will allow the contrast effect in the signal intensity to be determined, resulting in a better contrast control due to the presence of SPIONs. In in vitro studies the quantitative analysis of the SPIONs has the following fundamental objectives: i) determination of the relation between the signal intensity and the number of the labeled cells, as well as the signal intensity and the administered SPIONs concentration (taking into account the study of the toxicity of the contrast agent of cellular label); ii) determination of the ideal dose and the ideal time after the SPIONs administration (result of the study of the kinetics and the tissue SPIONs trapping capability) to obtain a good contrast for MRI; iii) determining the quantity of cells that can be detected in vivo or in vitro by MRI; and iv) to verify how the MRI signal intensity is related with the cellular proliferation and migration.
The objective of this work is to present the quantification methodology of SPIONs for the studies in biological materials by means of ferromagnetic resonance (FMR) both in vivo and in vitro. For the in vivo case, FMR was used to monitor the kinetics of ferrofluid elimination and biodistribution after the SPIONs administration, with the results corroborated by X-ray fluorescence (XRF) measurements. In the in vitro study, hematopoietic stem cells from human umbilical cord blood were labeled with SPIONs coupled to a specific AC133 monoclonal antibody in order to monitor the expression of the antigenic CD133 label.
Experimental procedure
Methodology of quantification
The methodology here described is intended to provide a quantitative analysis of iron oxide nanoparticles in biological materials by means of FMR technique. The analysis allows one to have a better control of the SPIONs dose administered in biological materials. Such methodology can be summarized as follows:
Perform an initial qualitative visualization of the studied tissue in order to observe the SPIONs location as well as the conservation of the cells morphology, thus validating the posterior quantification analysis.
In the FMR spectrum, assign the peaks that specifically correspond to SPIONs, since other iron species that do not come from the administered SPIONs can also contribute peaks to the FMR spectrum. This identification is to be performed carefully by measurements of FMR spectra at different temperatures, taking into account the blocking temperature of the nanoparticles. For FMR measurements, room temperature is recommended because at higher temperatures changes that lead to irreversible damages in the samples can happen.
Build the calibration curve for the ferrofluid using different known concentrations which are proportional to the areas under the resonance absorption curves (doubly integrated FMR experimental spectrum) of the SPIONs. This curve will allow an indirect interpolation during the quantification process. The parameters of the FMR data acquisition used to construct the curve as well as the volume of the sample for all the concentrations must be equal.
After confirming the presence of the SPIONs in the tissues (desired target), assigning the SPIONs resonance line, and taking into account the calibration curve, the SPIONs quantification is performed for the different samples as follows:
Carry out FMR measurements of the studied samples, where the parameters used for data acquisition (not necessarily the same of the calibration curve) and the volume of the samples must be equal.
Take a FMR spectrum of a sample with known SPIONs concentration. Then, interpolate the value of the area under the absorption signal in the calibration curve in order to obtain a “factor” to be multiplied by the areas obtained from measured FMR spectra of the samples under study and thus to find the correspondent concentrations (indirect calibration).
This paper is concerned with the application of this method in two cases of quantification (in vivo and in vitro), where we describe the details and indicate the necessary precautions.
Case I: in vivo study
The process of SPIONs quantification in vivo was conducted in the study of the kinetics of elimination in the blood and biodistribution in the liver of the biocompatible ferrofluid constituted by Fe3O4 nanoparticles recovered with dextran, and administered via intravenous in Wistar rats. The FMR results were verified by the use of XRF technique.
Ferrofluid: Contrast agent
The biocompatible ferrofluid used in the in vivo study is an aqueous colloid of Fe3O4 SPIONs (Endorem, Guerbet, France) coated with low-molecular-weight dextran (7–9 kDa);Citation23 the iron oxide crystal is 4.8–5.6 nm, and the hydrodynamic diameter is 80–150 nm. Each milliliter of Endorem contains: 11.2 mg of iron, 5.6–9.1 mg/mL of dextran, 0.25–0.53 mg/mL of citric acid, and 61.3 mg/mL of β-d-manitol (C6H14O6).
Protocol for SPIONs administration
A number of 16 male Wistar rats (90 days old) with average body weight of 420 g was selected. After alimentary starving, the animals were weighed and anesthetized with ketamine chlorohydrate (100 mg/kg) and chlorohydrate of xilazine (10 mg/kg), mixed in the same syringe and injected intra-muscularly. After 20 minutes, a solution of the biocompatible ferrofluid, at the concentration of 15 μmol of Fe/kg of body weight, was slowly injected (about 10 minutes).
Samples of blood were collected during the periods of 5, 15, 30, 45, 60, 90, and 180 min, and the animals were subsequently sacrificed in a CO2 chamber. Samples of liver were collected after each sacrifice. The control was performed with rats that were not injected with the ferrofluid.
The collected samples were then lyophilized in an Edwards equipment, model E3M8-Modulyo, in order to achieve an optimum homogeneity for the subsequent analyses of the kinetics of elimination and biodistribution of the ferrofluid using the techniques of FMR and XRF.
Quantification protocol
Visualization of the SPIONs in the studied tissue
The samples of liver were fixed in Bouin and included in Paraplast® (McCormick Scientific, St. Louis, MO, USA). For the histological analysis, incisions (5 μm thick) were colored with hematoxylin and eosin (HE). For the detection of ferric ions the cuts were submitted to the reaction with Prussian blue (Perls method) and countercolored with a solution of safranine. The analysis and the documentation of the cuts were performed in a light microscope (Axiophot; Carl Zeiss, Oberkochen, Germany).
Identification of the SPIONs in the samples by FMR
In the study of SPIONs elimination and biodistribution, it was necessary to determine the iron entities present in the liver and blood of the rats after the administration of the ferrofluid. The FMR spectra were acquired using lyophilized samples of the liver and blood. In the search for the best FMR signal, the spectra were obtained at different temperatures using a spectrometer operating at X-band. The FMR measurements were performed using an ELEXSYS E580 spectrometer (Bruker BioSpin, São Paulo, Brazil) operating at 9.4 GHz. The samples were placed in a quartz tube which was in turn positioned in the center of a rectangular microwave cavity operating in the TE102 mode. To perform experiments at different temperatures (4, 100, and 298 K) with liver and blood samples, the FMR spectrometer was also equipped with a helium gas flow cryostat (continuous flow cryostat CF935; Oxford Instruments, Abingdon, UK) mounted inside the microwave cavity. The temperature of the sample was controlled with an ITC503 Oxford Instruments temperature control unit and the spectra were collected after the samples reached thermal equilibrium. In order to avoid saturation and distortion of the FMR signal, the following experimental parameters were used: center field 2,500 Gauss; sweep width 4,900 Gauss; modulation amplitude, 3.0 Gauss; modulation frequency, 100 kHz; microwave power 10 mW; conversion time, 81.92 ms; time constant, 20.48 ms.
Calibration curve
The calibration curve shown in was constructed in order to determine the average number of SPIONs per volume unit of the samples being studied. Samples of the ferrofluid (Endorem) were prepared with colloidal suspensions at different concentrations varying from 0.3 to 101 × 1013 SPION/mm3. A 2 μL volume of each sample was inserted into capillary quartz tubes for the acquisition of the FMR spectra as shown in . Each point in the calibration curve was the result of three scans and the plotted value represents the average of these measurements.
Figure 1 FMR (solid line) and XRF (dashed line) calibration curves of the SPIONs related to the area under the resonance line at g = 2.1 and the characteristic FeKa line, respectively. In the inset A) there are seen typical FMR spectra for different concentrations of iron, corresponding to the characteristic line of magnetite contained in the ferrofluid Endorem™. Inset B) shows the characteristic FeKa line of XRF, proportional to the iron concentration in the sample.
Abbreviations: FMR, ferromagnetic resonance; SPIONs, superparamagnetic iron oxide nanoparticles; XRF, X-ray fluorescence.
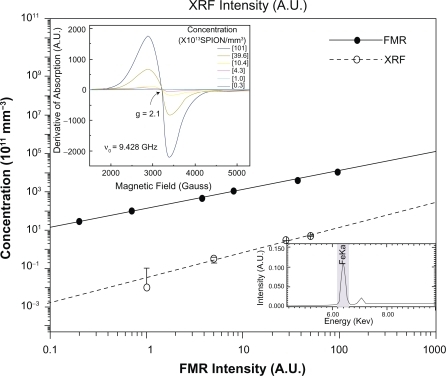
Since the derivative of the absorption curve is measured in an FMR experiment, the intensity of each FMR spectrum is determined from the double integration of the experimental resonance peaks (in our case, the peak at g = 2.1 was assigned to the iron-containing SPIONs). The g-value was obtained from the relation g = (hν/(βH0)) = (2.12 ± 0.02), with ν = 9.428 GHz, where h is the Planck constant, ν is the microwave frequency and β is the Bohr magneton. The intensity of the FMR spectrum at g = 2.1 is proportional to the number of iron particles per mm3 (concentration of SPIONs). The values obtained from the FMR intensities associated with the iron concentrations were plotted and the calibration curve was obtained (solid line in ). The uncertainty in each experimental calibration point was estimated to be in the range 0.3–2.0 × 10¹¹, which thus cannot be seen in the same scale used in .
In order to check the results obtained in vivo by FMR a study was conducted using the technique of XRF and calibration curves were also built for samples of the ferrofluid Endorem as well as the standard samples 1577b and 1548a of the National Institute of Standards and Technology. The XRF powder calibration curve relates the characteristic line of iron (shown in ) versus the concentration of the iron particles exhibited by the dashed line in . The XRF measurements were performed using EDX-980 equipment (Shimadzu, São Paulo, Brazil).
The fraction of iron due to administered SPIONs was obtained from the differences between the XFR iron line in the control sample and the same line in the studied sample thus yielding a real value of the iron content in the organs being studied, and due only to the administered substance. The same procedure was adopted in the FMR studies.
FMR measurements
The FMR spectra were acquired using lyophilized samples of the liver and blood. For the purpose of performing the indirect interpolation was used a volume of 0.1 mL of the ferrofluid (Endorem) of known concentration (5 × 10¹³ particles/mm3).
Case II: in vitro study
The in vitro quantification of SPIONs by means of FMR comprised the labeling of CD133+ stem cells from the blood of human umbilical cord. The SPIONs are coupled to AC133 monoclonal antibody, which recognizes the antigenic epitope CD133. The CD133+ cells from human cord blood could represent a primary step to gain access to a stem pool useful for therapeutic hematopoietic transplants, stem cell expansion for clinical purposes and pre-clinical research on tissue regenerating therapies.
Ferrofluid cellular label
CD133 cells were labeled by using the AC133 monoclonal antibody coupled to the SPIONs – Fe3O4 – (Miltenyi Biotec, Bergisch Gladbach, Germany) with average particle diameter of 9 nm. These nanoparticles were dispersed in a colloidal suspension of a ferrofluid containig 0.1% of gelatine, 0.05% of sodium azide, and an iron content of 200 μg/mL.
Protocol for labeling CD133 cells with SPIONs
Blood from umbilical cord cells were obtained from donor volunteers (n = 5) after written consent (CEP–IEPAE No.105/02). Mononuclear cells were purified by density-gradient centrifugation using Ficoll-Paque™ Plus (GE Healthcare, Chalfont St. Giles, UK).Citation24
After the separation of the mononuclear cells, the CD133+ cell population was purified using anti-CD133 mAb–coupled magnetic beads (Miltenyi Biotec), according to the manufacturer’s instructions. Briefly, to each fraction of 108 cells was added 100 μL of Fc-receptor. After that, the cells were labeled with 100 μL of CD133 microbeads (final volume: 500 μL/108 total cells). The cells were incubated for 30 minutes at 4–8°C; after the incubation, the cells were washed and resuspended in 500 μL of buffer for every 108 cells.
The cells, magnetically labeled with antibodies anti-CD133 microbeads, were separated on a column placed in a magnetic field. In this process, the magnetic-labeled CD133+ cells were retained in the column, whereas the unlabeled CD133− cells passed through. After the removal of the column from the magnetic field, the magnetically retained CD133+ cells could be eluted as the positively selected fraction.
Quantification protocol for the magnetic labeling
The quantification methodology followed the same general steps presented above and are described below for the in vitro case.
Visualization of the SPIONs in the CD133+ cells
After separation, the CD133+ cell population was fixed using 0.5% glutaraldehyde in 0.2 M cacodylate buffer for two hours at 4°C following the routine treatment. The material was then transferred to pure Epon resin and incubated at 60°C for 72 hours, until it was completely polymerized. The ultrathin sections, obtained with the aid of an ultramicrotome, were placed on copper grids and stained with uranyl acetate and lead citrate. The grids were studied and photographed with a transmission electron microscope (PHILIPS CM100; Philips, Amsterdam, The Netherlands).
Calibration curve
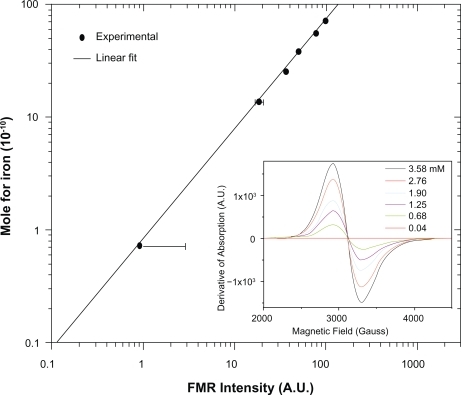
The calibration curve shown in was built using several FMR absorption spectra measured at room temperature (inset of ) and containing samples with different concentrations with the main goal of determining the average number of SPIONs per cell. Samples with the following concentrations of the cellular label were prepared in colloidal suspension: 0.040 ± 0.002; 0.68 ± 0.04; 1.25 ± 0.30; 1.90 ± 0.04; 2.76 ± 0.03; and 3.58 ± 0.02 mM. The uncertainties in the FMR spectral intensity (area under the g = 2.1 absorption curve) varied in the range of a few arbitrary units and hence could not be represented in the calibration curves. The volumes of all samples used to obtain the FMR spectra were 2 μL. Similarly, as done in the in vivo procedure, each measured point was the average value of three scans.
Figure 2 FMR calibration curve of the SPIONs concentration related with the area under the resonance absorption curve at g = 2.1. In the inset there are presented the typical FMR spectra at different concentrations of magnetite contained in the ferrofluid.
Abbreviations: FMR, ferromagnetic resonance; SPIONs, superparamagnetic iron oxide nanoparticles.
FMR measurements of the labeled cells
After labeling, the CD133+ cells were collected in a volume of 2 μL for the acquisition of their FMR absorption spectra. The indirect interpolation was performed using a sample of the ferrofluid of volume 2 μL containing a known concentration (1.4 mM).
Results and discussion
Case I: in vivo study
Visualization of the SPIONs in the studied tissue
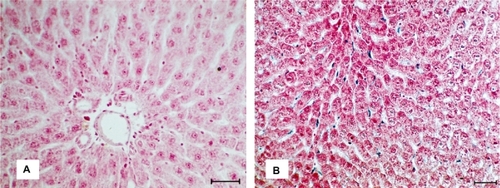
The results of light microscopy clearly showed the conservation of the morphology of the studied organ in the presence of SPIONs. After 15 minutes of iron nanoparticles administration, Prussian blue-stained structures started to appear within the sinusoid capillaries or between hepatocytes rows. Thereafter, the intensity of Prussian blue-staining increased, indicating a greater number of iron nanoparticle inside macrophages (). shows the micrograph of the liver control sample.
Figure 3 A) Micrograph of liver colored by the Prussian blue from tissues of control animals. B) Micrograph of liver after the SPIONs administration, making evident the presence of the nanoparticles in the tissue; bar = 40 μm.
Abbreviation: SPIONs, superparamagnetic iron oxide nanoparticles.
FMR identification of SPIONs
The iron entities in the liver and blood were investigated at temperatures of 4, 100, and 298 K, firstly focusing on the assignment of the resonances due to iron in the FMR spectra. Each one of the assignments of the FMR lines from liver and blood samples was previously identified by Gamarra and colleagues.Citation25 It has been shown that the resonance at g = 2.1 is the total contribution of the administered ferrofluidCitation26–Citation28 internalized in the cells of the phagocytic mononuclear system such as those of the Kupffer liver cellsCitation28 and the Fe+3 ions contained in ferritine.Citation29 Therefore, the iron resonances in contributions of the FMR spectra from the control samples were subtracted from spectra of the liver and blood samples and thus only the SPIONs contributions were obtained.
The FMR analysis at the three temperatures showed that the maximum intensity of the broad line at g = 2.1 due to the SPIONs present in the liver and blood samples was obtained at 298 K, and therefore this temperature was chosen for the present study.
Analysis of the quantification result by FMR
The SPIONs concentrations were determined from the areas under the FMR absorption spectra by interpolation in the calibration curve shown in . The calculation was performed with the FMR data from samples obtained after the time intervals discussed in the protocol and also from the control sample (see and 6 in Gamarra and colleaguesCitation25). The experimental points represent the average values obtained from FMR measurements of three samples for each condition under investigation.
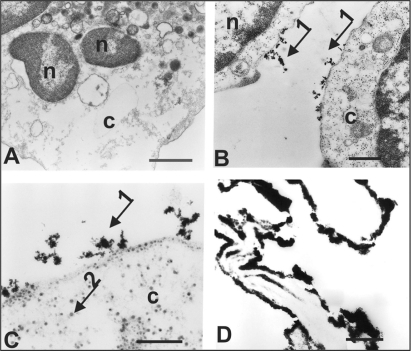
Figure 4 A) TEM of the control stem cells CD133−. B, C) TEM of the CD133+ stem cells labeled with SPIONs. D) TEM of the CD133+ cells of not conserved morphology. n = nucleus, c = cytoplasm, arrow 1 = electrondense granules on the cell surface, arrow 2 = electrondense granules in the cell cytoplasm. Scale: A) 1.0 μm; B, C) 0.25 μm; D) 0.5 μm.
Abbreviations: SPIONs, superparamagnetic iron oxide nanoparticles; TEM, transmission electron microscopy.
In a previous study, Gamarra and colleagues observed the close-to-complete disappearance of SPIONs in the blood (see in Gamarra and colleaguesCitation25), starting within 60 min after the ferrofluid administration. In that work, a first order exponential decay was used for data adjustment. Therefore, nanoparticles concentration C(t) in the blood at a time t is given by
, where
is the nanoparticles concentration at t = 0 and τB is the characteristic time constant of the nanoparticles elimination from the blood, equivalent to the time required to eliminate 63% of the administered nanoparticles concentration. The half life time of the nanoparticles elimination from the blood circulation is given by t1/2=τB.In 2.
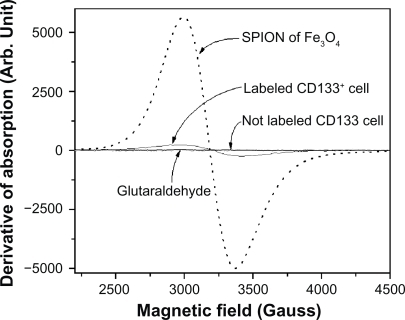
Figure 5 FMR spectra showing the derivative of the absorption of the SPIONs of Fe3O4, labeled cells, not labeled cells, and the 0.5% glutaraldehyde fixator.
Abbreviations: FMR, ferromagnetic resonance; SPIONs, superparamagnetic iron oxide nanoparticles.
In order to corroborate the FMR results for the study of the ferrofluid elimination in the blood, the XRF technique was applied to determine the iron concentration in the blood using the calibration curve () of the characteristic iron lines for different periods of time. The values obtained from the curve fitting using both techniques (FMR and XRF) are shown in .
Table 1 Parameters obtained from the curve adjustments of Figures 5 and 7 of Gamarra and colleagues.Citation25 (FMR and XRF data) for the study of the kinetics of elimination from the blood and biodistribution in the liver. Each parameter of the curves was determined from the average value obtained from the results of the measurements of three samples per experimental point
The study of the biodistribution kinetics of the ferrofluid in the liver using the FMR and XRF techniques was carried out in a similar manner as the study of the sample from the blood. The curves reported by Gamarra and colleagues (see in Gamarra and colleaguesCitation25), obtained from the FMR (continuous line) and XRF (dashed line) suggest that the magnetic nanoparticles are transferred from the blood stream to the liver compartment. It is known that the SPIONs are not only transferred to the liver, but also to other various organs of the rat.Citation30 The time dependence of the nanoparticles concentration in the liver is given by
, where
is the maximum nanoparticle concentration that the liver would be able to accumulate and τL is the characteristic time of the nanoparticles accumulation in the liver.
The FMR and XRF data were adjusted and the equation parameters were calculated and are shown in . Both studies of the SPIONs elimination from the blood and accumulation in the liver indicate that the results obtained from FMR and those obtained from XRF are consistent.
Case II: in vitro study
SPIONs visualization in the labeled cells
The ultra-structural results obtained by TEM analyses clearly showed the presence of electron-dense granules, indicated by arrow 1, on the surface of CD133+ stem cell (), therefore revealing the presence of the AC133 monoclonal antibodies coupled to the SPIONs nanoparticles. This finding excludes the control cell (CD133−) which does not exhibit the label on its surface (see ). The SPIONs were also observed in the cytoplasm of the stem cell CD133+ (), as indicated by arrow 2, suggesting their internalization through the process of endocytosis (pinocytosis).
The previous standardization of this technique has demonstrated a strong electrondense labeling in the periphery of the cellular pellet due to the bad fixation of the material, which explains the reason why the morphology of the cell CD133+ was not conserved ().
Analysis of the result of FMR quantification in the cells
In order to clearly show the expression of the antigenic epitopes (CD133) for the cell of interest, we first obtained only the FMR spectrum of the magnetic beads (), ie, the AC133 monoclonal antibody coupled to the magnetic microspheres composed by SPION (Miltenyi Biotec). We observed the resonance at g = 2.1 attributed to Fe3+ ions which interact among themselves, showing a superparamagnetic behaviorCitation31–Citation33 that characterizes the presence of clusters. This signal consists of a strong absorption, whose broad width is attributed to a strong exchange interaction between sufficiently close Fe ions.
The FMR spectrum of the nonlabeled (CD133−) control cells did not present any trace of resonance (). Thereafter it was obtained the FMR spectrum of the labeled CD133+ cells (0.64 × 10⁵ labeled cells in the volume of 2 μL) showing a resonance line at g = 2.1 () thus indicating the presence of the SPIONs attached to the cells, which were embedded in the 0.5% glutaraldehyde fixator.
To make sure that the nanoparticles were not present in the fixator, this was removed from the labeled cells by centrifugation (1200 rpm for 10 min) and careful aspiration of the supernatant layer. The FMR measurement of the extracted fixator was performed and no signal for the glutaraldehyde was observed, thus indicating the absence of the SPION label in the fixator. This result was confirmed by TEM, being observed that the antibodies coupled to the nanoparticles are attached to the CD133+ cells ().
To determine the average number of iron particles per cell, it was first determined the number of particles of iron contained in the total number of labeled cells CD133+ (0.64 × 10⁵) in a volume of 2 μL. The quantification of the iron particles in the total of labeled cells was determined from the area under the absorption curves of the FMR spectra (Figure 7) and subsequent interpolating in the calibration curve shown in , yielding the value of 1.09 × 10⁻⁸ mole of iron (6.08 × 10⁵ pg) or 4.49 × 10¹¹ Fe3O4 nanoparticles. Consequently, starting from an indirect calculation (taking into account the number of cells contained in 2 μL of sample) it was estimated a number of 1.7 × 10⁻¹³ mol of iron (9.5 pg) or 7.01 × 10⁶ iron nanoparticles per cell.
Conclusions
Superparamagnetic iron oxide nanoparticles have been experiencing a steady increase of their use in biomedical applications, in which cases a detailed characterization of their physicochemical properties, including structural and magnetic properties, is highly desirable. The results presented in this paper are thus part of such an effort. Here we described the methodology for the quantification of SPIONs both in vitro (labeling of stem cells) and in vivo (kinetics of biodistribution in the blood and liver of rats).
One of the fundamental steps in starting the quantitative analysis in both studies is the procedure of qualitatively visualizing the studied samples in order to determine the SPIONs location as well as the conservation of the cells morphology, which will validate the posterior quantification analysis.
Several biological samples contain paramagnetic substances that appear in the FMR spectra, and which do not correspond to the SPIONs. Therefore, it is necessary to identify the resonance lines exclusively due to the SPIONs. In order to assure the correct assignment, it is important to proceed with the subtraction of the resonance spectrum of the sample containing the SPIONs from the spectrum of the control sample.
After that, the SPIONs concentration is determined from the area under the doubly-integrated FMR spectra, whose values are interpolated in an adequate calibration curves. The SPIONs quantification process by FMR for both in vivo and in vitro studies was shown to be a reliable method, enabling us to estimate either the SPIONs content per volume or per cell. These values will be useful for the determination of the administered concentrations of the label and to improve the detection ability of other techniques such as the MRI.
Acknowledgements
This work was financed by Instituto Israelita de Ensino e Pesquisa Albert Einstein (IIEPAE), and CNPq. AJCF also thanks the Brazilian agency FAPESP. The authors report no conflicts of interest in this work.
References
- McNeilSENanotechnology for the biologistJ Leukoc Biol20057858559415923216
- NeubergerTSchöpfBHofmannHHofmannMvon RechenbergBSuperparamagnetic nanoparticles for biomedical applications: Possibilities and limitations of a new drug delivery systemJ Magn Magn Mater2005293483496
- PankhurstQAConnollyJJonesSKDobsonJApplications of magnetic nanoparticles in biomedicineJ Phys D Appl Phys200336R167R181
- OberdörsterGOberdörsterEOberdörsterJNanotoxicology: an emerging discipline evolving from studies of ultrafine particlesEnviron Health Perspec2005113823839
- FrankJAMillerBRArbabASClinically applicable labeling of mammalian stem cells by combining superparamagnetic iron oxides and transfection agentsRadiology200322848048712819345
- ZhangZvan de BosEJWielopolskiPAJong-PopijusMDunckerDJKrestinGPHigh-resolution magnetic resonance imaging of iron-labeled myoblasts using a standard 1.5-T clinical scannerMAGMA20041720120915517471
- LacavaLMLacavaZGMDa SilvaMFMagnetic resonance of a dextran-coated magnetic fluid intravenously administered in miceBiophys J2001802483248611325747
- LaçavaLMLaçavaZGMAzevedoRBUse of magnetic resonance to study biodistribution of dextran-coated magnetic fluid intravenously administered in miceJ Magn Magn Mater2002252367369
- JainTKReddyMKMoralesMALeslie-PeleckyDLLabhasetwarVBiodistribution, clearance, and biocompatibility of iron oxide magnetic nanoparticles in ratsMol Pharm2008531632718217714
- BulteJWBrooksRAMoskowitzBMBryantLHJFrankJARelaxometry and magnetometry of the MR contrast agent MION-46LMagn Reson Med19994237938410440963
- BulteJWDouglasTWitwerBMagnetodendrimers allow endosomal magnetic labeling and in vivo tracking of stem cellsNat Biotechnol2002191141114711731783
- JendelováPHerynekVDe CroosJImaging the fate of implanted bone marrow stromal cells labeled with superparamagnetic nanoparticlesMagn Res Med200350767776
- AliSAGeneTYHeatherKEfficient magnetic cell labeling with protamine sulfate complexed to ferumoxides for cellular MRIBlood20041041217122315100158
- HeGZhangHWeiHIn vivo imaging of bone marrow mesenchymal stem cells transplanted into myocardium using magnetic resonance imaging: A novel method to trace the transplanted cellsInt J Cardiol200711441016759718
- WilhelmCGazeauFBacriJCMagnetophoresis and ferromagnetic resonance of magnetically labeled cellsEur Biophys200231118125
- HindsKAHillJMShapiroEMHighly efficient endosomal labeling of progenitor and stem cells with large magnetic particles allows magnetic resonance imaging of single cellsBlood200310286787212676779
- HillJMDickAJRamanVKSerial cardiac magnetic resonance imaging of injected mesenchymal stem cellsCirculation2003261009101412912822
- RivièreChBoudghèneFPGazeauFIron oxide nanoparticle-labeled rat smooth muscle cells: cardiac MR imaging for cell graft monitoring and quantitationRadiology200523595996715845788
- WeisslederRBogdanovANeuweltbEAPapisovMLong-circulating iron oxides for MR imagingAdv Drug Deliv Rev199516321334
- JendelováPHerynekVUrdzíkováLMagnetic resonance tracking of transplanted bone marrow and embryonic stem cells labeled by iron oxide nanoparticles in rat brain and spinal cordJ Neurosci Res20047623224315048921
- ArbabASBashawLAMillerBRCharacterization of biophysical and metabolic properties of cells labeled with superparamagnetic iron oxide nanoparticles and transfection agent for cellular MR imagingRadiology200322983884614657318
- BilloteyCWilhelmCDevaudMBacriJCBittounJGazeauFCell internalization of anionic maghemite nanoparticles: quantitative effect on magnetic resonance imagingMagn Reson Med20034964665412652535
- LaniadoMChachuatAVerträglichkeitsprofil von ENDOREMRadiologe199535Suppl. eS266S2708588033
- LehnerMHolterWEndotoxin-free purification of monocytes for dendritic cell generation via discontinuous density gradient centrifugation based on diluted Ficoll-Paque Plus®Int Arch Allergy Immunol2002128737612037404
- GamarraLFPontuschkaWMAmaroEJrKinetics of elimination and distribution in blood and liver of biocompatible ferrofluids based on Fe3O4 nanoparticles: An EPR and XRF studyMater Sci Eng C200828519525
- LacavaLMLacavaZGMda SilvaMFMagnetic resonance of a dextran-coated magnetic fluid intravenously administered in miceBiophys J2001802483248611325747
- SharmaVKWaldnerFSuperparamagnetic and ferrimagnetic resonance of ultrafine Fe3O4 particles in ferrofluidsJ Appl Phys19974842984302
- LacavaLMGarciaVAPKückelhausSMagnetic resonance and light microscopy investigation of a dextran coated magnetic fluidJ Appl Phys20039375637565
- Slawska-WaniewskaAMosiniewicz-SzablewskaENedelkoNGalazka-FriedmanJFriedmanAMagnetic studies of iron-entities in human tissuesJ Magn Magn Mater200427224172419
- WeisslederRBogdanovANeuweltbEAPapisovMLong-circulating iron oxides for MR imagingAdv Drug Deliv Rev199516321334
- GamarraLFBritoGESPontuschkaWMAmaroEJrParmaAHCGoyaGFBiocompatible superparamagnetic iron oxide nanoparticles used for contrast agents: a structural and magnetic studyJ Magn Magn Mater2005289439441
- HseihCTHuangWLLueJTThe change from paramagnetic resonance to ferromagnetic resonance for iron nanoparticles made by the sol-gel methodJ Phys Chem Sol200263733741
- SharmaVKWaldnerFSuperparamagnetic and ferrimagnetic resonance of ultrafine Fe3O4 particles in ferrofluidsJ Appl Phys19974842984302