
 ?Mathematical formulae have been encoded as MathML and are displayed in this HTML version using MathJax in order to improve their display. Uncheck the box to turn MathJax off. This feature requires Javascript. Click on a formula to zoom.
Abstract
A robust and versatile signal-on fluorescence sensing strategy was developed to provide label-free detection of various target analytes. The strategy used SYBR Green I dye and graphene oxide as signal reporter and signal-to-background ratio enhancer, respectively. Multidrug resistance protein 1 (MDR1) gene and mercury ion (Hg2+) were selected as target analytes to investigate the generality of the method. The linear relationship and specificity of the detections showed that the sensitive and selective analyses of target analytes could be achieved by the proposed strategy with low detection limits of 0.5 and 2.2 nM for MDR1 gene and Hg2+, respectively. Moreover, the strategy was used to detect real samples. Analytical results of MDR1 gene in the serum indicated that the developed method is a promising alternative approach for real applications in complex systems. Furthermore, the recovery of the proposed method for Hg2+ detection was acceptable. Thus, the developed label-free signal-on fluorescence sensing strategy exhibited excellent universality, sensitivity, and handling convenience.
Introduction
Fluorescence is a common analytical method facilitated by modern testing requirements and developments; it exhibits simple operation, time efficiency, sensitivity, selectivity, and potential for high-throughput bioanalysis.Citation1–Citation4 Several fluorescent techniques have been developed to detect various target analytes. Fluorescent sensors based on fluorescence dyes, such as fluorescein isothiocyanate and FAM labels, have been a general routine for biological applications, especially imaging and assays.Citation5,Citation6 Semiconductor quantum dots and metal clusters with adjustable emission wavelengths have also been used for DNA and protein detection.Citation5–Citation9 Unfortunately, most of the reported biosensors often require label modifications, which increases difficulty in detection, operation costs, and experimentation time.Citation9 The development of robust, label-free, and sensitive methods for sensing target molecules through fluorescence is desiderated.Citation2,Citation7,Citation10 SYBR Green I (SGI) can be used as a probe to fabricate label-free fluorescent sensors.Citation2,Citation10,Citation11 SGI preferentially binds to double-stranded DNA (dsDNA), but stains single-stranded DNA (ssDNA) with weak performance. The resultant dsDNA-SGI complex emits green light at λmax=520 nm, which is much higher than the ssDNA SGI system. Thus, SGI is widely used to develop label-free fluorescent sensors for biomolecular detection (eg, real-time quantitative reverse transcription polymerase chain reaction). However, because of the intrinsic signal of SGI in the absence of the target, the signal-to-background ratio of fluorescent sensors remains insufficiently high to make the analytical performance high enough. Thus, there is an urgent demand for developing universal fluorescent sensors based on SGI with improved sensitivity and specificity.Citation10,Citation12
Graphene oxide (GO) is a 2D nanomaterial commonly used as an ideal amplification platform for biosensors because of its enhanced electronic properties, good biocompatibilities, and large surface area.Citation12–Citation15 In addition, GO interacts with ssDNA by π–π stacking interactions between nucleotide bases and GO; however, this material rarely interacts with rigid dsDNA or aptamer target complexes.Citation15–Citation17 Thus, the fluorescence of dye-labeled ssDNA will be completely quenched through fluorescence resonance energy transfer upon binding to GO surface. Therefore, GO is an excellent signal-to-background ratio enhancer to improve the performance of fluorescent methods based on its features.Citation18 Free SGI in the solution is also adsorbed on the GO surface because of the absorptivity of GO, thereby eliminating the SGI-generated blank fluorescence. In contrast to traditional fluorescent methods based on direct applications of SGI,Citation10 the use of GO as a quenching platform amplifies the signal-to-background ratio to improve the performance of SGI-based label-free fluorescent sensors and is a great attraction.
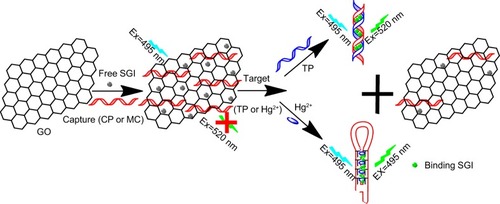
Multidrug resistance protein 1 (MDR1) gene is associated with the primary drug resistances of tumors. High expression levels of MDR1 indicate that tumor cells have low sensitivity to chemotherapy. Detection of MDR1 gene probes the sensitivity and tolerance of tumors to chemotherapy drugs and predicts the curative effect of chemotherapy by prognosis evaluation.Citation19 Clinical methods, such as fluorescence in situ hybridizationCitation20 and real-time quantitative reverse transcription polymerase chain reactionCitation21 have been used to diagnose MDR1. However, some limitations in the reported methods include complicated, expensive, and time-consuming operations. Thus, a facile and effective method should be developed to detect MDR1 gene. In this study, a robust and versatile signal-on fluorescent strategy was fabricated to detect MDR1 gene using SGI dye and GO as signal reporter and signal-to-background ratio enhancer, respectively. The strategy relied on the switching fluorescence of SGI because of the selective insertion of dsDNA and release of DNA complex from GO to stimulate signals (). Initially, SGI dyes and DNA capture probes (CPs) were adsorbed on GO surface via hydrophobic and π–π interactions; GO quenched SGI fluorescence to a low level. In the presence of target sequences, the competitive hybridization of the sequences with DNA CPs transform ssDNA into a DNA duplex structure. Free SGI intercalates with a section of dsDNA to facilitate release from GO surface. The fluorescence intensity of SGI is markedly enhanced in contrast to the low background signal. Thus, quantitative analysis of MDR1 gene can be performed by using GO as a signal-to-background ratio enhancer and SGI as a signal reporter. Furthermore, a similar procedure based on the formation of hairpin probes from the CP was developed through T–Hg–T reaction to mercury ion (Hg2+), a serious environmental pollutant, to verify method versatility. This strategy is useful for straightforward, sensitive, and economical detection of diverse specific targets because of its generality and practical maneuverability.
Figure 1 Representation of the signal-on fluorescence sensing strategy for MDR1 gene and Hg2+ based on SGI dye and GO.
Abbreviations: MDR1, multidrug resistance protein 1; Hg2+, mercury ion; SGI, SYBR Green I; GO, graphene oxide; CP, capture probe; TP, target probe; MC, mercury captures.
Experimental section
Materials and reagents
All the oligonucleotides used in this work were synthesized and purified by TaKaRa Biotechnology (Dalian) Co., Ltd., People’s Republic of China. Their sequences are as follows:
the oligonucleotides for MDR1 detection:
CP: 5′-CCG GAA ACA TCC AGC ATA GG-3′
Target probe (TP): 5′-CCT ATG CTG GAT GTT TCC GG-3′
One-based mismatch DNA (named as NDR2): 5′-CCT ATG CTT GAT GTT TCC GG-3′
One-based mismatch DNA (named as NDR2): 5′-CAT ATG CTT GAT ATT TCC GG-3′
Non-complementary DNA (Non): 5′-AT AgT gAT AAC gCT AgC TgCA-3′
the CP for Hg2+ detection (mercury captures [MC]):
5′-CATTCTTTCTTCCCCTTGTTTGTTTG-3′
SGI (10,000×) was purchased from Beijing Dingguo Biotechnology Co., Ltd. (Beijing, People’s Republic of China). The received SGI was diluted to 500× with dimethyl sulfoxide to make SGI stock solution, whose concentration was 19.8 μM.Citation10 Mercuric chloride (HgCl2), NiCl2·6H2O, BaCl2, CrCl3, PbAc2, MnAc2, CoAc2 were all provided by Aladdin Reagents Co., Ltd (Shanghai, People’s Republic of China). Graphite flake (325 mesh) was purchased from Nanjing XFNANO Materials Tech Co., Ltd (Nanjing, People’s Republic of China). All reagents were of analytical grade and the water used throughout all experiments was purified through a Millipore system (Merck Millipore, Billerica, MA, USA). Binding buffer used for T-Hg-T reaction in Hg2+ detection and hybridization buffer used for MDR1 detection are phosphate buffered saline consisting of 10 mM Na2HPO4, 10 mM NaH2PO4, 0.2 M NaCl (pH=7.4).
Assay procedures
GO was synthesized from graphite flake by an improved Hummers method.Citation22 The CPs (CP 50 nM or MC 80 nM) were mixed with GO (2 μg/mL) and 8 μL SGI stock solution to a total volume of 200 μL. Then, the mixture was placed at room temperature 10 minutes. Following that, various amounts of target analytes (TP or Hg2+) were added and incubated for 1 hour at specific temperatures (40°C for MDR1 and 27°C for T-Hg-T reaction). Immediately, fluorescence measurements were performed.
Apparatus and measurement
All the fluorescence measurement in this paper was performed by a Cary Elipse Fluorescence Spectrophotometer (Agilent Technologies, Santa Clara, CA, USA). The sample cell was a 350 μL quartz cuvette. The excitation wavelength and emission wavelength were 495 nm and 520 nm respectively. Both the excitation and emission slits were set at 5 nm. Atomic force microscopy (AFM) images were obtained on a Bruker Multimode 8 SPM (Bruker Corporation, Billerica, MA, USA) system in tapping mode.
Results and discussion
Optimization of sensing conditions
Effectiveness of GO content
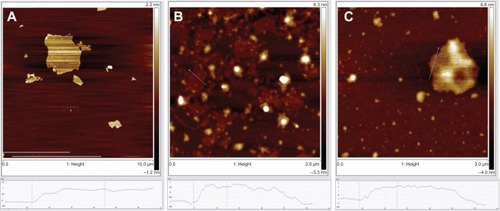
To confirm the quenching effectiveness of GO and improve the signal-to-background ratio, SGI quenching for the MDR1 detection system was tested to analyze the optimization of GO conditions. reveals that the fluorescence intensity significantly decreased with increased GO concentration, and was almost quenched when the GO concentration was 2 μg/mL. The adsorption of GO for SGI and ssDNA was proved by using AFM, as shown in . shows that the thickness of GO is about 1.2 nm. illustrates that the thickness of GO-SGI complex is about 2.0 nm, the thicker height might be due to the adsorbed SGI on the surface of GO. With the DNA adsorption on the surface of GO, illustrates that the increased thickness is about 2.8 nm, which is in accord with the reported work.Citation15
Figure 2 Influence of different concentrations of GO on fluorescence intensity without target analytes.
Notes: Inset shows the relationship of GO and fluorescence intensity. The concentrations of SGI and CP in the test were 0.79 μM and 50 nM, respectively. Error bars were the standard deviation of the three replicate determinations.
Abbreviations: GO, graphene oxide; SGI, SYBR Green I; CP, capture probe; FL, fluorescence; au, arbitrary units.
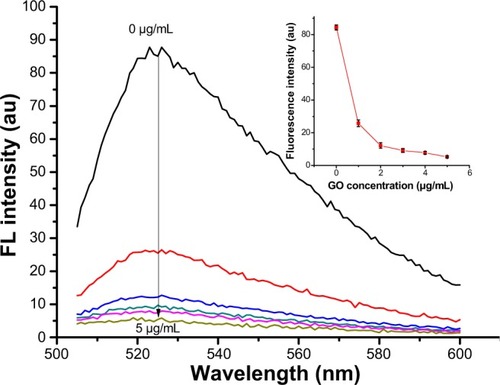
Figure 3 AFM height images of (A) GO sheets, (B) GO and SGI complex, and (C) GO and ssDNA complex on mica substrates.
Abbreviations: GO, graphene oxide; SGI, SYBR Green I; AFM, atomic force microscopy; ssDNA, single-stranded DNA.
The effectiveness of GO concentration to the enhancement of signal-to-background ratio for the detection system was further investigated. The effects of GO concentration on the detected fluorescence in the presence and absence of target MDR1 sequences were compared in a 50 nM CP system. The signals gradually decreased with increased GO concentration ( in Supplementary Materials). With F0 and F as the respective fluorescence intensities of SGI at 520 nm in the absence and presence of target MDR1 sequences, F/F0 increased with GO concentration (). A slow growth amplitude occurred for GO concentrations greater than 2 μg/mL, in which F/F0=8.2 was high enough to sensitively quantify the target. The continuous increase in F/F0 for GO concentrations higher than 2 μg/mL was mainly attributed to a sufficiently low F0. The corresponding values of ΔF = F – F0 were also compared. indicates that ΔF was almost kept constant with increased GO concentration from 0 μg/mL to 2 μg/mL. ΔF values for GO concentrations higher than 2 μg/mL were much lower than those for GO concentrations from 0 μg/mL to 2 μg/mL. Given the results of ΔF and F/F0, the GO concentration was selected to be 2 μg/mL for analytical applications.
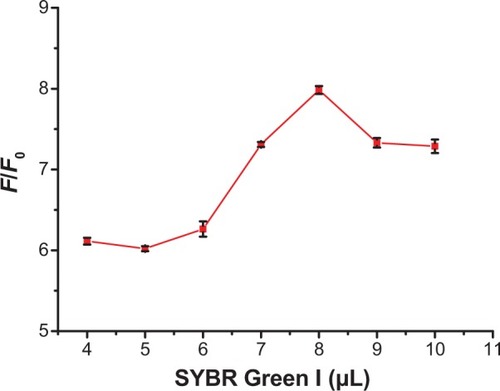
Effectiveness of SGI concentration
Optimization of SGI concentration in the detection system was investigated. A 200 μL MDR1 gene detection system was used to analyze the changes in F/F0 for different SGI concentrations. reveals that F/F0 continuously increases until the volume of SGI stock solution reaches 8 μL, and slightly decreases thereafter. Thus, the optimum SGI volume was selected to be 8 μL for 200 μL detection systems. The SGI volume corresponds to an SGI concentration of 0.79 μM in 200 μL, which optimizes the increase in F/F0.
Figure 4 Effects of various volumes of SYBR Green I on F/F0 in the absence and presence of 10 nM target DNA.
Notes: The concentration of graphene oxide was 2.0 μg/mL. Error bars represent standard deviations of measurements (n=3).
Effectiveness of assay time
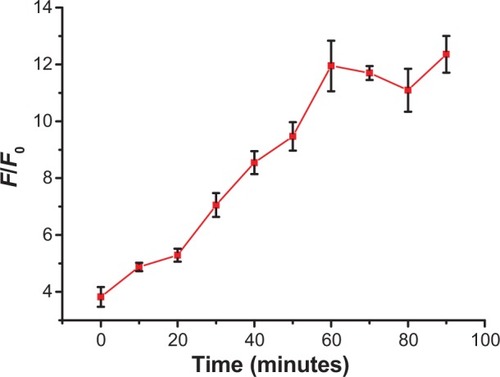
To determine the assay time, the monitoring of the F/F0 as a function of time was studied. SGI quenching for the Hg2+ detection system was tested to analyze the optimization of assay time. shows the gradually increased F/F0 due to the increased time. The binding of ssDNA probe and target caused the gradual desorption of probe from the surface of GO. Combined with the embedding of SGI, the fluorescence gradually increased. From the result of the monitoring of the time dependent fluorescence changes, it illustrated that 60 minutes was the most appropriate reaction time for the reaction. Thus, an incubation time of 1 hour was adopted for the assay time.
Figure 5 Effects of reaction time of SYBR Green I SGI on F/F0 in the absence and presence of 1.2 μM Hg2+ in the test conditions of 8 μL SGI, 80 nM MC, and 2 μg/mL graphene oxide.
Note: Error bars represent standard deviations of measurements (n=3).
Abbreviations: Hg2+, mercury ion; MC, mercury captures; SGI, SYBR Green I.
Sensing performance of MDR1 gene and Hg2+
To confirm the performance of the detection capability of the proposed fluorescence sensing strategy, two different systems of MDR1 gene (TP) and Hg2+ were applied. shows that the fluorescence intensities increase with TP or Hg2+ concentration. Addition of TP or Hg2+ induced a turn-on fluorescence of SGI. For the TP system, F – F0 increased with the TP concentration increased in the range of 0 nM to 1,000 nM. Furthermore, a good linear relationship between F – F0 and TP concentration was illustrated in the range of 0 nM to 50 nM (). This result suggested that quantitative assays for TP concentrations could be obtained. The calibration plot of linear equation is given as:
Figure 6 Fluorescence spectra (A, C) and the changeable fluorescence intensities (B, D) towards different concentrations of MDR1 gene (A, B) and Hg2+ (C, D).
Notes: (A) Fluorescence spectra of 8 μL SGI, 50 nM CP, and 2 μg/mL GO upon addition of various concentrations of MDR1 gene. (B) Values of ΔF = F – F0 for different concentrations of MDR1 gene. Inset: calibration plot of F – F0 against the concentration of target MDR1 gene from 0 nM to 50 nM. (C) Fluorescence spectra of 8 μL SGI, 80 nM MC, and 2 μg/mL GO upon the addition of various concentrations of Hg2+. (D) Calibration plot of F – F0 against the concentration of target Hg2+ from 0 nM to 2,000 nM. Error bars represent standard deviations of measurements (n=3).
Abbreviations: FL, fluorescence; au, arbitrary units; SGI, SYBR Green I; CP, capture probe; GO, graphene oxide; MDR1, multidrug resistance protein 1; Hg2+, mercury ion; MC, mercury captures.
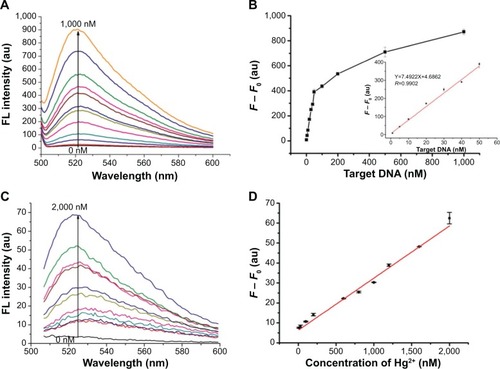
The limit of detection (LOD) was found to be 0.5 nM based on 3σ/slope, where σ is the standard deviation of the blank sample. The LOD was much lower than the reported DNA sensor (LOD=2.3 nM) based on single-walled carbon nano-tubes as the quencher platform.Citation23 Furthermore, the label-free features of the gene assay indicated its high convenience and cost efficiency. To verify the universal applicability of the proposed sensing strategy, Hg2+ was also monitored using the same approach. reveals that the fluorescence intensity gradually increases with Hg2+ concentration from 0 nM to 2,000 nM. F – F0 and Hg2+ concentration exhibited a linear relationship (). The linear equation is given as:
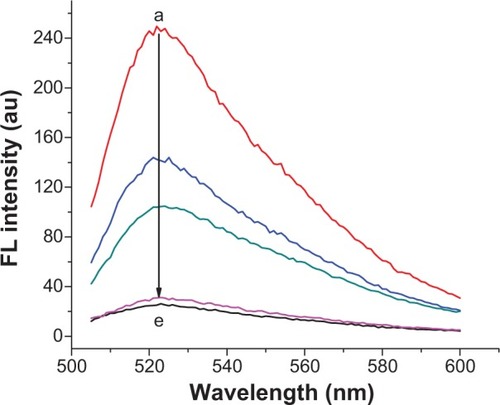
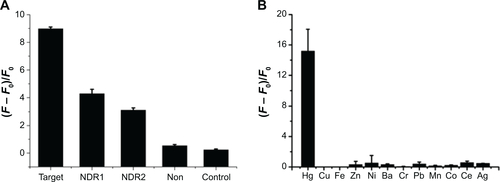
The specificity of the sensing strategy relied on the high selectivity of the chosen gene sequence. To assess the potential interference by other conditions, the specificities of the proposed method for MDR1 gene and Hg2+ were investigated through mutant genes and other metal ions. One-mismatch, three-mismatch, non-complementary DNA and control blank were selected to analyze the specificity of MDR1 gene ( and ). The results indicated that only MDR1 gene markedly changed the fluorescence. In contrast to complementary sequences, one-mismatch sequence of MDR1 gene merely triggered half of the changes in fluorescence intensity. For Hg2+ selectivity, the method could be applied to test other 2,000 nM metal ions, such as Cu2+, Fe2+, Ni2+, Ba2+, Cr3+, Pb2+, Mn2+, Co2+, Ce2+, and Ag+ compared with 2,000 nM Hg2+ (). Other metal ions yielded negligible effects in contrast to Hg2+, which possessed a high fluorescence intensity. These results suggested that no interference emanated from other metal ions in the sensing system for Hg2+ detection. The highly selective result for Hg2+ was attributed to the specific actions between Hg2+ and T to form T–Hg–T complexes. Overall, the selective results for MDR1 gene and Hg2+ confirmed the high specificity of signal-on fluorescence sensing.
Figure 7 Fluorescence spectra from “a” to “e” for the addition of 20 nM target, one-based mismatch, three-based mismatch, non-complementary MDR1 gene and without any target in the test conditions of 8 μL SGI, 50 nM CP, and 2 μg/mL GO.
Abbreviations: FL, fluorescence; au, arbitrary units; MDR1, multidrug resistance protein 1; SGI, SYBR Green I; CP, capture probe; GO, graphene oxide.
Real applications of the proposed method
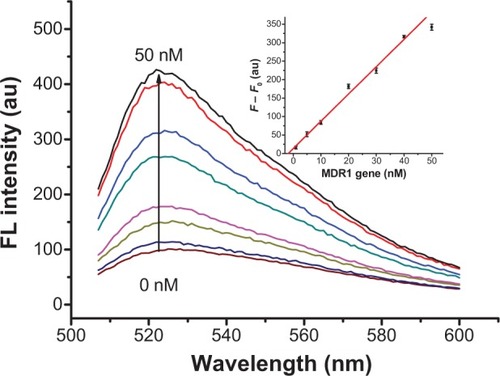
The feasibility of the proposed assay to real samples was evaluated by analyzing the MDR1 gene in 10% serum solution and testing the recovery of Hg2+ in actual water samples. The sensor was tested with known concentrations of MDR1 gene spiked in 10% serum for fluorescence detection. shows the fluorescence spectra of the proposed sensor in the presence of various concentrations of MDR1 gene in the serum. The fluorescence intensity at 520 nm gradually increased with the concentration of MDR1 gene. As shown in inset of , the calibration curve of the fluorescence intensity against the concentration of MDR1 gene was found to be:
Figure 8 Fluorescence spectra and calibration plot (inset) for 8 μL SGI, 50 nM CP, and 2 μg/mL GO toward various concentrations of MDR1 gene from 0 nM to 50 nM in 10% serum.
Note: Error bars represent standard deviations of measurements (n=3).
Abbreviations: FL, fluorescence; au, arbitrary units; MDR1, multidrug resistance protein 1; SGI, SYBR Green I; CP, capture probe; GO, graphene oxide.
For the actual Hg2+ detection system, two water samples were collected from Minjiang River and one sample was obtained from tap water in our laboratory. Then, the samples were analyzed with the proposed sensing system using standard addition methods. Prior to the addition of 60 nM Hg2+, the fluorescence signals of the water samples were tested. The spiked samples with 60 nM Hg2+ were then added to three actual water samples to test the fluorescence signals through the proposed method. Fluorescence intensities before and after Hg2+ spiking were used to calculate the recovered Hg2+ concentrations according to the calibration equation (). The analytical results () suggested that the recovery and precision of the proposed assay to detect Hg2+ in actual water samples were acceptable and satisfactory. The detection performance toward MDR1 gene and Hg2+ based on the sensing system was robust in complex matrices for distinct targets because of short testing times and simplicity in operation.
Table 1 Results for determination of Hg2+ in actual water samples and recoveries of the test of Hg2+
Conclusion
A robust and universal fluorescence sensing strategy was proposed to detect genes and metal ions. The principle of the assay relied on target-based turn-on fluorescence of SGI, which induced the formation of dsDNA or DNA with hairpin structures. GO was used as a platform to amplify the signal-to-background ratio and improve the sensitivity of the proposed assay. Under optimized conditions, the assay was successfully accomplished with low LODs of 0.5 and 2.2 nM for quantitative detections of MDR1 gene and Hg2+, respectively. Furthermore, the strategy revealed the advantages in selectivity and actual applications toward the detection of MDR1 gene and Hg2+. The detection protocol of the method exhibited simplicity of operation and cost efficiency. Finally, considering the further improvement, the sensing strategy can be extended into signal-on and signal-off types and applied to detect other important targets, such as proteins and small molecules, given the special design of the corresponding ssDNA or aptamer.
Acknowledgments
This work is supported by grants from the National High Technology and Development of China (863 Project: 2012AA022604), the National Natural Science Foundation of China (21275028), the Major Program of Medical and Health Foundation of Nanjing Military Region (12Z39), and the project to cultivate young talents in Fujian Province health system (2013–ZQN–JC–16).
Supplementary materials
Figure S1 Influence of different concentrations of GO on (A) the changeable fluorescence intensity with the absence (a) and presence (b) of 10 nM Target DNA, (B) the ratio of the fluorescence intensities, and (C) the difference of SGI at 520 nm in the absence and presence of 10 nM target DNA.
Notes: The concentration of SGI in the test was 0.79 μM. Error bars were the standard deviation of the three replicate determinations.
Abbreviations: GO, graphene oxide; au, arbitrary units; SGI, SYBR Green I; FL, fluorescence.
Figure S2 (A) Fluorescence intensities for 8 μL SGI, 50 nM CP, and 2 μg/mL GO upon addition of 20 nM target, one-based mismatch, three-based mismatch, non-complementary MDR1 gene, and without any target. (B) Selectivity evaluation of 8 μL SGI, 80 nM MC, and 2 μg/mL GO toward 2,000 nM Hg2+ and other ions.
Abbreviations: MDR1, multidrug resistance protein 1; SGI, SYBR Green I; CP, capture probe; GO, graphene oxide; Hg2+, mercury ion; MC, mercury captures; NDR, non multidrug resistance protein.
Disclosure
The authors have no conflicts of interest to disclose.
References
- WorkmanJJrKochMVeltkampDProcess Analytical ChemistryAnal Chem200577123789380615952757
- LiJHuangYWangDFA power-free microfluidic chip for SNP genotyping using graphene oxide and a DNA intercalating dyeChem Commun (Camb)201349303125312723471134
- AndersenCMMortesenGFluorescence Spectroscopy: A Rapid Tool for Analyzing Dairy ProductsJ Agric Food Chem200856372072918173241
- ChenGWSongFLXiongXQPengXJFluorescent Nanosensors Based on Fluorescence Resonance Energy Transfer (FRET)Ind Eng Chem Res201352331122811245
- GonçalvesMSFluorescent Labeling of Biomolecules with Organic ProbesChem Rev2009109119021219105748
- ZhangYZhangBLiuFLuoJWBaiJIn vivo tomographic imaging with fluorescence and MRI using tumor-targeted dual-labeled nanoparticlesInt J Nanomedicine201491334124368885
- QingZHHeXXQingTPPoly(Thymine)-Templated Fluorescent Copper Nanoparticles for Ultrasensitive Label-Free Nuclease Assay and Its Inhibitors ScreeningAnal Chem20138524121381214324236868
- ZhangCYYehHCKurokiMTWangTHSingle-quantum-dot-based DNA nanosensorNat Mater200541182683116379073
- QianZSShanXYChaiLJMaJJChenJRFengHA universal fluorescence sensing strategy based on biocompatible graphene quantum dots and graphene oxide for the detection of DNANanoscale20146115671567424763693
- KongLXuJXuYYXiangYYuanRChaiYQA universal and label-free aptasensor for fluorescent detection of ATP and thrombin based on SYBR Green I dyeBiosens Bioelectron20134219319723202351
- WangJLiuBHighly sensitive and selective detection of Hg2+ in aqueous solution with mercury-specific DNA and Sybr Green IChem Commun (Camb)200844394759476118830484
- HeYWangZGTangHWPangDWLow background signal platform for the detection of ATP: When a molecular aptamer beacon meets graphene oxideBiosens Bioelectron2011291768121889887
- ZhouDMXiQLiangMFChenCHTangLJJiangJHGraphene oxide-hairpin probe nanocomposite as a homogeneous assay platform for DNA base excision repair screeningBiosens Bioelectron20134135936523017681
- HuKLiuJWChenJAn amplified graphene oxide-based fluorescence aptasensor based on target-triggered aptamer hairpin switch and strand-displacement polymerization recycling for bioassaysBiosens Bioelectron20134259860223261695
- LuCHYangHHZhuCLChenXChenGNA graphene platform for sensing biomoleculesAngew Chem Int Ed Engl200948264785478719475600
- ZhouJLuQTongYWeiWLiuSQDetection of DNA damage by using hairpin molecular beacon probes and graphene oxideTalanta20129962563022967603
- LiZZhuWPZhangJWJiangJHShenGLYuRQA label-free amplified fluorescence DNA detection based on isothermal circular strand-displacement polymerization reaction and graphene oxideAnalyst2013138133616362023671905
- ZhangYLiuYZhenSJHuangCZGraphene oxide as an efficient signal-to-background enhancer for DNA detection with a long range resonance energy transfer strategyChem Commun (Camb)20114742117181172021952343
- NooterKHerweijerHMultidrug resistance (MDR) genes in human cancerBr J Cancer19916356636691674875
- KitadaKYamasakiTThe MDR1/ABCB1 regional amplification in large inverted repeats with asymmetric sequences and microhomologies at the junction sitesCancer Genet Cytogenet2007178212012717954267
- SuLLChengCYMrukDDDrug transporter, P-glycoprotein (MDR1), is an integrated component of the mammalian blood–testis barrierInt J Biochem Cell Biol200941122578258719720156
- MarcanoDCKosynkinDVBerlinJMImproved Synthesis of Graphene OxideACS Nano2010484806481420731455
- LiuYWangYXJinJYWangHYangRHTanWHFluorescent assay of DNA hybridization with label-free molecular switch: reducing background-signal and improving specificity by using carbon nanotubesChem Commun (Camb)200945666566719322415
- ZhangYZhaoHWuZJA novel graphene-DNA biosensor for selective detection of mercury ionsBiosens Bioelectron20134818018723685314
- ZhangYFYuanQChenTZhangXBChenYTanWHDNA-Capped Mesoporous Silica Nanoparticles as an Ion-Responsive Release System to Determine the Presence of Mercury in Aqueous SolutionsAnal Chem20128441956196222240146