
 ?Mathematical formulae have been encoded as MathML and are displayed in this HTML version using MathJax in order to improve their display. Uncheck the box to turn MathJax off. This feature requires Javascript. Click on a formula to zoom.
Abstract
Nanodispersion systems allow incorporation of lipophilic bioactives, such as astaxanthin (a fat soluble carotenoid) into aqueous systems, which can improve their solubility, bioavailability, and stability, and widen their uses in water-based pharmaceutical and food products. In this study, response surface methodology was used to investigate the influences of homogenization time (0.5–20 minutes) and speed (1,000–9,000 rpm) in the formation of astaxanthin nanodispersions via the solvent-diffusion process. The product was characterized for particle size and astaxanthin concentration using laser diffraction particle size analysis and high performance liquid chromatography, respectively. Relatively high determination coefficients (ranging from 0.896 to 0.969) were obtained for all suggested polynomial regression models. The overall optimal homogenization conditions were determined by multiple response optimization analysis to be 6,000 rpm for 7 minutes. In vitro cellular uptake of astaxanthin from the suggested individual and multiple optimized astaxanthin nanodispersions was also evaluated. The cellular uptake of astaxanthin was found to be considerably increased (by more than five times) as it became incorporated into optimum nanodispersion systems. The lack of a significant difference between predicted and experimental values confirms the suitability of the regression equations connecting the response variables studied to the independent parameters.
Introduction
Carotenoids are natural pigments with essential biological effects, including antioxidant activity.Citation1 Astaxanthin is a carotenoid compound found in salmon, crabs, shrimps, and some other sea foods. Recently, astaxanthin has gained popularity as a nutraceutical and a therapeutic component for the treatment or prevention of several diseases, including cancer, age-related macular degeneration, inflammation, Helicobacter pylori infection, and cardiovascular oxidative stress, and for general enhancement of the immune response.Citation1,Citation2 However, as with other carotenoids, its structure has various unsaturated double bonds that decompose easily during exposure to oxygen, light, and heat. Moreover, the imperfect water solubility/dispersibility of astaxanthin has hampered its usefulness.Citation3–Citation5 Even with the numerous recognized advantages of nanosized delivery systems, preparation of astaxanthin nanodispersions has not yet been demonstrated.
Nanodispersion systems have received much attention recently because of their considerable potential for food and pharmaceutical applications.Citation6 The development of these nanosized delivery systems has led to considerable improvement in the properties of various bioactive compounds including their water solubility, bioavailability, and stability.Citation3,Citation4 Nanodispersions are non-equilibrium complicated systems; however, because they have relatively high kinetic stability, they approach thermodynamic stability. These systems are composed of fine dispersed nanoparticles ranging in size from 20–200 nm in a continuous phase.Citation6
Different techniques are available for the preparation of nanodispersions. The solvent diffusion technique has been widely used for the preparation of functional bioactive lipid compounds.Citation4,Citation6 This technique involves the dissolution of a lipophilic compound in a partially water-miscible organic solvent, for example, tetrahydrofuran, acetone, ethanol, or a mixture of water-miscible and water-immiscible solvent.Citation7 A large amount of water is then applied to the system to change the continuous phase nature (from organic solvent to water) and produce the nanodispersion system. This procedure is known as the solvent shifting process. A solvent shifting step can also be applied to a system by elimination of the organic solvent using an appropriate evaporation process after mixing the aqueous and organic phases.Citation6 The spontaneous particle creation is described by boundary layer turbulence, which begins by the diffusion of solvent. According to this model, boundary layer turbulence breaks down the partitions in a nanodimensional solution.Citation8 The active compound and the stabilizer are then concurrently precipitated by increasing the diffusive depletion of the solvent. This process is known as the nanoprecipitation technique.Citation6 In such processes, the mixing parameters, such as mixing speed and time, play an important role in determining the characteristics of the nanodispersions produced.Citation7 Since the effects of these parameters have not been evaluated as yet, the aim of the current research was to study the influence of homogenization parameters on the characteristics of astaxanthin nanodispersions and then to optimize these parameters to obtain the most desirable nanodispersions with minimum particle size and polydispersity index (PDI) and maximum astaxanthin content and minimum astaxanthin loss during the process. Subsequently, the in vitro bioavailability of astaxanthin nanodispersions prepared under the proposed individual and multiple homogenization conditions was evaluated in a human colon carcinoma HT-29 cell line as a model for human colon epithelial cells.
Materials and methods
Materials
Tween 20 (polyoxyethylenesorbitanmonolaurate) along with high performance liquid chromatography (HPLC) and analytical grade dichloromethane, acetone, acetonitrile, and methanol were sourced from Fisher Scientific (Leicestershire, UK). Astaxanthin (>85%) was obtained from Kailu Ever Brilliance Biotechnology Co Ltd (Beijing, People’s Republic of China). HT-29 (HTB 38, a human colon carcinoma cell line) and modified McCoy’s 5a medium (ATCC 30-2007) were sourced from the American Type Culture Collection (ATCC, Rockville, MD, USA). Penicillin, streptomycin, trypsin 0.25%, and fetal bovine serum were supplied by Gibco (Grand Island, NY, USA) and phosphate-buffered saline was provided by Sigma-Aldrich (St Louis, MO, USA).
Preparation of astaxanthin nanodispersions
Tween 20 (1% w/w) was dissolved in deionized water to produce the aqueous phase. The organic phase (composed of 62% w/w acetone and 38% w/w dichloromethane) containing dissolved astaxanthin (1% w/w) was then gradually added to the water phase under magnetic stirring. Mixing the organic and water phases was completed using a high-shear homogenizer (Silverson L4R, Silverson Machines Ltd, Waterside, UK) for various times (0.5–20 minutes) and at various speeds (1,000–9,000 rpm) derived from a two-factor central composite design (). The aqueous to organic phase ratio in all samples was set at 9:1 (w/w). The solvents were evaporated from the system afterwards by a vacuum rotational evaporator (Eyela NE-1001, Tokyo Rikakikai Co Ltd, Tokyo, Japan) under reduced pressure (0.25 atm) at a temperature of 47°C. The sample was studied in terms of mean particle size, PDI, and astaxanthin loss (percentage weight for weight, % w/w).
Table 1 Central composite design and response variables for processing of astaxanthin nanodispersions
Particle size and PDI measurements
A dynamic light scattering particle size analyzer (series ZEN 1600, Malvern Instruments Ltd, Malvern, UK) was used to estimate the mean particle size and PDI of freshly produced astaxanthin nanodispersions. All samples were diluted (1:10) with deionized water to prevent the effects of multiple scattering. The measurement temperature was set at 25°C.
The dynamic light scattering technique measures the time-dependent oscillation of scattered light in dispersed nanoparticles due to Brownian movement, which depends on their dimensions. PDI is a dimensionless approximation that describes the homogeneity of nanodispersions. Its value changes from 0 to 1, and smaller values correspond to a narrower and finer particle size distribution.Citation3
Determination of astaxanthin content
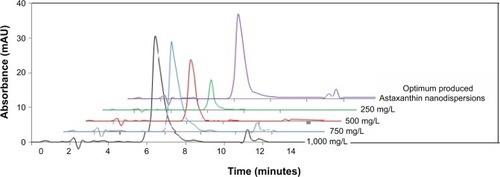
In a screw tab amber vial, 0.5 mL of sample was added to 2 mL of a 50:50 (v/v) mixture of methanol and dichloromethane. The tightly closed vial was then agitated using a vortex shaker (Vortex 3, IKA, Staufen, Germany) for 15 minutes, then centrifuged at room temperature for 5 minutes in a Kubota 2010 centrifuge (Kubota, Tokyo, Japan) at 800× g and decanted. This extraction process was repeated twice. The extract volume was increased to 10 mL by addition of methanol and filtered with a membrane filter. Next, 40 μL of filtrate was injected into a HPLC column. In order to determine the astaxanthin content in the nanodispersions, an HPLC analysis was carried out using a liquid chromatography system (1200 series, Agilent Technologies, Waldbronn, Germany) equipped with a Nova-Pak® C18 (5 μm, 3.9×300 mm) HPLC column (Waters, Milford, MA, USA) at ambient temperature and with a G13150 diode array detector. An isocratic mobile phase consisting of 5% v/v water, 5% v/v acetonitrile, 5% v/v dichloromethane, and 85% v/v methanol was used for this measurement and the detection wavelength was at 480 nm.Citation9 The chromatogram peaks were recognized and quantified using an external astaxanthin standard. Astaxanthin with a defined concentration (1,000 mg/L) was dissolved in a mixture of HPLC grade dichloromethane and methanol (25:75). To obtain the calibration curve, various dilutions were prepared from this stock solution by addition of methanol. The chromatograms of standard solutions as well as the extracted astaxnthin from optimized nanodispersion are shown in . The standard astaxanthin solutions showed good linearity in the tested range (100–1,000 μg/L), within 95% confidence limits (Y =124.29X, Y being astaxanthin content (mg/L), X being peak area, R2=0.989). The precision was measured as repeatability in which three injections were carried out for each sample (). The small standard deviations and mean percentage coefficient of variation (2.7%) confirm that the measurements of concentration in this study were of acceptable precision. The accuracy of the method was also verified due to the average percent error (less than 3%) obtained and the recovery range found (92%–108%). The limit of quantification and limit of detection on the basis of the standard deviation of the response and the slope obtained from the linearity plot of each astaxanthin standard solution were calculated to be 45 μg/L and 15 μg/L, respectively.
Figure 1 Representative high-performance liquid chromatograms of dissolved astaxanthin in different concentrations (stock solutions) and extracted astaxanthin from suggested optimum astaxanthin nanodispersions (prepared using homogenizer for 7 minutes and 6,000 rpm).
Abbreviation: mAU, milli-absorbance units.
Transmission electron microscopy analysis
An electron microscope (7100, Hitachi Scientific Instruments, Tokyo, Japan) working at 100 kV was used to obtain transmission electron microscopy images from the final optimized astaxanthin nanodispersions for investigation of their particle size distribution and microstructure. The conventional negative staining method was used to prepare samples for this analysis.
Bioavailability measurement (uptake of astaxanthin)
The HT-29 human colon carcinoma cell line was selected as a model for human colon epithelial cells and for in vitro testing of bioavailability. The cells were maintained in supplemented McCoy’s 5a medium with sodium bicarbonate and L- glutamine containing 1% (v/v) penicillin, 1% (v/v) streptomycin, and 10% (v/v) fetal bovine serum at 37°C and in a humidified atmosphere of 5% CO2 and 95% air. Three days after seeding, the cells were incubated with cell culture medium containing 10 μM of the selected astaxanthin nanodispersions () after washing with phosphate-buffered saline. Subsequent to an additional 48 hours of incubation at maintenance conditions (37°C and 95% air, 5% CO2), the cell monolayers were soaked with phosphate-buffered saline, trypsinized, and resuspended in 10 mL of culture medium. An aliquot of the suspension was used to count cell numbers and the rest was rinsed with phosphate-buffered saline and then suspended in 2 mL of water/ethanol (1:1, v/v). The cellular astaxanthin was extracted three times using methanol/dichloromethane (1:1, v/v) and quantified by HPLC.Citation4
Table 2 Homogenization conditions and physicochemical characteristics of astaxanthin nanodispersions used for bioavailability studies
Experimental design and data analysis
Response surface methodology was used to evaluate the effects of two homogenization factors on the prepared astaxanthin nanodispersions. Therefore, 14 experimental treatments were assigned based on a two-factor central composite design with five levels for each independent factor (). The responses measured were mean particle size (Y1, nm), PDI (Y2), and astaxanthin loss (Y3, w/w %) in the resulting nanodispersion, while the independent factors were mixing time (x1, 0.5–20 minutes) and mixing speed (x2, 1,000–9,000 rpm) when using a high shear homogenizer. The center point (x1=10 min and x2=5,000 rpm) was repeated five times and experiments were randomized in order to minimize the influence of unexpected variability in the actual responses due to irrelevant factors. The polynomial regression models were obtained using a least-squares technique to predict their constant, linear, quadratic, and interaction coefficients for each of the response variables. The general model for calculating the variation of the response factors is given as:
Results and discussion
Empirically significant (P<0.05) regression equations were provided by response-surface analysis for assessing the variation of all the studied response variables as a function of the homogenization parameters during production of astaxanthin nanodispersions.
shows the corresponding R2 values and coefficients of the fitted models. The significance of each parameter based on the P-values obtained is given in . The results noted that the association of homogenization variables (x1, time; x2, speed) with studied response parameters could be explained by significant (P<0.05) polynomial second-order regression models. shows the F-ratio and P-value of each homogenization factor affecting the physicochemical properties of the astaxanthin nanodispersions. Final reduced models were obtained after refitting of the experimental data based on significant (P<0.05) terms and removing the nonsignificant (P>0.05) ones from the initial models, except linear terms.Citation3 The final fitted reduced models were valid only in the selected ranges.Citation10
Table 3 Regression coefficients, R2, adjusted R2, and probability values for the final reduced models
Table 4 Significance probability (P-value, F-ratio) of regression coefficients in final reduced second-order polynomial models
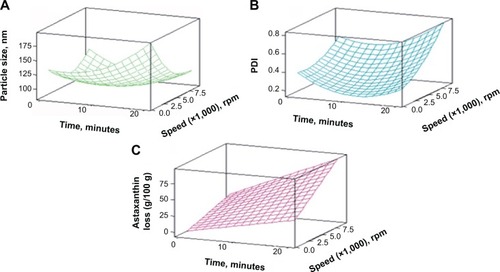
The mean particle size changes could be significantly (P<0.05) predicted by a second-order regression model with an acceptable coefficient of determination value (R2=0.896), as shown in and . Although variation of mean particle size was not influenced by the main effect of homogenization time, it was negatively associated with the homogenization speed and its interaction with homogenization time. It was also positively correlated with the quadratic effects of the studied homogenization parameters. The quadratic terms of these parameters showed the greatest significant (P<0.05) effects on mean particle size variations (). As shown in , the minimum values for the mean particle size of the nanodispersions produced fell for low lengths of time and middle rates of homogenization speed. The homogenization speed was a good indicator of the energy applied to the system based on the velocity of the rapidly rotating mixing heads. The mixing force to break up the larger droplets into smaller ones was the mechanical impingement against the wall caused by high fluid acceleration and the shear stress in the gap between the rotor and the stator caused by the rapid rotation of the stator.Citation11 At lower mixing speeds, the mixing energy was insufficient, so in this operational area, the final mean particle size of the produced nanodispersions was more than 100 nm. also shows that the nanodispersions produced at high homogenization speeds had large mean particle sizes, which is not favorable. This may have occurred due to overprocessing of the system. Excess energy input increased the knocking frequency between particles in the system, leading to coalescence and the formation of larger particles.Citation12 Homogenization time refers to the time that the emulsion spends in the homogenizer during the mixing process for the organic and aqueous phases. Increasing the residence time increased the applied total energy to the system. Therefore, nanodispersions with a large particle size were produced with extended homogenization times, most likely especially when associated with high levels of homogenization speed which are expected.Citation11 The increases in particle size were greater when the mixing times were more than 15 minutes (P<0.05).
Figure 2 Response surface plots for (A) mean particle size, (B) PDI, and (C) astaxanthin loss from astaxanthin nanodispersions as a function of significant (P<0.05) interaction effects between time and speed of homogenizer.
Abbreviation: PDI, polydispersity index.
Furthermore, an increased particle size in the produced nanodispersions at low levels of either homogenization speed or time may be related to possible insufficient residence time of the surface active molecules during the homogenization to allow their adsorption onto the entire droplet surface available before droplet-droplet collisions occurred.Citation3
The individual optimization analysis indicated that the smallest mean particle size (Y1 =87.4 nm) would be gained by homogenizing the nanodispersions for 10 minutes at 6,600 rpm, which was coded as sample A and its cellular uptake was subsequently determined (). The results also demonstrate that the independent parameters affected the PDI (Y2) variations significantly ( and ). Therefore, the PDI changes were explained as a function of the main, interaction, and quadratic effects of time and speed of the homogenizer. The results indicate that the PDI of the nanodispersion systems was increased by increasing the speed of the homogenization process, while the most uniform and homogeneous nanodispersion systems (with a lower PDI) were obtained for middle homogenization times (). Increasing the PDI by increasing the energy input of the system (by enhancing the speed or further increasing the homogenization time) occurred mainly as a result of creation of a wide tail in the size distribution due to various recoalescence of the freshly formed fine particles in the homogenization chamber or afterwards.Citation3
The individual optimum conditions indicated that the smallest amount of PDI (Y2 =0.172) can be achieved using a homogenizer at 1,000 rpm for 11.5 minutes. This sample was prepared, coded as B, and used for measurement of bioavailability ().
The results showed that the loss of astaxanthin arose from either the emulsification or evaporation stages. and showed that the astaxanthin loss (Y3) deviation was significantly (P<0.05) explained by a polynomial nonlinear function of emulsification parameters, particularly homogenization speed. While the interaction effect of the time and speed of homogenization was significant, the quadratic effects of both on the loss of astaxanthin in the nanodispersions were not significant (P>0.05).
As shown in and in and , an increase in either time or speed of homogenization considerably increased the loss of astaxanthin in the produced nanodispersions. It was shown that astaxanthin, is highly susceptible to heat, oxygen, and light, as are other carotenoids.Citation5 Introducing high-energy input to the system by increasing the homogenization speed led to an increase in temperature in the system, and consequent loss of astaxanthin was expected. Moreover, increasing the homogenization time prolongs the exposure of the system to heat, oxygen, and light, accelerating the degradation of astaxanthin in the nanodispersion systems.Citation3
It was shown that the least amount of time (0.5 minutes) and speed (1,000 rpm) of homogenization led to production of nanodispersions with maximum concentrations of astaxanthin. The cellular uptake of this sample was also determined ().
The best astaxanthin nanodispersions would be gained if the process resulted in the least mean particle size, PDI, and degraded astaxanthin. Multiple-response optimizations were undertaken to predict the best values for time and speed of the homogenizer in terms of the desired response goals.Citation3 It was shown by numerical overall optimization that using the homogenizer at 6,000 rpm for 7 minutes in the preparation of the astaxanthin nanodispersions was predicted to give the most desirable products, with a particle size of 88.9 nm, PDI of 0.322, and astaxanthin loss of 32.4% (w/w). The bioavailability of this overall optimum sample was measured in this study as well.
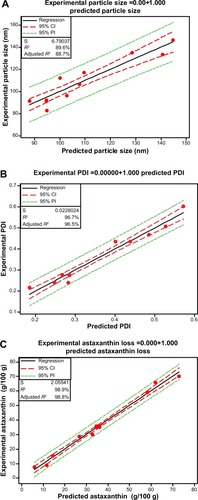
The adequacy of the suggested regression models was also verified by comparison and by evaluating the expected values for the final reduced models and the experimental ones. The recommended astaxanthin nanodispersions provided by the individual and multiple optimization procedures were then prepared and evaluated in terms of their nanodispersion properties.Citation4 The overall similarities between the experimental and predicted values for these characteristics established the adequacy of the suggested regression equations (). Three astaxanthin nanodispersions were prepared according to each recommended optimal level, and subjected to physicochemical characterization. As shown in , the closeness between the response values obtained from the experimental data and those predicted by the models further confirmed the adequacy of the models suggested in this study.
Figure 3 Fitted line plots between the experimental and predicted values for (A) mean particle size, (B) PDI and (C) astaxanthin loss; dashed lines (- -) and dotted lines (….) show 95% CI and 95% PI, respectively.
Abbreviations: CI, confidence intervals; PDI, polydispersity index; PI, predicted intervals.
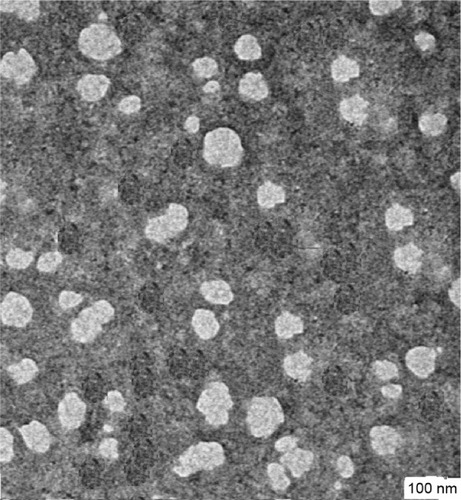
The morphology and particle size of the optimum astaxanthin nanodispersions were also studied by electron microscopy (). As shown in the transmission electron microscopy image, these nanodispersions contain polydispersed spherical-shaped nanoparticles, in good agreement with the particle size analysis results obtained by the dynamic light scattering instrument.
Figure 4 Transmission electron micrographs of astaxanthin nanodispersion prepared in optimum homogenization conditions (6,000 rpm and 7 minutes).
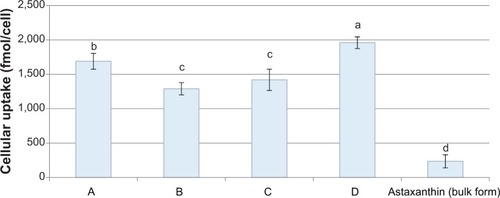
Uptake of the individual and multiple optimized astaxanthin nanodispersions by the HT-29 cell line was also determined in this study (). Since the direct evaluation of carotenoid absorption in human or animal models are both cost and time intensive, in vitro model, such as cellular uptake measurement, has been selected because of its ability to provide useful insights about the relative bioavailability of bioactive compounds, their effective parameters and mechanisms.Citation4,Citation13 As shown in , the cellular concentration of astaxanthin in nanoparticle form could be considerably increased (by more than five-fold) as compared to astaxanthin in bulk system.Citation4,Citation13 As shown in , the cellular concentration of astaxanthin could be considerably increased (by more than five-fold), as it converted to nanoparticle form in prepared dispersion systems. The multiple optimized astaxanthin nanodispersions showed higher cellular uptake when compared with individual optimized ones. The cellular uptake of samples B and C did not differ significantly and were less than A. The negative effect of particle size on cellular uptake in bioactive-loaded emulsion/dispersion systems has been demonstrated by previous researchers.Citation4,Citation14–Citation16 Small droplets have a large surface area so can be digested more rapidly and absorbed more easily. Moreover, smaller particles can penetrate easily into the mucous layer coating epithelial cells in the small intestine and bring them closer to the site of absorption. Very small particles may also be directly transported across the epithelial cell layer by paracellular or transcellular mechanisms.Citation16 Therefore, the greater cellular uptake of samples A and D can be related to their smaller particle size. The greater astaxanthin concentration in sample D caused its relatively high cellular uptake (compared with sample A), as astaxanthin concentration was also a crucial parameter on cellular uptake in bioactive-loaded dispersion system.Citation14 It seems that in the nanodispersions used in our study, systems with a smaller mean particle size and higher PDI values include larger proportions of nanoparticles with less than critical sizes and consequently more are available for cells.Citation17 Thus, a positive effect was observed between the PDI and cellular uptake values of the studied astaxanthin nanodispersions.Citation18 The results indicated that the cellular uptake of samples A, B, C, and D were respectively 7.2, 5.5, 6, and 8.3 times higher than astaxanthin in bulk form ().
Figure 5 Cellular uptake of astaxanthin from individual and multiple suggested astaxanthin nanodispersions. (A) Optimum astaxanthin nanodispersions based on minimum particle size, individual optimized. (B) Optimum astaxanthin nanodispersion based on minimum polydispersity index, individual optimized. (C) Optimum astaxanthin nanodispersion based on minimum astaxanthin loss, individual optimized. (D) Optimum astaxanthin nanodispersions based on minimum particle size, polydispersity index, and astaxanthin loss, multiple optimized. Astaxanthin (bulk form) is astaxanthin powder dissolved in 0.5% tetrahydrofuran.
Notes: a–dDifferent letters show statistically significant differences (P<0.05) between experimental response values in which the comparisons tests were performed between similar responses.
Conclusion
Response surface methodology was confirmed to be a helpful technique for optimizing process parameters, such as homogenization factors, to obtain the most attractive physicochemical characteristics in astaxanthin nanodispersions. Because the analysis of variance (ANOVA) showed high overall coefficient-of-determination values (R2>0.89) for the regression models, it was possible to develop empirical equations to describe and predict the variation of the response variables based on the time and speed of homogenization used for astaxanthin nanodispersion preparations. The results indicate that, in most cases, excessive homogenization duration and speed increased the probability of overprocessing and consequently caused undesirable changes in the physicochemical characteristics of the products. The statistical multiple optimization process indicates that in general the best processing region for yielding the most favorable nanodispersion can be gained by using the homogenizer for 7 minutes at 6,000 rpm. Analysis of the in vitro cellular uptake of astaxanthin from the suggested individual and multiple optimized astaxanthin nanodispersions suggests that uptake of astaxanthin from the nanodispersions was considerably greater (by more than five-fold) as compared with its micro (bulk) form. The cellular uptake of the final suggested astaxanthin nanodispersions (multiple optimized one) was greater than individual optimized nanodispersions based on particle sizes, and both were higher than those optimized based on either PDI or astaxanthin loss values. The good agreement between the predicted and experimental values establishes the adequacy of the suggested models.
Acknowledgments
The work was supported by the National Plan for Science and Technology funded by King Abdulaziz City for Science and Technology (project number 12-AGR 2494-02).
Disclosure
The authors report no conflicts of interest in this work.
References
- OlaizolaMThe health benefits of Haematococcus astaxanthin: cardiovascular healthAgro Food Industry Hi-Tech2005163537
- Higuera-CiaparaIFélix-ValenzuelaLGoycooleaFMAstaxanthin: a review of its chemistry and applicationsCrit Rev Food Sci Nutr20064618519616431409
- AnarjanNMirhosseiniHBaharinBSTanCPEffect of processing conditions on physicochemical properties of astaxanthin nanodispersionsFood Chem2010123477483
- AnarjanNTanCPLingTCEffect of organic-phase solvents on physicochemical properties and cellular uptake of astaxanthin nanodispersionsJ Agric Food Chem2011598733874121726079
- TanCPNakajimaMβ-Carotene nanodispersions: preparation, characterization and stability evaluationFood Chem200592661671
- HornDRiegerJOrganic nanoparticles in the aqueous phase – theory, experiment, and useAngew Chem Int Ed Engl2001404330436112404417
- VermaSLanYGokhaleRBurgessDJQuality by design approach to understand the process of nanosuspension preparationInt J Pharm200937718519819446617
- RibeiroHSChuB-SIchikawaSNakajimaMPreparation of nanodispersions containing β-carotene by solvent displacement methodFood Hydrocoll2008221217
- AnarjanNTanCPDeveloping a three component stabilizer system for producing astaxanthin nanodispersions. Food Hydrocoll1201330437447
- MontgomeryDCDesign and Analysis of ExperimentsNew York, NY, USAWiley2001
- JafariSMAssadpoorEHeYBhandariBRe-coalescence of emulsion droplets during high-energy emulsificationFood Hydrocoll20082211911202
- McClementsDJFood Emulsions: Principles, Practice and TechniquesBoca Raton, FL, USACRC Press1999
- FaillaMLHuoTThakkarSKIn vitro screening of relative bioaccessibility of carotenoid from foodsAsia Pac J Clin Nutr200817Suppl 120020318296337
- FredeKHenzeAKhalilMBaldermannSSchweigertFJRawelHStability and cellular uptake of lutein-loaded emulsionsJ Funct Foods20148118127
- Salvia-TrujilloLQianCMartín-BellosoOMcClementsDJInfluence of particle size on lipid digestion and β-carotene bioaccessibility in emulsions and nanoemulsionsFood Chem20131411472148023790941
- AnarjanNTanCPNehdiIALingTCColloidal astaxanthin: preparation, characterisation and bioavailability evaluationFood Chem20121531303130922953858
- McClementsDJEdible lipid nanoparticles: digestion, absorption, and potential toxicityProg Lipid Res20135240942323664907
- AnarjanNNehdiIATanCPInfluence of astaxanthin, emulsifier and organic phase concentration on physicochemical properties of astaxanthin nanodispersionsChem Cent J2013712723875816