
Abstract
Purpose
A simple, one-pot strategy was used to synthesize reduced graphene oxide (RGO) nanosheets by utilizing an easily available over-the-counter medicinal and edible mushroom, Ganoderma lucidum.
Methods
The mushroom was boiled in hot water to liberate the polysaccharides, the extract of which was then used directly for the reduction of graphene oxide. The abundance of polysaccharides present in the mushroom serves as a good reducing agent. The proposed strategy evades the use of harmful and expensive chemicals and avoids the typical tedious reaction methods.
Results
More importantly, the mushroom extract can be easily separated from the product without generating any residual byproducts and can be reused at least three times with good conversion efficiency (75%). It was readily dispersible in water without the need of ultrasonication or any surfactants; whereas 5 minutes of ultrasonication with various solvents produced RGO which was stable for the tested period of 1 year. Based on electrochemical measurements, the followed method did not jeopardize RGO’s electrical conductivity. Moreover, the obtained RGO was highly biocompatible to not only colon (HT-29) and brain (U87MG) cancer cells, but was also viable towards normal cells (MRC-5).
Conclusion
Besides being eco-friendly, this mushroom based approach is easily scalable and demonstrates remarkable RGO stability and biocompatibility, even without any form of functionalization.
Keywords:
Introduction
Graphene, a monolayer of spCitation2 hybridized carbon atoms arranged in a honeycomb lattice, has gained tremendous attention among researchers due to its unique mechanical, electrical, and thermal properties, as well as due to its high surface to volume ratio. Various technological applications have been reported for graphene such as in nanoelectronics, supercapacitors, polymer nanocomposites, drug delivery systems, biosensing, solar cells, memory electronics, optoelectronics, transistor devices, etc.Citation1,Citation2 However, graphene sheet, also known as reduced graphene oxide (RGO), is hydrophobic and tends to agglomerate irreversibly or even transforms back to graphite due to its van der Waals’ interaction and its stronger π–π stacking, which limits its further applications. Therefore, the route of synthesis of RGO is of vital importance to impart stability as most of its unique electrical and mechanical properties are associated only with the individualized graphene sheets.Citation3–Citation5 In addition, imparting solubility in water is also crucial as a well-dispersed RGO would allow further functionalization and open opportunities for various technological applications.
Several methods have been reported to obtain RGO such as micromechanical cleavage,Citation6 epitaxial growth,Citation7 chemical vapor deposition,Citation8 unzipping of carbon nanotubes (CNTs),Citation9 and chemical reduction of graphene oxide (GO).Citation10 Micromechanical method suffers from low productivity which hinders large scale applications;Citation11 the epitaxial growth method produces graphene with random and uncontrollable thickness;Citation2 whereas the methods of chemical vapor deposition and unzipping of CNTs involve using several chemicals and lengthy reaction steps, besides being tedious. Hence, much focus has been placed on solution-based reduction of GO which generally produces single to few-layer graphene sheets. Conventional thermal reduction, however, requires higher temperatures and pressures for the removal of intercalated water molecules and oxide functional groups.Citation11,Citation12 In addition, it requires specific reaction vessels and may cause environmental and economic concerns when large scale production is considered.
Therefore, researchers are more interested in finding out suitable reducing agents. The most commonly used chemical reducing agents are anhydrous hydrazine,Citation13 hydrazine monohydrate,Citation14 sodium borohydride,Citation15 and hydroquinone.Citation16 These reducing agents are highly toxic, harmful, and explosive. Moreover, hydrazine-reduced graphene tends to agglomerate irreversibly and converts into graphite.Citation17 Metal/hydrochloric acid reduction is another alternative; however, impurities formed from the residual metal hinders further applications.Citation18,Citation19
Recently, reduction of GO using environmentally friendly organic agents such as vitamin C,Citation20 amino acid,Citation21 glucose,Citation22 protein,Citation23 green tea,Citation24,Citation25 dextran,Citation26 bacterial respiration,Citation27 and Escherichia coliCitation12 have taken a center stage and have been proposed as alternatives. Although these methods are eco-friendly, they demand tedious experimental procedures and require expensive reagents and longer reaction times. Besides, some of these methods introduce foreign materials to RGO that may reduce its purity and limit its further applications. An additional step of sonication is often necessary to produce good dispersion in water. Moreover, incomplete reduction and formation of large graphene aggregates hamper its good electrical conductivity.Citation28 Most of the reports also claim their suitability for drug delivery; however, cytotoxicity studies on normal healthy cells have never been looked into. Thus, there is an impending demand to develop an easy approach which can produce RGO with good purity but without losing its excellent electrical properties and its biocompatibility.
Ganoderma lucidum (GL), widely known as Reishi in Japan or Ling Zhi in People’s Republic of China, has been a popular mushroom often used in many medicinal applications. It is used in the treatment of a variety of ailments such as hypertension, diabetes, hepatitis, cancer, and AIDS.Citation29 In Asia and North America, usage of this mushroom extends to nutraceuticals and food processing due to many of its astounding properties such as antioxidant, anti-inflammatory, antibacterial, and antiviral.Citation30,Citation31 One of the interesting properties of this mushroom extract is its high content of polysaccharides which exhibit strong antioxidant properties.Citation32,Citation33 More specifically, the antioxidant quality is mainly contributed by the high content of glucans, which has been observed more in GL compared to any other Ganoderma sp.Citation31,Citation34,Citation35 Besides polysaccharides being the major components, the GL extract also contains proteins and polyphenols;Citation29,Citation31 however, the higher content of glucan supersedes the content of the former two, and thus it is safe to assume that the excellent reducing ability is mainly due to the polysaccharides (glucans). In addition to glucans, the presence of reducing sugars such as glucose and galactose in the polysaccharide further contributes to its reducing potential.Citation36 Moreover, the excellent reducing ability of polysaccharide was also proven by the ability to scavenge DPPH (2,2-diphenyl-1-picrylhydrazyl) radicals well, good antioxidant activity, and chelating ability on ferrous ions.Citation31,Citation37 Thus, using GL extract as a reducing agent in eco-friendly RGO synthesis is a promising prospect. In addition to this, the polysaccharide is highly soluble in water and does not react with RGO, and as a consequence, a simple ultracentrifugation step can be carried out to separate the reducing agent (extract) after the reaction. Hence, we propose a strategy to produce RGO with the following multitude of benefits: 1) one-step simple synthesis; 2) environmentally friendly process; 3) feasibility to produce in larger quantities, hence economical; 4) high purity with absolute removal of mushroom extract; 5) unperturbed electrical properties; and 6) biocompatibility towards cells.
Our present investigation is different from the recently published work where mushroom was used as a reducing agent for RGO synthesis.Citation38 The major differences can be seen in terms of method of synthesis and the results obtained. Our method requires only 3 hours of preparation and the whole mushroom was used to prepare the mushroom extract for reduction instead of separating the mycelia, which is cumbersome and takes a total of 17 days to prepare. In addition, our reduction reaction is much simpler, whereby it was conducted for 16 hours using a water bath, allowing for bulk production, instead of subjecting to ultrasonication for 24 hours. According to atomic force microscope (AFM), X-ray diffraction (XRD), and size distribution analysis, the RGO obtained in our case is of 1–2 nm thickness, with 3–5 layers, and 181 nm lateral dimension, respectively, instead of much bigger size and thicker sheets, as reported. Moreover, we have carried out the biocompatibility studies both with cancer cells and normal cells, compared to other reports in which only cytotoxicity studies on cancer cells were determined, disregarding the effects of their synthesized RGO on normal cells, which is crucial, especially for drug-delivery or biomedical applications.
Experiment
Materials
Graphite was purchased from Asbury Graphite Mills, Inc. (Asbury, NJ, USA). GL (commercial grade) was contributed by Ganofarm Sdn. Bhd. (Tanjung Sepat, Malaysia). Typically, mushrooms (including stalk, gills, and cap) were dried and ground into powder form and sold to the commercial market. Other reagents employed were of analytical grade and used as-received. Anhydrous D-glucose was purchased from Thermo Fisher Scientific (Waltham, MA, USA) and phosphate-buffered saline was obtained from Sigma-Aldrich Co. (St Louis, MO, USA). Ultrapure deionized water was obtained from a Milli-Q Plus system (EMD Millipore, Billerica, MA, USA).
Characterization
The reduction of GO was monitored by measuring the ultraviolet–visible (UV–Vis) spectrum of the reaction at predetermined time intervals using a Lambda 35 Spectrophotometer (Perkin Elmer, Waltham, MA, USA). Fourier transform infrared spectroscopy (FTIR) spectra of solid samples were recorded on a FTIR spectrometer (Spectrum RX1; Perkin Elmer) in the frequency range of 4,000–400 cm−1. The crystalline nature of synthesized RGO was investigated by using a X’Pert Pro diffractometer (PANalytical, Almelo, the Netherlands). The XRD was operated at 45 kV with a current of 35 mA using Cu/kα radiation (λ=1.54060 Å). Thermogravimetric analysis (TGA) was performed under a nitrogen flow (50 mL/min) using a TGA/differential scanning calorimetry 1, Stare System (Mettler Toledo Inc., OH, USA). Samples were heated from room temperature to 1,000°C at 5°C/min. Ultrasonication was employed by using a Cole Parmer dip-stick sonicator (20 kHz ±5 kHz), which has a tapered microtip of 0.25 inches, with an amplitude of 40%. Zetasizer Nano ZS (Malvern Instruments, Malvern, UK) was used to analyze the hydrodynamic diameter of the particles. Samples dispersed in absolute ethanol were drop-casted on Si substrate and dried in air before subjecting to Raman and X-ray photoelectron spectroscopy (XPS) analysis. Raman spectra were acquired on an inVia Raman Microscope (Renishaw, Gloucestershire, UK) with 514 nm laser excitation source. XPS measurements were performed using a Kratos Axis Ultra (Shimadzu, Kyoto, Japan) spectrometer equipped with a monochromatized Al kα radiation and frequency of hv =1,486.6 eV. The graphene/ethanol suspension was also drop-casted on Cu grid (3 nm thick) and mica substrate for high resolution transmission electron microscopy (HRTEM), AFM, and field emission scanning electron microscopy (FESEM). HRTEM images were acquired using a Philip model (JOEL, Tokyo, Japan) operating at an accelerating voltage of 120 kV. The thickness of graphene materials was examined using a 5500 Agilent Technologies AFM System (Agilent Technologies, Santa Clara, CA, USA) using ultrasharp tips (non-contact high resonance frequency, nanosensor probe). Morphological analysis was carried out using field emission gun scanning electron microscopy Quanta SEM 400 instrument (FEI, Oregon, USA). Electrochemical studies were conducted by cyclic voltammetry (CV) measurements with a Princeton Applied Research Versastat electrochemical station. Potential range was set at −0.1 V to 0.6 V with a scan rate of 50 mV/s. Three electrode cells were used; a Ag/AgCl as the reference electrode; platinum wire as the counter electrode; and a bare and modified glassy carbon electrode (GCE) as the working electrode. Results were collected after at least 5 CV runs.
Preparation of GO
GO was produced at room temperature based on the modified Hummer’s method.Citation39 Briefly, H2SO4 (95%) and H3PO4 (88%) were added in the ratio of 9:1 to 3 g of graphite, followed by a slow addition of 18 g of KMnO4. The resulting inhomogeneous solution was allowed to stir. After 72 hours, the reaction was terminated with the addition of 400 g of ice cubes followed by 18 mL of H2O2 (30%). The mixture was then centrifuged at 6,000 rpm for 10 minutes. To the supernatant, 1 M HCl was added to discard the sulfate and phosphate ions followed by centrifugation at 11,500 rpm for 30 minutes. This was repeated three times followed by washing with deionized water six times. The final mixture was a viscous brown GO solution. A standard calibration curve of GO was generated by measuring the characteristic absorbance of GO at 230 nm using a UV–Vis spectrophotometer. The concentration of the prepared GO was found to be 10 mg/mL.
Preparation of GL extract
One hundred milliliters of Milli-Q water was added to 1 g of GL mushroom powder and the mixture was allowed to boil at 95°C for 3 hours. To remove the spent powder, the mixture was centrifuged at 10,000 rpm for 15 minutes. The solution was then stored at 4°C and was used directly for the reduction of GO (as mentioned in “Preparation of RGO using GL extract”).
Determination of the concentration of GLextract
Concentration of the GL mushroom extract was determined using the phenol–sulfuric acid assayCitation40 with glucose as a reference. Briefly, 30 mL of ethanol was added to 10 mL of GL extract and stored overnight at 4°C. The crude polysaccharide precipitate was then separated by centrifugation at 10,000 rpm for 15 minutes and the clear supernatant was then subjected to vacuum drying at 40°C to obtain a solid powder. The powder was then dissolved in 1 mL of Milli-Q water and 0.1 mL was taken to determine the concentration following the method as reported by DuBois et al.Citation40 The concentration obtained was found to be 1 mg/mL.
Preparation of RGO using GL extract
pH adjustments were carried out on the GO solution (0.1 mg/mL) by using NaOH to obtain pH 7. Fifty milliliters of GL extract was then added to a 50 mL of GO solution and transferred to a water bath which was preheated to 85°C and allowed to react for 16 hours at a mixing rate of 120 rpm. The resulting black dispersion was then ultracentrifuged at 10,000 rpm for 20 minutes to remove the GL extract. The product was then washed three times with water to further remove the residual GL extract. The resulting black RGO dispersion was then redispersed in water.
Reusability of GL extract
The GL extract, which had been separated as described above, was reused for two more cycles to reduce the freshly prepared GO using the same reduction protocol. UV–Vis measurements were used to determine the amount of GO that was converted to RGO by determining the intensity of RGO peak at 260 nm. In each case, the amount of GO converted to RGO was calculated.
GO and RGO size analysis and solubility test
Five minutes of ultrasonication with a microtip was carried out to disperse the GO and RGO before subjecting to size distribution by dynamic light scattering (DLS). For the solubility test, RGO was dispersed in water, phosphate-buffered saline, ethanol, methanol, and acetone by ultrasonication for 5 minutes. The dispersed samples were kept at room temperature (RT) and observation was continued for 12 months.
Electrochemical measurements
For CV measurements, 1 M Na2SO4 was used as an electrolyte. Five microliters of GO or RGO dispersed in ethanol was dropped on a cleaned GCE and dried in an oven at 60°C for 5 minutes.
Cell lines and culture conditions
Human grade IV glioblastoma (U87MG), colon adenocarcinoma (HT-29), and normal lung fibroblast (MRC-5) cells were used in this study. HT-29 and MRC-5 cells were cultured with RPMI (Roswell Park Memorial Institute) 1640 medium (Nacalai Tesque, Kyoto, Japan) whilst U87MG cells were cultured with MEM (minimum essential medium) containing sodium pyruvate (Nacalai Tesque). The steps on propagation and maintenance of the cells were followed as described previously.Citation41
Neutral red uptake assay
Cell viability of GO and RGO treatments was performed by neutral red uptake assay on U87MG, HT-29, and MRC-5 cells as described by Lim et al.Citation42 A total of 5×10³ cells were seeded in 96-well plates (SPL Life Sciences, Gyeonggi, South Korea) and incubated overnight for attachment. The cells were treated with 200 μL of media containing 0.1–50 μg/mL of GO and RGO, whereas cells grown in media without any treatment were used as a negative control. Following 48 hours of incubation at 37°C, the percentage of cell viability was determined. All experiments were carried out in triplicate in three independent experiments. Absorbance readings of the plates were captured by using a microplate reader (Thermo Fisher Scientific) at 490 nm.
Statistics
Statistical analysis was performed using the Graphpad Prism (version 5) software. One-way analysis of variance was used to test for statistical significance between treated and untreated groups using Dunnett’s t-test. Meanwhile, comparison amongst treatment groups was done by two-way analysis of variance using Bonferroni t-test.
Results and discussion
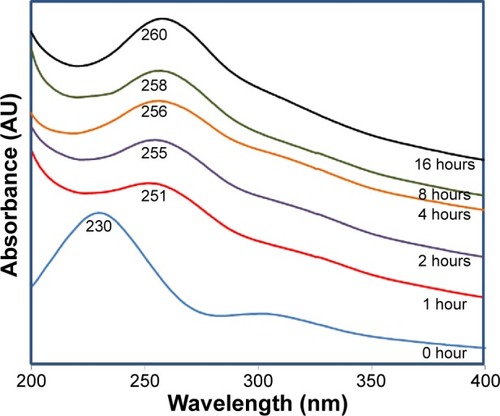
The reduction of GO using GL extract was monitored by time-dependent UV–Vis spectroscopy as shown in . The strong absorption peak at 230 nm (0 hours) is a distinctive peak of GO which corresponds to π–π* transition of C=C bond, and the shoulder at 300 nm is due to n–π* transition of the C=O bonds in GO. Gradual red shifting of the 230 nm peak towards 260 nm can be seen during the reaction, suggesting the restoration of π-conjugation network of RGO after reduction. Moreover, the gradual disappearance of plasmon peak at 300 nm confirms the removal of oxygen groups in RGO.Citation3,Citation43,Citation44 The formation of RGO was observed within 1 hour with the red shift of a typical GO peak at 230 nm to 251 nm. Highest absorbance was observed at 16 hours, which indicates that reaction time is directly proportional to the amount of RGO formed.
Figure 1 Ultraviolet–visible spectra of graphene oxide reduction with Ganoderma lucidum extract at different time intervals.
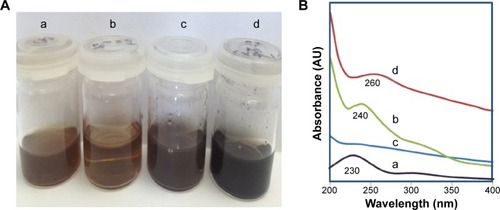
Changes in the color of solution are a good indicator of GO reduction. The brown GO solution before reaction turned to a black dispersion after reaction as shown in , which indicates the successful conversion of GO to RGO. In order to optimize the reaction conditions, two control experiments were conducted: 1) by mixing GO and GL extract at RT; and 2) heating the GO solution without GL extract at 85°C. After 16 hours, no change in the color was observed in the GO–GL mixture that was kept at RT. However, a marginal red shift to 240 nm could be observed () in the UV–Vis spectrum with a shoulder peak at around 300 nm suggesting that only an insignificant amount of GO was converted to RGO, thus confirming the need of heat for a complete reduction of GO to take place. Heat is often introduced in the reduction of GO to allow its thermal expansion and exfoliation to produce single or few-layered graphene sheets.Citation45 In addition, similar to conventional hot water extraction, heat is required in this reaction to further breakdown the cell walls of the mushroom and to liberate the polysaccharidesCitation46 which have the reducing properties. However, heating of GO alone without GL extract did not convert GO to RGO, as confirmed by the absence of absorbance peak at 260 nm in the UV–Vis spectrum. The corresponding image as shown in illustrates that GO solution has turned to dark brown, probably due to the heat which induces darkening of the solution but does not convert GO to RGO, thus verifying the need of GL extract as a reducing agent. In comparison, reaction of GO with GL extract at 85°C produces a distinctive peak of graphene, appearing at 260 nm. Hereafter, the GO reduced by GL extract at 85°C is labeled as RGO.
Figure 2 Preparation of RGO and the corresponding characterizations by ultraviolet-visible spectroscopy.
Notes: (A) Photographs of: (a) GO (0.1 mg/mL) before reaction, (b) GO GL extract at RT, (c) GO without GL extract heated at 85°C, and (d) GO GL extract heated to 85°C. (B) Corresponding UV–Vis spectra of reactions: (a) GO (0.1 mg/mL) before reaction, (b) GO GL extract at RT, (c) GO without GL extract heated at 85°C, and (d) GO GL extract heated to 85°C.
Abbreviations: GL, Ganoderma lucidum; GO, graphene oxide; RGO, reduced graphene oxide; RT, room temperature; UV–Vis, ultraviolet–visible.
To determine the capability of mushroom extract for its reusage in the reduction, GL extract after first usage was separated from the product via simple ultracentrifugation and reused to reduce the GO. By assuming a complete reduction in the first usage, about 75% conversion of GO was still observed even after the third use of GL extract as shown in . This indicates that GL extract can be reused several times without significantly losing its reducing properties, which could be lucrative for large-scale production of RGO. The conversion of GO to RGO was calculated by measuring the absorbance of RGO at 260 nm and the amount of RGO formed was determined by using a RGO standard calibration curve. In the first cycle, 5 mg of GO was found to produce 5 mg of RGO, thus showing a 100% conversion.
Table 1 Conversion of GO to RGO with the reuse of GL extract
The formation of RGO is further confirmed by FTIR spectroscopy as shown in . FTIR spectra of GO shows a strong absorption peak of νO-H at 3,412 cm−1 due to stretching vibration and a deformation peak at 1,396 cm−1 due to the hydroxyl groups located on the plane of GO. Carboxyl groups at the edges of GO sheets show stretching vibration and the νC=O peak appears at 1,726 cm−1. The spectra also exhibit several characteristic peaks of GO; νC=C at 1,630 cm−1 due to the aromatic C=C bonds; νC-O at 1,246 cm−1 due to epoxy C-O stretching vibration; and νC-O at 1,116 cm−1 due to alkoxy C-O stretching vibration.Citation4,Citation12,Citation47 Comparing with graphite (), the GO spectrum indicates successful oxidation with the presence of hydroxyl, epoxy, alkoxy, and carboxyl functional groups. Successful deoxygenation could be seen for RGO with the disappearance and reduced intensity of all the oxide functional groups. A broad C-O band that appears from 1,214 to 1,000 cm−1 even after reduction could be attributed to oxygen atoms or cyclic ether accumulated at the edges of defects in RGO. This indicates that all the oxygen groups are removed from the region adjacent to edges and only clean graphene domains are present in RGO.Citation2,Citation48 It is reported that the oxygen moieties present on the edges of RGO do not affect the electronic properties of RGO.Citation49 The spectra of GL extract exhibit a broad band around 3,397 cm−1 due to the stretching of N-H and O-H groups, and a corresponding N-H bending at 1,639.5 cm−1. Other characteristic peaks of GL extract are at 2,930 cm−1 and at 2,884.9 cm−1 due to the asymmetric stretching of CH3 and symmetric stretching of CH2, respectively. The sharp peaks at 1,074.4 cm−1 and at 1,046.5 cm−1 are due to C-O stretching and bending of C-OH in the polysaccharide.Citation50,Citation51 The absence of these characteristic peaks in RGO confirms the complete removal of GL extract after the reaction.
Figure 3 Characterizations of RGO by FTIR and XRD.
Notes: (A) FTIR spectra of (a) graphite, (b) GO, (c) RGO, and (d) GL extract; (B) XRD patterns of (a) graphite, (b) GO, and (c) RGO.
Abbreviations: FTIR, Fourier transform infrared spectroscopy; GO, graphene oxide; RGO, reduced graphene oxide; GL, Ganoderma lucidum; XRD, X-ray diffraction.
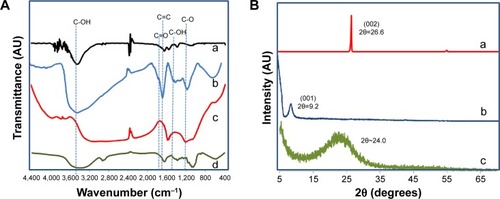
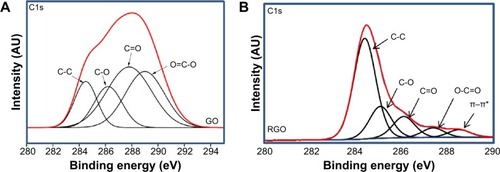
Figure 4 XPS spectra of C1s.
Notes: (A) GO and (B) RGO.
Abbreviations: GO, graphene oxide; RGO, reduced graphene oxide; XPS, X-ray photoelectron spectroscopy.
XRD analysis () is a good tool to estimate the interlayer spacing between the graphitic layers and the crystalline properties, as well as to determine the completion of reaction. Graphite exhibits a strong basal reflection (002) peak at 2θ=26.6° with an interlayer distance (d-spacing) of approximately 0.33 nm. This intense crystalline peak is a characteristic peak of hexagonal pristine graphite. The disappearance of this peak in GO confirms the complete oxidation of graphite. Upon oxidation, the diffraction peak (001) of GO appears at a lower angle (2θ=9.2°) with a d-spacing of 0.96 nm. The larger interlayer spacing after oxidation is due to the intercalation of oxide functional groups on both sides of GO sheets. In addition, structural defects (spCitation3 bonding) generated on the originally flat graphite sheets contribute to atomic-scale roughness and thus a larger d-spacing of GO.Citation52 After reduction, the distinctive GO peak of RGO disappears, indicating a complete reduction as well as exfoliation of the layered RGO sheets.Citation22,Citation53 A broad peak has been observed for RGO, starting from 2θ=15° to 2θ=30°, with the peak centered at 2θ=24°, and a d-spacing of 0.37 nm. The appearance of this peak at 24.0° is due to restoration of van der Waals’ interaction between the carbon frameworks on the graphene sheets upon reduction. The presence of a broad peak indicates the loss of long range order in the graphene sheets, the graphene sheets are stacked with few-layers.Citation17,Citation47,Citation54,Citation55 In addition, the significant reduction in the interlayer spacing of RGO as compared to GO suggests the removal of oxygen groups and water molecules from the interlayer of graphene sheets in RGO. However, a difference in the interlayer distance of approximately 0.04 nm between the pristine graphite and RGO is observed. This is probably due to the fact that it is impossible to revive the original π–π stacking between the graphene sheets after the extreme intercalation of oxygenous groups into the graphite during the chemical oxidation process. The GO sheets had probably crumpled during the exfoliation stage and remained in that position even after reduction.Citation56
The formation of RGO was further confirmed by XPS analysis. The C1s of GO as shown in demonstrates the highest intensity at the binding energy of 287.8 eV, which belongs to carbonyl functional groups. Other peaks at 284.8, 286.3, and 289.1 eV correspond to C=C/C-C in aromatic rings; C-O in hydroxyl and epoxy groups; and O-C=O in carboxyl groups, respectively.Citation12,Citation17,Citation57 After reduction, the peak intensity for all the oxygen species decreased dramatically, suggesting the effective removal of oxygen-containing groups in RGO. In addition, a sharp increase in the C=C/C-C peak at 284.4 eV and the appearance of a π–π* peak at 288.5 eV indicate the restoration of spCitation2 carbon network.Citation58 C/O molar ratio calculated from the peak areas shows a very high content of oxygen species in GO (1:13.6), whereas in RGO, the molar ratio was found to be only 1:2.16, again confirming the successful reduction of GO.
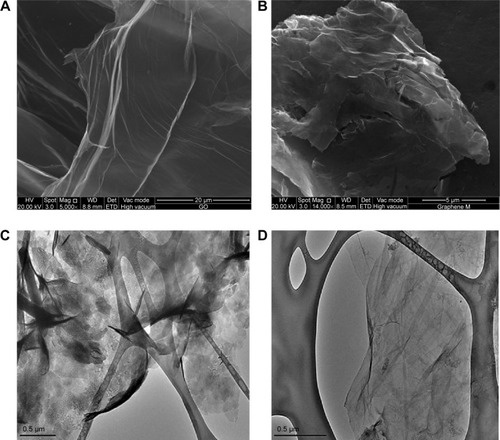
shows the FESEM images of GO and RGO. It could be observed that GO () has continuous and smooth wave-like sheets, whereas a flake-like morphology could be noted in RGO (), which forms a disordered solid with the individual sheets closely stacked. With the removal of oxygen groups from the basal plane as well as from the edges of RGO, the graphene sheets were then allowed to closely associate and stack via van der Waals’ interactions. This finding is in good agreement with the results of XRD obtained for RGO, where the d-spacing or interlayer distance is smaller than GO, permitting the stacking of RGO flakes. The RGO flakes lie flat on top of each other, suggesting the possibility of good electrical contact between them.Citation59 The microstructure of GO and RGO was further investigated by HRTEM. It could be seen that GO has a wavy structure with few well-defined layers of stacking at the edges (). The observed stacking could be due to strong hydrogen bonding interaction between the GO layers or with water molecules.Citation60 As for RGO, thin veil-like sheets were observed with scrolling and wrinkles, which confirms that reduction of GO has taken place. It was reported that scrolling is caused by the presence of isolated epoxy and hydroxyl groups, whereas the wrinkles are due to the removal of strain on the C-C bond in the epoxy groups which was created during the formation of three-membered epoxide rings in GO.Citation61 In addition, RGO appeared transparent, which is similar to the graphene produced from electrolytic exfoliation of graphite as reported by Wang et al.Citation62 The lateral dimension of RGO in both FESEM and HRTEM was approximately 500 nm.
Figure 5 Characterization of RGO by FESEM and HRTEM.
Notes: FESEM images of (A) GO and (B) RGO, and HRTEM images of (C) GO and (D) RGO.
Abbreviations: FESEM, field emission scanning electron microscopy; GO, graphene oxide; HRTEM, high resolution transmission electron microscopy; RGO, reduced graphene oxide.
To further confirm the reduction of GO, Raman spectroscopy was used to investigate the nature of layering and defects on the graphitic sheets. Generally, the Raman spectra exhibit four main featured peaks: D, G, 2D, and D plus G bands. D band is attributed to the graphene sheet edges and defects, activated by the presence of disorder, whereas the G band originates from the first-order scattering of E2g phonon of spCitation2 carbon atoms. The Raman spectra of graphite () displays a sharp G band at 1,582 cm−1 due to in-phase vibration of the graphite lattice and a weak D band at 1,370 cm−1 indicating low degree of defects that are mostly due to the sheet edges. In comparison, GO exhibits a prominent G band which is blue-shifted to 1,586 cm−1 signifying the presence of isolated double bonds which resonate at higher frequencies than that of graphite. The intensity of the D band at 1,352 cm−1 was also increased which could be attributed to the decrease in size of in-plane spCitation2 domains compared to graphite.Citation12,Citation17,Citation22,Citation52 For RGO, the G band is broadened, shifted to 1,611 cm−1, and moved closer to the G band of graphite, which is attributed to graphitic self-healing and successful reduction,Citation63 as the removal of oxygen groups allows the RGO to associate and restack. The D band of RGO becomes more prominent and remains almost at the same position as GO, ie, at 1,351 cm−1.
Figure 6 Raman spectroscopy analysis and AFM images with its corresponding height profiles.
Notes: (A) Raman spectra of (a) graphite, (b) GO, and (c) RGO. AFM images of (B) GO and (C) RGO with respective thickness measurements were taken along the cross-section, as indicated by a line and a red arrow for (D) GO and (E) RGO.
Abbreviations: AFM, atomic force microscopy; GO, graphene oxide; RGO, reduced graphene oxide.
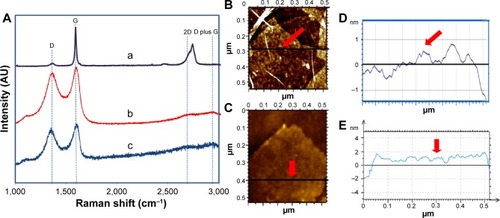
The intensity ratio of D to G is a good indicator of the degree of distortion in the graphitic sheets. As expected, the intensity ratio of RGO has dramatically increased to 0.99 as compared to GO (0.94) and graphite (0.07). A higher intensity ratio as seen in GO compared to graphite is due to the introduction of defects after oxidation of graphite, whereas the highest intensity ratio seen in RGO indicates disorder on the graphene sheets after reduction and an increase in the number of spCitation2 domains. It is suggested that the reduction of GO causes fragmentation and yields smaller RGO graphitic domains with different sizes.Citation64,Citation65
The 2D band represents the symmetry-allowed overtone of the G band. The shift, shape, and width of the 2D peak are sensitive to stacking order of the graphene sheets along the C-axis and the number of graphene layers, in which single-layered graphene has a single sharp Lorentzian peak below 2,700 cm−1. Multiple layered sheets have broader and upshifted 2D peaks.Citation3,Citation47,Citation52,Citation66 The broad 2D band of graphite from 2,627 to 2,776 cm−1 indicates the presence of multiple layered graphite sheets, whereas the 2D band of GO at 2,700 cm−1 indicates a single layered sheet. After reduction, this peak has marginally broadened and shifted to 2,769 cm−1 suggesting the presence of three-layered graphene sheets.Citation67 The cooperation between D and G peaks gives the D plus G combination band which indicates the presence of highly disordered and randomly arranged graphene sheets.Citation3,Citation4 The D plus G band is observed for GO at 2,690 cm−1 and a slightly broader band is observed for RGO at 2,692 cm−1, indicating the presence of more random arrangement in RGO. The absence of these peaks in graphite shows that it exists as a continuous long sheet.
GO and RGO were then subjected to AFM to determine their respective topography as well as thickness. The cross-section from AFM analysis shows that the maximum thickness of GO is approximately 1 nm, which is in compliance with the d-spacing of GO, ie, 0.96 nm as determined by XRD. After reduction, the RGO’s thickness is approximately 1–2 nm. The thickness obtained is similar to those produced from hydrazine reduced GOCitation68,Citation69 and hydrothermally reduced GO.Citation61 Based on the XRD analysis of RGO with 0.37 nm d-spacing, it could be estimated that RGO is few-layered (3–5 layers), similar to the observation from Raman analysis.
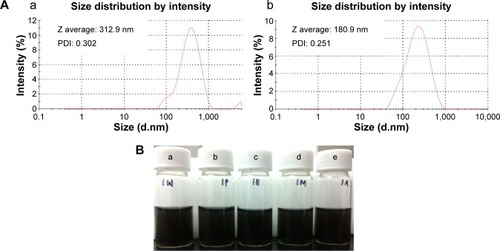
The particle size distribution of aqueous dispersion of GO and RGO was determined by DLS analysis. Although DLS is more suitable for spherical particles rather than for planar sheets like graphene, it serves to indicate whether uniformly sized dispersion of graphene was produced, besides demonstrating the changes in the size of GO and RGO. As shown in , the average size of GO and RGO was 313 nm and 181 nm, respectively. In GO, the peak appearing after 1,000 nm could be due to the presence of remnants from the reaction of graphite oxidation. Also, the presence of undisrupted long continuous sheets in the GO results in larger size. RGO, however, shows a uniform size distribution with sizes generally at least two-times smaller than GO. This concludes that there is a loss of long-range graphitic order in RGO and corroborates the observation of a D plus G peak in the XRD spectra. The smaller sized RGO observed, as compared to other reported methods,Citation52,Citation70 could be mainly due to the method of synthesis employed and due to the effect of 5 minutes of ultrasonication. Reduction of GO with E. coliCitation12 followed by sonication yields graphene with the size of 702 nm, which is almost seven-times larger than the size of RGO obtained through our strategy. Generally, ultrasonication breaks the RGO nanosheets to smaller fragments; a similar observation was also noted in GO.Citation71 In addition, ultrasonication of RGO results in better dispersion in water. A solubility test () showed that RGO is stable in the tested solvents for up to 12 months, without any visible aggregation or sedimentation. It is reported that ultrasonic treatment induces cavitation near surfaces of RGO sheets, which inhibits the aggregation of RGO by weakening its van der Waals’ interactions and, thus, enhances the formation of stable RGO dispersion.Citation58 Besides, the presence of oxygen groups at the edges of defects in RGO sheets, as observed in FTIR spectra, could have contributed to the better stability and solubility of the produced RGO.
Figure 7 DLS characterization and photograph of RGO dispersion in different solvents.
Notes: (A) Size distribution analysis on (a) GO and (b) RGO with respective PDI and size. (B) Solubility of RGO in (a) water, (b) PBS buffer, (c) ethanol, (d) methanol, and (e) acetone.
Abbreviations: PBS, phosphate-buffered saline; GO, graphene oxide; PDI, polydispersity index; RGO, reduced graphene oxide; Z, size; DLS, dynamic light scattering.
Thermal stability of graphite, GO, and RGO was analyzed using TGA (). GO exhibits much more prominent weight loss as compared to graphite and RGO due to the presence of a larger amount of oxygen groups. Below 100°C, GO has the highest weight loss of about 14.5%, owing to the removal of water molecules, whereas no weight loss was observed for graphite; but a weight loss of 5% could be observed in the case of RGO, which may be due to the removal of adsorbed water molecules. From 100°C to 200°C, GO again had the highest weight loss of about 25% due to the removal of labile oxygen functional groups: CO, CO2, and possibly remaining water molecules. Weight loss in this region was not observed in graphite, but RGO had a weight loss of approximately 14%, indicating the probable presence of residual GO or water molecules. The highest weight loss was observed from 200°C to 400°C for all three graphitic materials, ie, GO (21%), graphite (1%), and RGO (9%), which is due to bulk pyrolysis of the carbon skeleton. The highest weight loss as seen in GO for this region is due to the complete removal of residual oxygen functional groups. RGO displays better thermal stability as compared to GO due to the comparatively fewer oxygen groups and restoration of weak van der Waals’ forces between the graphene layers.Citation54
Figure 8 Thermal and electrochemical analysis of RGO using TGA and cyclic voltammetry.
Notes: (A) TGA curves of (a) graphite, (b) GO, and (c) RGO. (B) Cyclic voltammogram obtained for (a) GCE, (b) GO/GCE, and (c) RGO/GCE. The red arrow indicates oxygen and hydrogen evolution peak.
Abbreviations: GCE, glassy carbon electrode; GO, graphene oxide; RGO, reduced graphene oxide; TGA, thermogravimetric analysis.
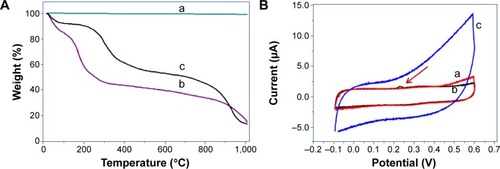
To ascertain whether the followed synthesis method affected RGO’s electrochemical characteristics, a CV measurement was conducted (). All CV curves were recorded after several cycles of CV and when they became stable. CV of GO/GCE demonstrated almost no electrical potential, with CV curves overlapping those of bare GCE. After reduction, far superior electrical potential was observed for RGO/GCE, with a higher value of current response and CV area. This is largely contributed by an increase in electron transfer in the RGO layer and electronic transition between the RGO layers. The voltammogram for GO showed obvious oxygen and hydrogen evolution peak (indicated by a red arrow in ), whereas the absence of this peak in RGO with typical rectangular curve indicates good charge propagation with electrodes and ideal capacitive behavior.Citation54,Citation72
Previous reports demonstrated that graphene exhibited significant biocompatibility towards numerous cells such as L929 mouse fibroblast cells and A549 human lung cancer cells, and it possessed toxicity only towards a few specific cells.Citation47,Citation73 The variation in the cytotoxicity profile is suggested to be mainly due to the difference in the synthesis methods (graphene reduced from GO prepared by modified Hummers method versus graphene from heat treatment of graphite or from unzipping of CNTs).Citation74,Citation75 Hence, for comparison in parallel with GO, the synthesized RGO was subjected to cytotoxicity analysis on two cancer cells (ie, colon [HT-29] and brain [U87MG] cancer cells) to determine the presence of specific cancer type selectivity, as well as on normal cells (MRC-5) to ascertain whether the synthesized graphene material is suitable, especially for anticancer drug-delivery purposes without causing damage to the normal cells.
Based on the fact that viable cells incorporate and bind more dye as compared to damaged or dead cells,Citation76 the dose-dependent cytotoxicity of GO and RGO can be determined by neutral red uptake assay. Untreated cells were calculated as having a cell viability of 100%. Both GO and RGO showed no significant toxicity towards HT-29 cells as shown in . Over 90% cell confluence was observed at the highest concentration (50 μg/mL), even for GO. This is, however, in accordance with previous findings,Citation77 where more than 87% HT-29 cell viability was observed for graphene. A similar finding was also observed for other types of cancer cells such as HeLa cancer cells,Citation78 where cell viability of 90% was observed for GO at 40 μg/mL. Miao et alCitation79 also observed about 87% cell viability of GO towards SCC7 cells.
Figure 9 Effect of GO and RGO on cell viability of cancer and normal cells.
Notes: The cell viability (%) on (A) HT-29, (B) U87MG, and (C) MRC-5 cells, and (D) overall IC50 values of GO and RGO treatments for 48 hours generated by neutral red uptake assay. Bars represent mean ± standard error of the mean of triplicates in three independent experiments (n=9). *Significant difference when treated groups were compared with untreated (P<0.001) using one-way ANOVA with Dunnett’s t-test. # and ##indicate significant difference when GO was compared to RGO, with P<0.5 and P<0.01, respectively, using two-way ANOVA with Bonferroni t-test.
Abbreviations: ANOVA, analysis of variance; GO, graphene oxide; IC50, half maximal inhibitory concentration; RGO, reduced graphene oxide.
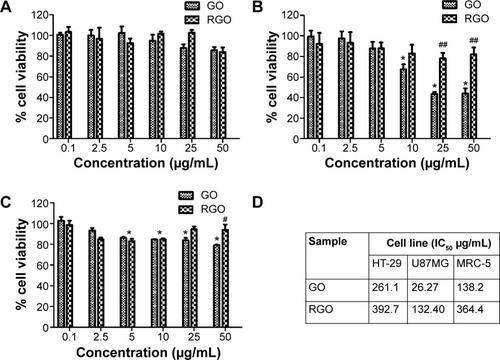
However, a different cytotoxicity pattern was seen in U87MG cells as shown in . A decrease in cell viability was observed for GO starting from 10 μg/mL when compared to untreated cells. GO has been largely reported to cause plasma membrane damage and oxidative stress, and thus antiproliferative distress to the cells.Citation80 On the other hand, RGO was found to be biocompatible with almost 100% cell confluence even at the highest concentration (50 μg/mL). By comparing GO with RGO, a significant difference in cell viability was observed starting from the concentration of 25 μg/mL (P<0.01). A previous study by Jaworski et alCitation81 showed that graphene demonstrated cytotoxicity toward U87MG cells, even at a lower concentration of 20 μg/mL. At 100 μg/mL, they observed only 54% cell survival, whereas the RGO obtained through our strategy is exceedingly biocompatible towards brain cancer cells as compared to other reported graphene derivatives.
GO () showed obvious toxicity towards MRC-5 as compared to the untreated cells, even from concentrations as low as 5 μg/mL. A previous investigation by Wang et alCitation82 supports this observation, where GO was found to induce cytotoxicity, genotoxicity, and oxidative stress to MRC-5 cells. In contrast, RGO showed no cytotoxicity towards normal cell lines with the cell viability above 90%, even at 50 μg/mL. Similar findings were observed only on functionalized graphenes such as carboxyl-modified graphene, where the cell viability was about 100% when tested against normal Vero cells.Citation74 It was reported that pluronic-modified graphene was also observed to be similar due to the formation of stable graphene dispersion.Citation83 This roughly proves that covalent or noncovalent functionalization was necessary in order to create a stable and nontoxic graphene.
Graphpad Prism software was used to estimate the half maximal inhibitory concentration (IC50) values of GO and RGO as shown in . GO was found to be toxic, especially towards U87MG cells, with IC50 at a very low concentration of 26.27 μg/mL. As discussed earlier, this was due to the presence of oxygen functional groups in GO, which consequently lead to oxidative stress in cells and result in poor cell survival.Citation80 RGO showed better cell survival compared to GO for all the three cells, with IC50 values beyond 50 μg/mL and up to 390 μg/mL. Since the cell viability assay was conducted only up to a concentration of 50 μg/mL, the concentration values in only serve as an estimation generated by the software. Nevertheless, based on the current findings, our mushroom synthesized RGO, without the need of any functionalization, shows good aqueous stability and is equally biocompatible compared to the functionalized ones. Although our RGO does not possess any selectivity against the two cancer cells and normal cells tested, this feature is still of great value for the synthesized RGO to be a tool for protein/gene transfection, as well as a drug-delivery vehicle for cancer treatment, such as by conjugation of an anticancer drug.
Conclusion
An over the counter, commercial-grade mushroom powder was used to effectively reduce GO to RGO with a reaction time of just 1 hour. This environmentally friendly method avoids the use of chemicals and significantly reduces waste, with the advantage of reusability of the extract as a reducing agent. The obtained RGO was readily dispersible in water and was reasonably small, with a thickness of 1–2 nm and a 181–500 nm lateral dimension. The RGO obtained through this strategy is small as compared to other reported green-synthesis methods. In addition, solubility tests using various solvents showed that RGO is stable up to a tested period of 1 year. The employed synthetic route also did not affect its electrical conductivity. While functionalization of graphene is imperative to reduce its cytotoxicity, the current mushroom-extract-reduced RGO was found to be biocompatible even without any additional functionalization. RGO has not shown any antiproliferative effects towards colon and brain cancer or towards normal cell lines. However, substantial work remains in elucidating this exceedingly good biocompatibility, especially in exploring RGO’s intracellular event. The large availability of this mushroom in Asian countries, coupled with ease of preparation, makes this synthetic route lucrative for upscale production. Since there are no toxic chemicals involved or byproducts generated, and it is highly biocompatible towards cells, the produced RGO is suitable for biomedical applications especially in drug-delivery systems, bioimaging, and in biosensing.
Acknowledgments
The authors would like to thank Ministry of Higher Education (MOHE), Malaysia for the funding support through FRGS grant (F0018.5402) and the High Impact Research Grant (UM.C/625/1/HIR/MOHE/05).
Disclosure
The authors report no conflicts of interest in this work.
References
- KuilaTBoseSMishraAKKhanraPKimNHLeeJHChemical functionalization of graphene and its applicationsProg Mater Sci201257710611105
- SinghVJoungDZhaiLDasSKhondakerSISealSGraphene based materials: Past, present and futureProg Mater Sci201156811781271
- LiuKZhangJJChengFFZhengTTWangCZhuJJGreen and facile synthesis of highly biocompatible graphene nanosheets and its application for cellular imaging and drug deliveryJ Mater Chem2011211203412040
- AnJGouYYangCHuFWangCSynthesis of a biocompatible gelatin functionalized graphene nanosheets and its application for drug deliveryMater Sci Eng C Mater Biol Appl20133352827283723623103
- XuLQWangLZhangBFunctionalization of reduced graphene oxide nanosheets via stacking interactions with the fluorescent and water-soluble perylene bisimide-containing polymersPolymer2011521123762383
- NovoselovKSGeimAKMorozovSVElectric field effect in atomically thin carbon filmsScience2004306569666666915499015
- BergerCSongZLiTUltrathin epitaxial graphite: 2D electron gas properties and a route toward graphene-based nanoelectronicsJ Phys Chem B2004108521991219916
- LeeSLeeKZhongZWafer scale homogeneous bilayer graphene films by chemical vapor depositionNano Lett201010114702470720932046
- KosynkinDVHigginbothamALSinitskiiALomedaJRDimievAPriceBKLongitudinal unzipping of carbon nanotubes to form graphene nanoribbonsNature2009458724087287619370030
- StankovichSDikinDAPinerRDSynthesis of graphene-based nanosheets via chemical reduction of exfoliated graphite oxideCarbon200745715581565
- ZhuPShenMXiaoSZhangDExperimental study on the reducibility of graphene oxide by hydrazine hydratePhysica B Condens Matter20114063498502
- GurunathanSHanJWEppakayalaVKimJHMicrobial reduction of graphene oxide by Escherichia coli: a green chemistry approachColloids Surf B Biointerfaces201310277277723107955
- FurstABerloRCHootonSHydrazine as a reducing agent for organic compounds (catalytic hydrazine reductions)Chem Rev19656515168
- TungVCAllenMJYangYKanerRBHigh-throughput solution processing of large-scale grapheneNat Nanotechnol200941252919119278
- Fernández-MerinoMJGuardiaLParedesJIVitamin C is an ideal substitute for hydrazine in the reduction of graphene oxide suspensionsJ Phys Chem C20101141464266432
- WangGYangJParkJFacile synthesis and characterization of graphene nanosheetsJ Phys Chem C20081122281928195
- PereraSDMarianoRGNijemNChabalYFerrarisJPBalkusKJJrAlkaline deoxygenated graphene oxide for supercapacitor applications: An effective green alternative for chemically reduced grapheneJ Power Sources2012215110
- ParkJHMitchelWCSmithHEGrazulisLEyinkKGStudies of interfacial layers between 4H-SiC (0 0 0 1) and grapheneCarbon201048516701673
- FanZJKaiWYanJFacile synthesis of graphene nanosheets via Fe reduction of exfoliated graphite oxideACS Nano20115119119821230006
- ZhangJYangHShenGChengPZhangJGuoSReduction of graphene oxide via L-ascorbic acidChem Commun (Camb)20104671112111420126730
- LiuZRobinsonJTSunXDaiHPEGylated nanographene oxide for delivery of water-insoluble cancer drugsJ Am Chem Soc200813033108761087718661992
- ZhuCGuoSFangYDongSReducing sugar: new functional molecules for the green synthesis of graphene nanosheetsACS Nano2010442429243720359169
- LiuJFuSYuanBLiYDengZToward a universal “adhesive nanosheet” for the assembly of multiple nanoparticles based on a protein-induced reduction/decoration of graphene oxideJ Am Chem Soc2010132217279728120462190
- WangYShiZYinJFacile synthesis of soluble graphene via a green reduction of graphene oxide in tea solution and its biocompositesACS Appl Mater Interfaces2011341127113321438576
- AkhavanOKalaeeMAlaviZSGhiasiSMAEsfandiarAIncreasing the antioxidant activity of green tea polyphenols in the presence of iron for the reduction of graphene oxideCarbon201250830153025
- KimYKKimMHMinDHBiocompatible reduced graphene oxide prepared by using dextran as a multifunctional reducing agentChem Commun20114731953197
- SalasECSunZLüttgeATourJMReduction of graphene oxide via bacterial respirationACS Nano2010484852485620731460
- ChenTPanLYuKSunZMicrowave-assisted synthesis of reduced graphene oxide-carbon nanotube composites as negative electrode materials for lithium ion batteriesSolid State Ionics2012229913
- PatersonRRGanoderma – a therapeutic fungal biofactoryPhytochemistry200667181985200116905165
- SaltarelliRCeccaroliPIottiMBiochemical characterisation and antioxidant activity of mycelium of Ganoderma lucidum from Central ItalyFood Chem20091161143151
- KozarskiMKlausANikšićMAntioxidative activities and chemical characterization of polysaccharide extracts from the widely used mushrooms Ganoderma applanatum, Ganoderma lucidum, Lentinus edodes and Trametes versicolorJ Food Compost Anal2012261–2144153
- ShiMZhangZYangYAntioxidant and immunoregulatory activity of Ganoderma lucidum polysaccharide (GLP)Carbohydr Polym201395120020623618260
- KozarskiMKlausANiksicMJakovljevicDHelsperJPFGVan GriensvenLJLDAntioxidative and immunomodulating activities of polysaccharide extracts of the medicinal mushrooms Agaricus bisporus, Agaricus brasiliensis, Ganoderma lucidum and Phellinus linteusFood Chem2011129416671675
- WuDTXieJHuDJZhaoJLiSPCharacterizations of polysaccharides from Ganoderma spp. using saccharide mappingCarbohydr Polym201397239840523911463
- NieSZhengHLiWXieMCurrent development of polysaccharides from Ganoderma: isolation, structure and bioactivitiesBioactive Carbohydrates and Dietary Fibre2013111020
- ZhaoLDongYChenGHuQExtraction, purification, characterization and antitumor activity of polysaccharides from Ganoderma lucidumCarbohydr Polym2010803783789
- ChenYXieMYNieSPLiCWangYXPurification, composition analysis and antioxidant activity of a polysaccharide from the fruiting bodies of Ganoderma atrumFood Chem20081071231241
- GurunathanSHanJParkJHKimJHAn in vitro evaluation of graphene oxide reduced by Ganoderma spp. in human breast cancer cells (MDA-MB-231)Int J Nanomedicine201491783179724741313
- HuangNMLimHNChiaCHYarmoMAMuhamadMRSimple room-temperature preparation of high-yield large-area graphene oxideInt J Nanomedicine201163443344822267928
- DuBoisMGillesKAHamiltonJKRebersPASmithFColorimetric method for determination of sugars and related substancesAnal Chem1956283350356
- LimSWTingKNBradshawTDAcalypha wilkesiana extracts induce apoptosis by causing single strand and double strand DNA breaksJ Ethnopharmacol2011138261662322008878
- LimSWLohHSTingKNBradshawTDZeenathulNAAcalypha wilkesiana ethyl acetate extract enhances the in vitro cytotoxic effects of α-tocopherol in human brain and lung cancer cellsInt J Biosci Biochem Bioinforma201334335340
- HanYLuoZYuwenLTianJZhuXWangLSynthesis of silver nanoparticles on reduced graphene oxide under microwave irradiation with starch as an ideal reductant and stabilizerAppl Surf Sci2013266188193
- ZhouYBaoQTangLALZhongYLohKPHydrothermal dehydration for the “green” reduction of exfoliated graphene oxide to graphene and demonstration of tunable optical limiting propertiesChem Mater2009211329502956
- McAllisterMJLiJLAdamsonDHSingle sheet functionalized graphene by oxidation and thermal expansion of graphiteChem Mater2007191843964404
- HuangSQLiJWWangZPanHXChenJXNingZXOptimization of alkaline extraction of polysaccharides from Ganoderma lucidum and their effect on immune function in miceMolecules20101553694370820657508
- WojtoniszakMChenXKalenczukRJSynthesis, dispersion, and cytocompatibility of graphene oxide and reduced graphene oxideColloids Surf B Biointerfaces201289798521962852
- AcikMLeeGMatteviCChhowallaMChoKChabalYJUnusual infrared-absorption mechanism in thermally reduced graphene oxideNat Mater201091084084520852618
- SiYSamulskiETSynthesis of water soluble grapheneNano Lett2008861679168218498200
- WangXChenXQiZLiuXLiWWangSA study of Ganoderma lucidum spores by FTIR microspectroscopySpectrochim Acta A Mol Biomol Spectrosc20129128528922381804
- ChenXLiuXShengDHuangDLiWWangXDisctinction of broken cellular wall Ganoderma lucidum spores and G. lucidum spores using FTIR microspectroscopySpectrochim Acta A Mol Biomol Spectrosc20129766767222885115
- GurunathanSHanJWDayemAAAntibacterial activity of dithiothreitol reduced graphene oxideJournal of Industrial and Engineering Chemistry201319412801288
- ZhangHBZhengWGYanQElectrically conductive polyethylene terephthalate/graphene nanocomposites prepared by melt compoundingPolymer201051511911196
- JinYHuangSZhangMJiaMHuDA green and efficient method to produce graphene for electrochemical capacitors from graphene oxide using sodium carbonate as a reducing agentAppl Surf Sci2013268541546
- LiuPHuangYWangLA facile synthesis of reduced graphene oxide with Zn powder under acidic conditionMater Lett201391125128
- LimHNHuangNMLooCHFacile preparation of graphene-based chitosan films: Enhanced thermal, mechanical and antibacterial propertiesJ Non Cryst Solids20123583525530
- SiWWuXZhouJReduced graphene oxide aerogel with high-rate supercapacitive performance in aqueous electrolytesNanoscale Res Lett20138124723692674
- ZhangWHeWJingXPreparation of a stable graphene dispersion with high concentration by ultrasoundJ Phys Chem B201011432103681037320701371
- LotyaMHernandezYKingPJLiquid phase production of graphene by exfoliation of graphite in surfactant/water solutionsJ Am Chem Soc2009131103611362019227978
- DreyerDRParkSBielawskiCWRuoffRSThe chemistry of graphene oxideChem Soc Rev20103922824020023850
- SchnieppHCLiJLMcAllisterMJFunctionalized single graphene sheets derived from splitting graphite oxideJ Phys Chem B2006110178535853916640401
- WangGWangBParkJWangYSunBYaoJHighly efficient and large-scale synthesis of graphene by electrolytic exfoliationCarbon2009471432423246
- KudinKNOzbasBSchnieppHCPrud’hommeRKAksayIACarRRaman spectra of graphite oxide and functionalized graphene sheetsNano Lett200881364118154315
- ShenJLiTShiMLiNYeMPolyelectrolyte-assisted one-step hydrothermal synthesis of Ag-reduced graphene oxide composite and its antibacterials propertiesMaterials Science and Engineering: C201232720422047
- AlanyalıoğluMSeguraJJOró-SolèJCasañ-PastorNThe synthesis of graphene sheets with controlled thickness and order using surfactant-assisted electrochemical processesCarbon2012501142152
- WangFZhangKReduced graphene oxide–TiO2 nanocomposite with high photocatalystic activity for the degradation of rhodamine BJ Mol Catal A Chem20113451–2101107
- FerrariACMeyerJCScardaciVRaman spectrum of graphene and graphene layersPhys Rev Lett2006971818740117155573
- LiDMüllerMBGiljeSKanerRBWallaceGGProcessable aqueous dispersions of graphene nanosheetsNat Nanotechnol20083210110518654470
- StankovichSDikinDADommettGHGraphene-based composite materialsNature2006442710028228616855586
- LiuSZengTHHofmannMBurcombeEWeiJJiangRRAntibacterial activity of graphite, graphite oxide, graphene oxide, and reduced graphene oxide: membrane and oxidative stressACS Nano2011596971698021851105
- ComptonOCAnZPutzKWAdditive-free hydrogelation of graphene oxide by ultrasonicationCarbon2012501033993406
- YanJFanZWeiTQianWZhangMWeiFFast and reversible surface redox reaction of graphene–MnO2 composites as supercapacitor electrodesCarbon2010481338253833
- ChangYYangSTLiuJHIn vitro toxicity evaluation of graphene oxide on A549 cellsToxicology Lett20112003201210
- SasidharanAPanchakarlaLSChandranPMenonDNairSRaoCNDifferential nano-bio interactions and toxicity effects of pristine versus functionalized grapheneNanoscale2011362461246421562671
- Mullick ChowdhurySLalwaniGZhangKYangJYNevilleKSitharamanBCell specific cytotoxicity and uptake of graphene nanoribbonsBiomaterials201334128329323072942
- RepettoGdel PesoAZuritaJLNeutral red uptake assay for the estimation of cell viability/cytotoxicityNat Protoc2008371125113118600217
- AbdolahadMJanmalekiMMohajerzadehSAkhavanOAbbasiSPolyphenols attached graphene nanosheets for high efficiency NIR mediated photodestruction of cancer cellsMater Sci Eng C Mater Biol Appl20133331498150523827601
- PengCHuWZhouYFanCHuangQIntracellular imaging with a graphene-based fluorescent probeSmall20106151686169220602429
- MiaoWShimGLeeSLeeSChoeYSOhYKSafety and tumor tissue accumulation of pegylated graphene oxide nanosheets for co-delivery of anticancer drug and photosensitizerBiomaterials201334133402341023380350
- GuoXMeiNAssessment of the toxic potential of graphene family nanomaterialsJ Food Drug Anal20142210511524673908
- JaworskiSSawoszEGrodzikMIn vitro evaluation of the ffects of graphene platelets on glioblastoma multiforme cellsInt J Nanomedicine2013841342023378763
- WangAXPuKDongBRole of surface charge and oxidative stress in cytotoxicity and genotoxicity of graphene oxide towards human lung fibroblast cellsJ Appl Toxicol201333101156116423775274
- DuchMCBudingerGRSLiangYTSoberanesSUrichDChiarellaSEMinimizing oxidation and stable nanoscale dispersion improves the biocompatibility of graphene in the lungNano Lett201111125201520722023654