
Abstract
New nanomaterials intended for systemic administration have raised concerns regarding their biocompatibility and hemocompatibility. Quantum dots (QD) nanoparticles have been used for diagnostics, and recent work suggests their use for in vivo molecular and cellular imaging. However, the hemocompatibility of QDs and their constituent components has not been fully elucidated. In the present study, comprehensive investigation of QD–platelet interactions is presented. These interactions were shown using transmission electron microscopy. The effects of QDs on platelet function were investigated using light aggregometry, quartz crystal microbalance with dissipation, flow cytometry, and gelatin zymography. Platelet morphology was also analyzed by phase-contrast, immunofluorescence, atomic-force and transmission electron microscopy. We show that the QDs bind to platelet plasma membrane with the resultant upregulation of glycoprotein IIb/IIIa and P-selectin receptors, and release of matrix metalloproteinase-2. These findings unravel for the first time the mechanism of functional response of platelets to ultrasmall QDs in vitro.
Introduction
Nanomedicine pursues the use of nanoparticles (NPs) in advancement of both diagnostic and therapeutic agents.Citation1 Semiconductor quantum dots (QDs), an important class of emerging nanomaterial in the nanotechnology toolbox, are widely anticipated to find application in many consumer and clinical products in the near future.Citation2 The diverse potential applications of QDs are attributed to their unique optoelectronic properties such as size-tunable narrow emission spectra, high quantum yields, broad-range excitation, and high photostability.Citation3 QDs are being developed for a variety of biologically oriented applications, including immunoassays, biomedical imaging, drug delivery, and photodynamic therapy.Citation4 However, for biological applications, QDs must be surface passivated with other materials allowing dispersion and preventing leakage of toxic heavy metals.Citation5 Studies have shown that both negatively and positively charged QDs can be endocytosed,Citation6 and there is evidence that QDs exploit the cell’s active-transport machineries for cytoplasmic and intranuclear delivery.Citation7
The major routes of human exposure to NP are transcutaneous, oral (enteric), or parenteral. Systemic delivery of NP-based therapeutic or diagnostic agents implies the interactions of NP with constituents of blood. Platelets are anucleate megakaryocyte-derived cell elements measuring 1.5–3.0 microns and constitute one of the major components of the hemostatic system besides plasma and endothelial cells. Platelets conserve asymmetric orientation of membrane phospholipids like all eukaryotic cells. Platelet activation leads to rapid disruption of this asymmetry leading to calcium-dependent exposure of anionic phospholipids at the outer platelet surface.Citation8 Platelets possess a negative surface charge, and a decrease in negative charge leads to increased platelet reactivity.Citation9 Platelets are highly granulated discoid blood elements that circulate in a quiescent state until activation. Upon activation, platelets undergo shape change, leading to pseudopodia formation and the release of platelet-dense and alpha-granule content.Citation10 The vascular damage and endothelial denudation leads to platelet adhesion to subendothelial proteins such as collagen and von Willebrand factor. Platelet adhesion receptors, including glycoprotein (GP) Ib, are involved in these interactions. The platelet–platelet interactions and aggregation are mediated through various GP receptors, in particular GPIIb/IIIa, leading to a cascade of events resulting in a hemostatic plug.Citation11 GPIIb/IIIa plays a central role in primary hemostasis by establishing platelet aggregates using fibrinogen as a bridging molecule.Citation12,Citation13
P-selectin is yet another important receptor involved in platelet function. P-selectin constitutively resides in platelet alpha granules and is translocated to the platelet surface upon aggregation. This translocation ensures platelet–leukocyte interactions. Therefore, both GPIIb/IIIa and P-selectin represent platelet activation markers.Citation14 Activated platelets also release a proaggregatory gelatinase matrix metalloproteinase (MMP)-2 that is translocated to the platelet surface from the cytoplasm upon activation.Citation15 Its molecular effects involve upregulation of GPIIb/IIIa and GPIb/V/IX receptors.Citation16 Although platelets serve an important role in the control of physiological hemostasis, they also participate in pathological thrombosis, which is associated with vascular diseases such as myocardial infarction and stroke.Citation17
The pharmacological responses of platelets to NPs such as Ag,Citation18 Au,Citation19 SiO2,Citation20 carbon,Citation21 QDs,Citation22 diesel particles,Citation23 particulate matter,Citation24 and cetyl alcohol/polysorbate NPsCitation25 have been studied. However, to date molecular mechanisms involved in the interactions between platelet and QDs have not been systematically investigated. Therefore, we have studied the effects of negatively and positively charged cadmium–telluride QDs (CdTe QDs) on human platelet function in the presence or absence of plasma. We have found that QDs have the ability to stimulate platelet aggregation in both no-flow and underflow conditions.
Materials and methods
Chemicals and materials
CdTe QDs with a negative or positive surface charge were synthesized and characterized at the School of Chemistry, Trinity College Dublin as reported previously.Citation26 Thioglycolic acid provides a negative surface charge, and cysteamine provides a positive surface charge to the QDs. Hereinafter, they are referred to as “negatively” and “positively” charged CdTe QDs. A UV-1601 UV-Visible Spectrophotometer (Shimadzu Corporation, Kyoto, Japan) was used to measure QDs’ absorption. The concentration of particles was determined using Beer’s law and the Brus equation. A Varian Cary Eclipse Fluorescence Spectrophotometer (Agilent Technologies, Santa Clara, CA, USA) was used to determine the fluorescence emission/photoluminescence spectra of QDs. The excitation wavelength was 480 nm and the emission was detected in the 490–700 nm range. The quantum yields were calculated from the photoluminescence spectra using Rhodamine 6G as a reference. Zeta potential of NPs was measured on a Malvern Zetasizer (V5.10) (Malvern Instruments, Malvern, UK). The concentration of samples used for these measurements was typically corresponding to absorbance ~0.2 in the plasmon band. Three measurements were taken for each sample, by collecting 10–20 acquired data points for each measurement. QD characteristics are presented in .
Table 1 Physicochemical characteristics of CdTe QDs used in the experiments
All reagents were from Sigma-Aldrich (Dublin, Ireland) unless otherwise indicated. Collagen was from Chrono-log (Labmedics [UK] LLP, Abingdon on Thames, UK). Alexa Fluor (AF)®546-phalloidin and AF®488-phalloidin were from Molecular probes (Thermo Fisher Scientific, Waltham, MA, USA). P-selectin and PAC1 (activated GPIIb/IIIa) antibodies were from BD Biosciences (BD Biosciences, Oxford, UK). Aqueous mounting medium was from DakoCytomation (Glostrup, Denmark). All plasticware was from Nunc (Thermo Fisher Scientific).
Blood preparation
Blood was collected using trisodium citrate (3.15%, 9:1 v/v) from healthy volunteers who had not taken any drugs known to affect platelet function for 14 days prior to the study. Platelet rich plasma (PRP) was obtained by centrifugation at 240× g for 20 minutes at room temperature. Washed platelets (WPs) were isolated in the presence of prostacyclin as described before.Citation27 Platelets were counted using a Coulter counter (Beckman Coulter Inc. Brea, CA, USA). Afterwards, the final platelet number (2.5×10⁸ platelets per mL) in PRP/WP was adjusted using Tyrode’s solution.Citation27 The study was approved by the Research Ethics Committee (Faculty of Health Sciences, Trinity College Dublin).
Light transmission aggregometry
Aggregation was measured using a four-channel Chrono-log whole blood Lumi-Aggregometer (Chrono-log Corporation, Havertown, PA, USA) linked to Aggro-link data-reduction systems.Citation21 PRP and WP samples were incubated in the presence or absence of negatively or positively charged CdTe QDs (0.1–5.0 μM) and aggregation was monitored for 20 minutes. Nonaggregated (resting) or collagen-aggregated (10 μg/mL) PRP/WP samples were taken as negative and positive controls, respectively. The results were expressed as percentage of light transmission, where 100% transmission (platelet-poor plasma [PPP] or Tyrode’s solution) were taken as maximal aggregation.
Flow cytometry
Flow cytometry was used to analyze the expression of receptors on the surface of platelets as an index of aggregation. PRP and WPs were treated with negatively charged 2.6 nm or 4.8 nm CdTe QDs in the aggregometer. PRP samples were treated with 3 μM CdTe QDs, and WP samples were analyzed at concentrations ranging from 0.1–5.0 μM CdTe QDs. Resting and collagen-aggregated platelets were taken as negative and positive controls, respectively; 10 μL of samples were taken from the cuvettes when collagen-induced platelet aggregation reached 50% as positive control. The samples were then incubated in equal volume of P-selectin antibody (CD62P-APC [allophycocyanin] from BD Biosciences) in the dark for 5 minutes at room temperature. Following incubation, samples were diluted in FACSFlow™ sheath fluid (BD Biosciences) and analyzed within 5 minutes using BD FACSArray (BD Biosciences). Samples were excited with 635 nm and the instrument was set up to measure the size (forward scatter), granularity (side scatter), and cell fluorescence. Antibody binding was measured by analyzing activated platelets for fluorescence.
Zymography
Samples of WPs were treated with negatively or positively charged CdTe QDs (1–5 μM) in the aggregometer. Afterwards, platelets were pelleted by centrifugation (1,400× g for 5 minutes, at room temperature) in the presence of prostacyclin (1 μΜ) and the supernatant stored at −80°C until assayed. Conditioned medium from phorbol 12-myristate 13-acetate (100 nM)-stimulated human fibrosarcoma HT1080 cells was used as gelatinase standard. Resting and collagen-aggregated platelets were also pelleted and the supernatant thus obtained taken as negative and positive controls, respectively. The activity of MMP-2 was measured by zymography as described previously.Citation21 Briefly, platelet supernatants were subjected to 8% sodium dodecyl sulphate–polyacrylamide gel electrophoresis in which the separating gels were copolymerized with 2 mg/mL gelatin. Gels were washed with 2.5% Triton X-100 to remove sodium dodecyl sulphate and then incubated in incubation buffer (0.15 M NaCl, 5 mM CaCl2, 0.05% NaN3, and 50 mM TRIS-HCl buffer, pH 7.5) for 5 days. After incubation, the gels were stained with 0.05% Coomassie brilliant blue and destained in destaining solution (methanol 10%, acetic acid 10%, and distilled water 80%). The gelatinolytic activities were detected as transparent bands against the background of Coomassie blue-stained gel under ultraviolet light and quantified using ChemiDoc MP Imaging System (Bio-Rad Life Sciences, Hercules, CA, USA). MMP-2 was identified by its molecular weight when compared to standards.
Quartz crystal microbalance with dissipation
Quartz crystal microbalance with dissipation (QCM-D; Q-Sense™ E4 system, Q-Sense AB, Goteborg, Sweden) was used to measure changes in frequency and energy dissipation of quartz crystals in response to adhesion of platelets under flow conditions.Citation28 For the study of platelet aggregation, polystyrene-coated quartz crystals (5 MHz) were used as sensors following coating with fibrinogen. For fibrinogen coating, sensors were placed in fibrinogen dissolved in phosphate-buffered saline (PBS) (100 μg/mL) for 1 hour at room temperature. Samples of PRP (2.5×10⁸ platelets per mL) or PPP were perfused in the presence or absence of negatively charged 2.6 nm CdTe QDs at 37°C and at a flow rate of 100 μL/minute for 30 minutes. Changes in frequency and dissipation were recorded in real time using Q-Sense software (QSoft401, Q-Sense AB). The sensors were then subjected to microscopic analysis (phase contrast, fluorescent and atomic force microscopy).
Phase-contrast microscopy
The morphology of platelet aggregates adherent on quartz crystals were studied using Zeiss microscope (Axiovert 200M; Carl Zeiss, Cambridge, UK).Citation29 Briefly, untreated PRP or negatively charged 2.6 nm CdTe QD-treated PRP suspensions were perfused on fibrinogen-coated polystyrene-coated quartz crystals for 30 minutes through QCM-D. The crystals were then subjected to phase-contrast microscopy examination using a 20x objective. Photomicrographs were captured and analyzed by using Zeiss microscope system and software (Axiovision 4.7; Carl Zeiss Meditec AG).
Fluorescent microscopy and immunostaining
Fluorescent microscopy was used to visualize both QDs and platelet activation markers. For this study, negatively charged 2.6 nm or 4.8 nm CdTe QD-induced WP aggregates were used at 50% aggregation. Following centrifugation, pellets were washed with PBS and then treated with either P-selectin or PAC-1 (recognizing activated GPIIb/IIIa receptor) antibodies conjugated with fluorescein isothiocyanate or allophycocyanin for 30 minutes at room temperature in the dark. The pellets were then fixed with 2% paraformaldehyde for 30 minutes at room temperature, stained with AF®546 phalloidin actin (red) (1:200 dilution) for 1 hour at room temperature, and allowed to air dry on a glass slide. Samples were then covered with a cover slip using mounting medium. For the study of resting platelets, platelets were treated with antibodies in suspension and mounted on a glass slide afterwards. Since QDs are fluorescent, the actin cytoskeleton was not stained in QD-induced platelet aggregates. In both cases, confocal images were taken using a 63× oil immersion objective, with a numerical aperture of 1.4, on a Zeiss LSM 510 Meta system (Carl Zeiss Meditec AG). The samples were visualized using 488 nm and 561 nm excitation filters and emission filters with band-passes of 505–550 nm and >575 nm, respectively.
Atomic-force microscopy
Atomic-force microscopy (AFM) of QCM-D crystal substrates enables mapping of different platelet responsesCitation29 in the presence or absence of QDs. For this study, untreated or 2.6 nm CdTe QD-treated PRP was perfused through the QCM-D device for 30 minutes. The crystals with adhered platelets were then retrieved and fixed with prewarmed 2.5% gluteraldehyde for 30 minutes at 37°C. Platelets were subsequently dehydrated through ascending grades of ethanol (from 60% up to 100%), and crystals were mounted onto glass slides with platelets facing upwards. The crystal-on-slide was mounted onto the microscope and images were taken using an Ntegra Spectra (NT-MDT, Moscow, Russia) AFM/Raman system. Imaging was carried out in dry-phase, semicontact AFM with a silicon–nitride tip (NSG10, “Golden” Silicon Probes; NT-MDT). The resonance frequency of the tip was found to be 280 KHz. Height AFM images were taken around the central area of the crystal, at 0.55 Hz. Image analysis was carried out on the height images using the NT-MDT-NOVA software (NT-MDT).
Transmission electron microscopy
Samples of WPs were treated with negatively charged 2.6 nm or 4.8 nm CdTe QDs in the aggregometer. The aggregatory reaction was stopped with prewarmed 2.5% glutaraldehyde when platelets reached 20% aggregation and left for 30 minutes at 37°C. Untreated (resting) platelets and collagen-treated platelets were taken as controls. Following centrifugation, platelet pellets were washed with PBS and further processed for transmission electron microscopy (TEM) imaging. Briefly, samples were post fixed for 1 hour in 1% osmium tetroxide in deionized water. After dehydration in increasing concentrations of EtOH (from 70% up to 100%), the samples were immersed in an ethanol/Epon (1:1 vol/vol) mixture for 1 hour before being transferred to pure Epon and embedded at 37°C for 2 hours. The final polymerization was carried out at 60°C for 24 hours. Ultrathin sections, obtained with a diamond knife using a Leica U6 ultramicrotome, were mounted on 300-mesh Cu grids and stained with uranyl acetate before being examined with a TEM microscope.
Statistical analysis
Light aggregometry results were expressed as a percentage of maximal aggregation. QCM-D results were expressed as a percentage of frequency and dissipation from the third overtone, where the maximal changes in frequency and dissipation at 30 minutes of perfusion for the control (2.5×10⁸ platelets per mL) were considered as 100% for each donor. At least three independent experiments were analyzed using GraphPad Prism (GraphPad Software, Inc., La Jolla, CA, USA). One-way analysis of variance and Dunnett’s or Tukey–Kramer’s or Bonferroni multiple comparisons posttest were performed where appropriate. Results were statistically significant at P<0.05. All data points represent mean values ± standard error of the mean.
Results
QDs aggregate human platelets in the absence of plasma
Using light transmission aggregometry (LTA),Citation30 we found that both positively charged 2.8 nm and negatively charged 2.6 nm or 4.8 nm QDs () did not cause significant activation of platelets in PRP. By contrast, a significant increase in aggregation was observed when WPs were treated with 0.1 μM, 1 μM, 3 μM, and 5 μM of positively charged QDs () or 1 μM, 3 μM, and 5 μM of negatively charged QDs (). The results demonstrate that the QDs induce activation of platelets in the absence of plasma. Since maximum platelet aggregation was observed at the 3 μM concentration, this concentration was used for further experiments unless otherwise specified.
Figure 1 Light transmission aggregometry measurement of interactions between CdTe QDs and platelets and flow-cytometry measurement of P-selectin expression.
Notes: PRP (A, C) or WP (B, D) were treated with positively charged (2.8 nm) or negatively charged (2.6 nm or 4.8 nm) CdTe QDs in the optical aggregometer. Similarly, P-selectin expression with PRP (E) or WP (F) was measured with and without treatment with CdTe QDs. Positive control (control/collagen) was collagen-treated (10 mg/mL) platelets and negative control (PRP/WP/resting) was untreated platelets. Data are mean ± SEM of five independent experiments. *P<0.05; **P<0.01; ***P<0.001 as compared with PRP/WP/resting (analysis of variance with Dunnett’s).
Abbreviations: CdTe, cadmium–telluride; flU, fluorescence unit; QD, quantum dot; PRP, platelet-rich plasma; SEM, standard error of the mean; WP, washed platelets.

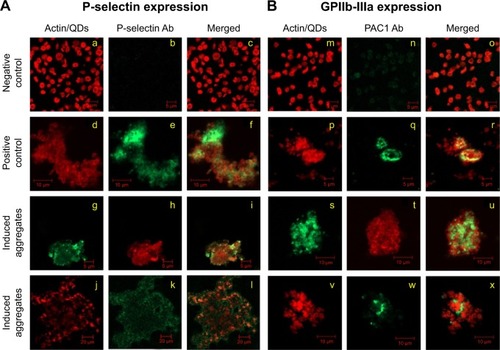
QDs upregulate surface expression of P-selectin and GPIIb/IIIa receptors
Platelet activation is associated with the surface translocation of P-selectin and activation of GPIIb/IIIa receptors. Therefore, we used flow cytometry and confocal microscopy to study the surface expression of these receptors on QD-treated platelets both in PRP and WP. The flow cytometry results are shown in . Treatment of PRP samples 1) with 3 μM QDs did not show significant increase in P-selectin expression compared to untreated platelets. However, samples of WP 2) showed a significant increase in P-selectin expression when treated with 1 μM and 3 μM QDs. The confocal images (maximal projection) demonstrating the expressions of P-selectin and activated GPIIb/IIIa receptors are shown in , respectively. Resting platelets did not express P-selectin receptors (). Minimal expression of activated GPIIb/IIIa receptors () was observed under the same conditions. Confocal images (maximal projection) demonstrate that collagen (), and both 2.6 nm () and 4.8 nm () CdTe QD-induced platelet aggregates showed surface expression of P-selectin and activated GPIIb/IIIa.
Figure 2 Analysis of effect of CdTe QDs on platelet receptors by fluorescent microscopy.
Notes: Expression of P-selectin (A) or GPIIb-IIIa (B) receptors was analyzed in negatively charged 2.6 nm (g, h, i, s, t, u) or 4.8 nm (j, k, l, v, w, x) CdTe QD-induced platelet aggregates. Untreated WP (negative control: a, b, c, m, n, o) and collagen-treated platelets (positive control: d, e, f, p, q, r) served as controls. Samples were collected from aggregometer and then treated with P-selectin or PAC1 (against activated GPIIb-IIIa receptors) antibodies. Staining of actin cytoskeleton was done in resting and collagen-induced platelet aggregates but not in QD-induced platelet aggregates. Confocal images are representative of three independent experiments.
Abbreviations: Ab, antibody; CdTe, cadmium–telluride; GP, glycoprotein; QD, quantum dot; PRP, platelet-rich plasma; WP, washed platelets.
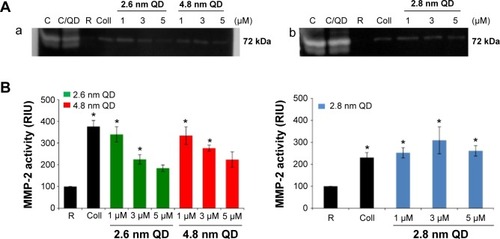
QDs induce MMP-2 release from platelets
Platelets contain and release MMP-2, a gelatinase, which acts as a stimulatorCitation31 of aggregation. Therefore, we studied the gelatinolytic activity of MMP-2 released from QD-activated platelets by gelatin gel zymography () and quantified the resultant bands (). Releasates from 2.6 nm or 4.8 nm negatively charged QD-treated WPs showed a significant increase in MMP-2 activity compared to resting platelets for 1 μM and 3 μM. Positively charged 2.8 nm QDs induced a significant increase in MMP-2 activity for all the concentrations tested.
Figure 3 Zymography: detection and quantification of MMP-2 released from CdTe QD-activated platelets.
Notes: (A) MMP-2 gelatinase activity in the releasates of negatively charged (a) or positively charged (b) QD-activated platelets. Lanes: C (standard): releasates from HT1080 cells; C/QD: standard with 3 μM QD; R: releasate from resting (untreated) platelets; Coll: releasate from collagen-activated platelets; 1: releasate from platelets treated with 1 μM QD; 3: releasate from platelets treated with 3 μM QD; 5: releasate from platelets treated with 5 μM QD. Zymograms are representative of experiments carried out with samples from three different donors. (B) Quantitative data and statistical analysis of MMP-2 bands. Data are mean ± SEM of three independent experiments. *P<0.05 as compared with resting platelets (analysis of variance with Dunnett’s).
Abbreviations: CdTe, cadmium–telluride; MMP, matrix metalloproteinase; QD, quantum dot; RIU, relative intensity units; SEM, standard error of the mean.
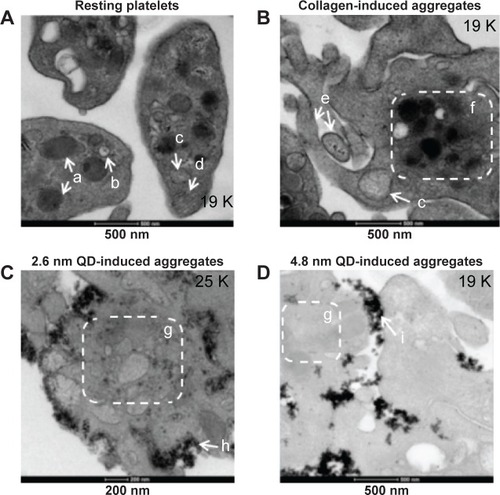
Ultramicroscopic study of QD-induced platelet activation
QDs are beyond the diffraction limit of resolution for conventional microscopy (~200 nm).Citation32 Therefore, to study in depth the structure of QD-induced platelet–platelet interactions, TEM was used. TEM images of platelets are shown in . Resting platelets () did not show any pseudopodia, and the organelles were found randomly distributed throughout the cytoplasm. The microtubules in the resting platelets were localized in the periphery of the platelet. However, collagen-aggregated platelets () showed formation of pseudopodia, and the organelles were concentrated in the center of the platelet. Both 2.6 nm () and 4.8 nm () QD-treated platelets showed degranulated intracellular granules and pseudopodia formation, and the QDs were clearly associated with the outer membrane of activated platelets.
Figure 4 Association of QD agglomerates with platelets, as observed using transmission electron microscopy.
Notes: Washed platelets were treated with negatively charged 2.6 nm or 4.8 nm size CdTe QDs in optical aggregometer. Samples were fixed with glutaraldehyde at 20% aggregation in the aggregometer. After washing the platelet aggregates with phosphate-buffered saline, the samples were processed and subjected to transmission electron microscopy imaging. Negative control (A) was untreated resting platelets, and positive control (B) was collagen-induced aggregates; 2.6 nm (C) and 4.8 nm (D) QD-induced platelet aggregates are shown. Images are representative of three independent experiments. (a) α granules; (b) dense granules; (c) mitochondrion; (d) microtubules; (e) pseudopodia; (f) organelles concentrated in the center of the cytoplasm; (g) degranulatedintracellular granules; (h) 2.6 nm CdTe QDs; (i) 4.8 nm CdTe QDs.
Abbreviations: CdTe, cadmium–telluride; QD, quantum dot.
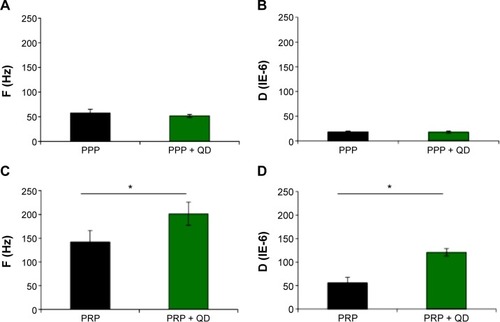
QDs induce platelet activation in the presence of plasma under flow conditions
Results obtained from our LTA and flow cytometry studies demonstrated that the presence of plasma was able to prevent platelets from being activated by QDs. However, LTA is performed under no-flow conditions, and the sensitivity of this method is low as it does not detect platelet microaggregates.Citation33 Therefore, QCM-D was used to investigate the influence of negatively charged 2.6 nm CdTe QDs on platelet microaggregation. The results obtained are shown in . PPP samples () did not show any difference in frequency and dissipation when treated with QDs. However, significant changes in frequency and dissipation were observed in QD-treated PRP samples, consistent with generation of platelet microaggregates (). The platelet activation was further confirmed by the microscopic analysis of the crystals.
Figure 5 Inductions of platelet aggregation by CdTe QDs as measured by QCM-D.
Notes: Human platelet-poor plasma or platelet-rich plasma was treated with negatively charged 2.6 nm CdTe QDs and perfused over fibrinogen-coated QCM-D sensors. Frequency and dissipation were recorded in real time. Untreated PPP or PRP was taken as negative control. Frequency and dissipation values obtained from PPP (A, B) and PRP (C, D) are shown. Data are mean ± SEM of four independent experiments. *P<0.05, as compared with PRP.
Abbreviations: CdTe, cadmium–telluride; D, dissipation; F, frequency; QD, quantum dot; PPP, platelet-poor plasma; PRP, platelet-rich plasma; QCM-D, quartz crystal microbalance with dissipation; SEM, standard error of the mean.
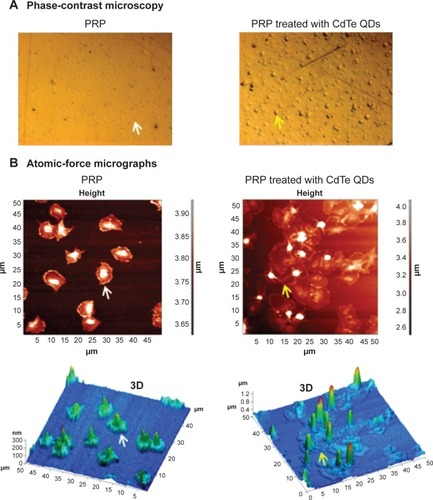
Phase-contrast and AFM were used to visualize the morphology of flow-induced platelet microaggregates formed on the surface of fibrinogen-coated crystals. Phase-contrast images of platelets adhering on crystals are shown in . Images showed large platelet aggregates in PRP samples treated with QDs compared to the untreated PRP samples (n=4). Dry-phase images taken by AFM are shown in . Image analysis demonstrated the presence of platelet aggregates on crystals perfused with QD-treated PRP samples compared to discrete platelets on crystals perfused with untreated PRP.
Figure 6 Phase-contrast and atomic-force micrographs of CdTe QD-induced platelet microaggregates on QCM-D crystals.
Notes: After measuring the frequency and dissipation, the quartz crystals with adhered platelet microaggregates were subjected to phase-contrast microscopy (A) or atomic-force microscopy (B). Platelets adhered on crystals perfused with untreated PRP were taken as controls. Individual platelets (white arrows) and platelet aggregates (yellow arrows) are shown. Three-dimensional images corresponding to height images are shown. Images are representative of three independent experiments.
Abbreviations: CdTe, cadmium–telluride; QD, quantum dot; PRP, platelet-rich plasma; QCM-D, quartz crystal microbalance with dissipation.
Discussion
Nanoparticle formulations designed for systemic administration have raised concerns regarding their biocompatibility. In addition, the kinetics and the efficacy of NP-based diagnostic and imaging tools may depend on the interactions of the vascular microenvironment with the particles. The NPs, after entering the blood stream, encounter a complex environment of plasma proteins and the cellular components of hemostasis. Indeed, we have demonstrated previously that NPs interacted with endothelial cells, and shear stress plays a critical role in the uptake and localization of QDs under flow conditions.Citation34 Furthermore, thrombogenicity, the propensity of a material to induce blood clotting, is relevant to the safety of the NPs. The higher the circulation half-life values for the NPs in blood, the larger the chances for platelet–NP interactions.Citation35 In this study, we investigated the effects of CdTe QDs on human platelets under quasi-dynamic and flow conditions using LTA and QCM-D. We analyzed the surface expression of platelet activation markers using flow cytometry and immunofluorescence studies. Gelatin zymography was used to detect the release of a proaggregatory enzyme MMP-2 from QD-activated platelets. In addition, we also analyzed the morphology of QD-induced platelet aggregates with AFM and TEM.
The influence of negatively or positively charged CdTe QDs on human platelet function in vitro was examined by LTA. These CdTe QDs did not induce platelet aggregation as measure by LTA. This is in agreement with a previous study done by Geys et alCitation22 showing that CdSe/ZnS-QDs by themselves did not activate platelets in human PRP samples. The absence of platelet aggregation in the presence of plasma could be due to the adsorption of plasma proteins or lipids on the NPs, resulting in a biomolecular interface organization named “corona,” which determines the biological profile of the NP.Citation36,Citation37 Indeed, the binding of NPs with plasma proteins affects the interactions of NPs with cell membrane.Citation38 In our study with WPs, QDs were found to cause significant aggregation. This response may be attributed to the absence of plasma proteins, which were washed off the platelets with Tyrode’s solution during platelet preparation. Interestingly, 2.6 nm QDs were found to cause aggregation at lower concentration than 4.8 nm QDs. This effect could be attributed to the larger surface-to-volume ratioCitation39 available for QDs interaction with the suspended platelets. In addition, the extremely small size of QDs could allow for their direct interaction with the integrins on the platelet surface, leading to a significant functional response. Indeed, TEM showed QDs close interactions between particles and platelets. The ultrastructural examination of collagen and QD-treated platelet aggregates showed organelles concentrated in the center of platelets compared to resting platelets, and agglomerates of QDs were associated with the outer surface (plasma membrane) of the platelets. This suggests that QDs may most likely interact with the abundant surface GPIIb/IIIa, resulting in receptor activation and the aggregatory response.
The reduced aggregatory response observed at concentrations >3 μM could be due to the interference of QDs with the release of platelet granular content, thus limiting platelet activation. The positively charged CdTe QDs demonstrate a pattern of platelet aggregation that is similar to that of the negatively charged 2.6 nm QDs. Interestingly, Dobrovolskaia et alCitation40 found that surface charge plays an important role in platelet aggregation induced by poly(amido amine) dendrimers. Indeed, large positively charged NPs induced aggregation while negatively charged and neutral particles were largely deprived of aggregatory effects. As QD-induced platelet aggregation in isolated platelets was stimulated both by positively and negatively charged particles, it is likely that in addition to platelet surface disruption,Citation40 other molecular mechanisms are involved in proaggregatory effects of QD in plasma-free medium.
Recently, we have critically reviewed mechanisms involved in the interactions of nanomaterials with platelets.Citation41 We proposed that nanomaterial-induced increases in intraplatelet calcium play a major role in NP-induced aggregation. This may result from direct physical breach of platelet membrane integrity or conformational changes of platelet receptors involved in aggregation, such as GPIIb/IIIa.
Platelet activation is associated with the upregulation of the surface receptors that play an important role in adhesion, aggregation, and platelet–leukocyte aggregation. The glycoprotein integrin receptor GPIIb/IIIa and P-selectin are established platelet activation markers. The activation of GPIIb/IIIa is crucial for platelet aggregation to occur.Citation42 In addition, changes in the abundance of P-selectin on the platelet surface membrane underlie platelet–leukocyte aggregation and clot stabilization.Citation21 Because QDs interfered with the flow cytometric measurement of GPIIb/IIIa antibodies, we measured the expression of P-selectin in samples of PRP and WPs. Data showed a significantly increased expression of P-selectin in WPs. The results observed by flow cytometry confirmed that the presence of plasma protects the platelets from activation under quasi-dynamic conditions. We used confocal imaging and showed QD-induced increase in these platelet receptors. The low expression level of these molecules on untreated resting platelets was probably due to cytoskeletal polymerization induced by platelet preparation.Citation43
Gelatinases act as stimulators (MMP-2) or inhibitors (MMP-9) of aggregation, and their sequential release correlates with stimulation/inhibition of aggregation.Citation44 MMP-2 has been shown to promote platelet adhesion to fibrinogen.Citation45 Our zymography studies showed that QD-activated platelets released MMP-2, in agreement with previous studies involving NPs.Citation20
The platelet activation observed in this study is in agreement with a number of previous studies performed using various NPs such as carbon,Citation21 silver,Citation18 gold,Citation19 latex,Citation46 silica,Citation47 and particulate matter.Citation48 Most of these studies were performed using LTA. We have shown that LTA may not be sensitive enough for studying platelet–NP interactions, and a more sensitive, flow-mimicking technique such as QCM-DCitation29–Citation33 may be preferred. In keeping with this notion, we detected QD-induced platelet aggregation in PRP using QCM-D but not LTA. As it is clear that NPs induce platelet activation and thrombus formation in animal models,Citation21 the use of methodologies capable of measuring flow-induced platelet aggregation is recommended for studies on platelet–NP interactions.
Conclusion
In summary, this study demonstrates that QDs are able to activate platelets through complex mechanisms that may involve close interactions of QDs with platelet surface membranes, activation of GPIIb/IIIa, and release of a proaggregatory MMP-2. More experimental evidence is required to tease out the exact signaling pathways involved in QD-induced platelet activation. The data presented here necessitate the hemocompatibility testing of NPs prior to the design of parenteral/systemic nanomedicine.
Acknowledgments
This work was partly supported by the Higher Education Authority of Ireland, SFI-Ireland (SRC-Bionanointeract), EU FP7 projects: NAMDIATREAM (#246479) and MULTIFUN (#262943).
Disclosure
The authors report no conflicts of interest in this work.
References
- DobrovolskaiaMAAggarwalPHallJBMcNeilSEPreclinical studies to understand nanoparticle interaction with the immune system and its potential effects on nanoparticle biodistribution200854487495
- AzzazyHMMansourMMIn vitro diagnostic prospects of nanoparticlesClin Chim Acta20094031–21819361470
- RosenthalSJChangJCKovtunOMcBrideJRTomlinsonIDBiocompatible quantum dots for biological applicationsChem Biol2011181102421276935
- AzzazyHMMansourMMKazmierczakSCFrom diagnostics to therapy: prospects of quantum dotsClin Biochem20074013–1491792717689518
- WengJRenJLuminescent quantum dots: a very attractive and promising tool in biomedicineCurr Med Chem200613889790916611074
- Ryman-RasmussenJPRiviereJEMonteiro-RiviereNASurface coatings determine cytotoxicity and irritation potential of quantum dot nanoparticles in epidermal keratinocytesJ Invest Dermatol2007127114315316902417
- NabievIMitchellSDaviesANonfunctionalized nanocrystals can exploit a cell’s active transport machinery delivering them to specific nuclear and cytoplasmic compartmentsNano Lett20077113452346117949046
- LhermusierTChapHPayrastreBPlatelet membrane phospholipid asymmetry: from the characterization of a scramblase activity to the identification of an essential protein mutated in Scott syndromeJ Thromb Haemost20119101883189121958383
- JungSMKinoshitaKTanoueKIsohisaIYamazakiHRole of surface negative charge in platelet function related to the hyperreactive state in estrogen-treated prostatic carcinomaThromb Haemost19824732032096180496
- WhiteJGBurrisSMMorphometry of platelet internal contractionAm J Pathol198411534124176145356
- Polanowska-GrabowskaRSimonCGJrGearARPlatelet adhesion to collagen type I, collagen type IV, von Willebrand factor, fibronectin, laminin and fibrinogen: rapid kinetics under shearThromb Haemost199981111812310348702
- KamataTTakadaYPlatelet integrin alphaIIbbeta3-ligand interactions: what can we learn from the structure?Int J Hematol200174438238911794692
- WagnerCLMascelliMANeblockDSWeismanHFCollerBSJordanREAnalysis of GPIIb/IIIa receptor number by quantification of 7E3 binding to human plateletsBlood19968839079148704248
- BeckerTJüttnerBElsnerHAPlatelet P-selectin and GPIIb/IIIa expression after liver transplantation and resectionTranspl Int200417844244815316595
- SheuJRFongTHLiuCMExpression of matrix metalloproteinase-9 in human platelets: regulation of platelet activation in in vitro and in vivo studiesBr J Pharmacol2004143119320115289295
- RadomskiAStewartMWJuraszPRadomskiMWPharmacological characteristics of solid-phase von Willebrand factor in human plateletsBr J Pharmacol200113451013102011682449
- ShrivastavaSBeraTSinghSKSinghGRamachandraraoPDashDCharacterization of antiplatelet properties of silver nanoparticlesACS Nano2009361357136419545167
- StevensKNCrespo-BielOvan den BoschEEThe relationship between the antimicrobial effect of catheter coatings containing silver nanoparticles and the coagulation of contacting bloodBiomaterials200930223682369019394689
- WiwanitkitVSereemaspunARojanathanesRGold nanoparticles and a microscopic view of platelets: a preliminary observationCardiovasc J Afr200920214114219421652
- CorbalanJJMedinaCJacobyAMalinskiTRadomskiMWAmorphous silica nanoparticles aggregate human platelets: potential implications for vascular homeostasisInt J Nanomedicine2012763163922334785
- RadomskiAJuraszPAlonso-EscolanoDNanoparticle-induced platelet aggregation and vascular thrombosisBr J Pharmacol2005146688289316158070
- GeysJNemmarAVerbekenEAcute toxicity and prothrombotic effects of quantum dots: impact of surface chargeEnviron Health Perspect2008116121607161319079709
- NemmarANemeryBHoetPHVermylenJHoylaertsMFPulmonary inflammation and thrombogenicity caused by diesel particles in hamsters: role of histamineAm J Respir Crit Care Med2003168111366137212969870
- WilsonDWAungHHLameMWExposure of mice to concentrated ambient particulate matter results in platelet and systemic cytokine activationInhal Toxicol201022426727620064101
- KoziaraJMOhJJAkersWSFerrarisSPMumperRJBlood compatibility of cetyl alcohol/polysorbate-based nanoparticlesPharm Res200522111821182816132346
- ByrneSJle BonBCorrSASynthesis, characterisation, and biological studies of CdTe quantum dot-naproxen conjugatesChem Med Chem20072218318617177232
- RadomskiMMoncadaSAn improved method for washing of human platelets with prostacyclinThromb Res19833043833896351341
- SinnSMüllerLDrechselHPlatelet aggregation monitoring with a newly developed quartz crystal microbalance system as an alternative to optical platelet aggregometryAnalyst2010135112930293820877907
- Santos-MartínezMJMedinaCPrina-MelloAA nanoscale resolution assay of flow-induced platelet microaggregationKardiochirurgia i Torakochirurgia Polska201074365375 Polish
- CattaneoMLight transmission aggregometry and ATP release for the diagnostic assessment of platelet functionSemin Thromb Hemost200935215816719408189
- SawickiGSandersEJSalasEWozniakMRodrigoJRadomskiMWLocalization and translocation of MMP-2 during aggregation of human plateletsThromb Haemost19988058368399843180
- Gibbs-FlournoyEABrombergPAHoferTPSametJMZuckerRMDarkfield-confocal microscopy detection of nanoscale particle internalization by human lung cellsPart Fibre Toxicol201181221247485
- Santos-MartinezMJInkielewicz-StepniakIMedinaCThe use of quartz crystal microbalance with dissipation (QCM-D) for studying nanoparticle-induced platelet aggregationInt J Nanomedicine2012724325522275839
- SamuelSPJainNO’DowdFMultifactorial determinants that govern nanoparticle uptake by human endothelial cells under flowInt J Nanomedicine201272943295622745555
- SahliHTapon-BretaudièreJFischerAMInteractions of poly(lactic acid) and poly(lactic acid-co-ethylene oxide) nanoparticles with the plasma factors of the coagulation systemBiomaterials19971842812889068888
- AllémannEGravelPLerouxJCBalantLGurnyRKinetics of blood component adsorption on poly(D,L-lactic acid) nanoparticles: evidence of complement C3 component involvementJ Biomed Mater Res19973722292349358316
- MonopoliMPAbergCSalvatiADawsonKABiomolecular coronas provide the biological identity of nanosized materialsNat Nanotechnol201271277978623212421
- LesniakASalvatiASantos-MartinezMJRadomskiMWDawsonKAÅbergCNanoparticle adhesion to the cell membrane and its effect on nanoparticle uptake efficiencyJ Am Chem Soc201313541438144423301582
- KleinJProbing the interactions of proteins and nanoparticlesProc Natl Acad Sci U S A200710472029203017284585
- DobrovolskaiaMAPatriAKSimakJNanoparticle size and surface charge determine effects of PAMAM dendrimers on human platelets in vitroMol Pharm20129338239322026635
- TomaszewskiKARadomskiMWSantos-MartinezMJNanodiagnostics, nanopharmacology and nanotoxicology of platelet – vessel wall interactionsNanomedicine2015
- CollerBSBlockade of platelet GPIIb/IIIa receptors as an antithrombotic strategyCirculation1995929237323807586333
- EstebanellEDiaz-RicartMLozanoMMazzaraREscolarGOrdinasACytoskeletal reorganization after preparation of platelet concentrates, using the buffy coat method, and during their storageHaematologica19988321121179549921
- Fernandez-PatronCMartinez-CuestaMASalasEDifferential regulation of platelet aggregation by matrix metalloproteinases-9 and -2Thromb Haemost19998261730173510613662
- MartinezASalasERadomskiARadomskiMWMatrix metalloproteinase-2 in platelet adhesion to fibrinogen: interactions with nitric oxideMed Sci Monit20017464665111433190
- MiyamotoMSasakawaSOzawaTKawaguchiHOhtsukaYMechanisms of blood coagulation induced by latex particles and the roles of blood cellsBiomaterials19901163853882207226
- NemmarANemeryBHoetPHVan RooijenNHoylaertsMFSilica particles enhance peripheral thrombosis: key role of lung macrophageneutrophil cross-talkAm J Respir Crit Care Med2005171887287915657461
- NemmarAHoetPHDinsdaleDVermylenJHoylaertsMFNemeryBDiesel exhaust particles in lung acutely enhance experimental peripheral thrombosisCirculation200310781202120812615802