
 ?Mathematical formulae have been encoded as MathML and are displayed in this HTML version using MathJax in order to improve their display. Uncheck the box to turn MathJax off. This feature requires Javascript. Click on a formula to zoom.
Abstract
Up to 90% of patients develop adhesion following laparotomy. Upregulating fibrinolysis within the peritoneum reduces adhesions. Tanshinone IIA (Tan IIA) promotes fibrinolysis in hepatic fibrosis and the cardiovascular system and may play a role in preventing adhesions. We report preparation and characterization of liquid nanoparticles of Tan IIA for intravenous administration and investigate its feasibility in clinical practice. Tan IIA liquid nanoparticles (Tan IIA-NPs) were prepared using the emulsion/solvent evaporation method. Adhesions were induced in Sprague–Dawley rats by injuring the parietal peritoneum and cecum, followed by intravenous administration of various Tan IIA-NP dosages. The adhesion scores for each group were collected 7 days after the initial laparotomy. The activity of tissue-type plasminogen activator (tPA) was measured from the peritoneal lavage fluid. The messenger RNA and protein expression levels of plasminogen activator inhibitor-1 (PAI-1) were measured by quantitative real-time polymerase chain reaction and enzyme-linked immunosorbent assay. TGF-β1 and collagen I expressions were measured immunohistochemically in the ischemic tissues. The effects of Tan IIA-NPs and free-Tan IIA on tPA and PAI-1 were measured in vitro in TGF-β1-induced HMrSV5 cells. Tan IIA-NPs exhibited small particle size, high encapsulation efficiency, good stability for storage, and safety for intravenous administration. Tan IIA-NPs were effective in preventing adhesion. Tan IIA-NPs increased tPA activity in peritoneal lavage fluid, and tPA mRNA and protein expression, and decreased PAI-1 mRNA and protein expression in the ischemic tissues. Moreover, Tan IIA-NPs decreased TGF-β1 and collagen I expressions in the ischemic tissues. Tan IIA-NPs administered via tail veins upregulated fibrinolysis in the peritoneum. In vitro studies showed that these effects may be mediated by the TGF-β signal pathway.
Introduction
Postoperative peritoneal adhesions, which occur in the peritoneal cavity as a result of surgery or stimulation of foreign bodies, are the most frequent complication of abdominal surgery. Up to 90% of patients develop adhesions after surgery, and a considerable proportion of cases result in major short- and long-term negative consequences, including small-bowel obstruction, infertility, and chronic pelvic pain.Citation1 The incidence of readmissions directly related to adhesions varies from 5% to 20%,Citation2 which poses a tremendous burden on public health.
Studies have shown that peritoneal trauma initiates the persistence of a fibrin-rich exudate at the site of injury and forms bands between adjacent organs.Citation3–Citation7 Fibrin is principally degraded by plasmin, which is converted from plasminogen by tissue-type plasminogen activator (tPA) and urokinase plasminogen activator (uPA).Citation8 tPA is primarily secreted by mesothelial cells and inactivated by plasminogen activator inhibitor-1 (PAI-1).Citation9–Citation11 Moreover, transforming growth factor-β1 (TGF-β1) protein plays an important role in the process of adhesion formation. This protein promotes collagen synthesis and proliferation of interstitial cells. TGF-β1 has been viewed as the primary pathogenic factor of fibrosis disease and postoperative adhesions.Citation12 Holmdahl et alCitation13 proved that the concentration of PAI-1 in the peritoneum was positively related to TGF-β1. Chegini et alCitation14 suggested that TGF-β1 may inhibit plasminogen activation via upregulation of PAI-1.
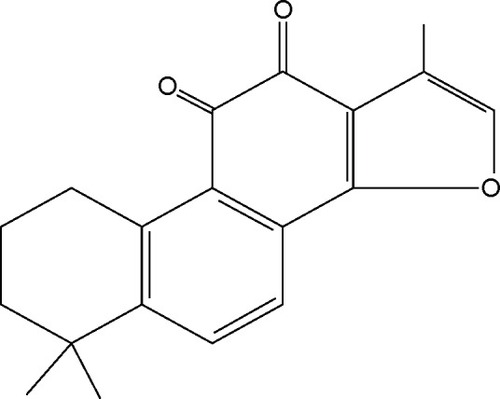
Tanshinone IIA (Tan IIA) (), which is derived from the dried roots of Salvia miltiorrhiza Bunge, exhibits multiple pharmacological activities, such as anti-inflammatory,Citation15 antioxidative,Citation16 attenuation of cardiac fibrosis, and modulation of collagen metabolism.Citation17 Our previous study showed that Tan IIA prevented postoperative adhesion by enhancing fibrinolytic activity.Citation18
Figure 1 Chemical structure of tanshinone IIA.
However, when administered as tablets or capsules, the significant first-pass metabolism of Tan IIA often results in a low oral bioavailability, subsequently resulting in poor therapeutic efficacy.Citation19 In addition, the high lipophilicity and poor oral absorption of Tan IIA are challenges for pharmacists while developing suitable dosage forms. Therefore, a proper pharmaceutical strategy is needed to improve the fraction of bioavailability. To date, several pharmaceutical strategies have been proposed such as solid lipid nanoparticles (NPs),Citation20 solid dispersion,Citation21 and microemulsion.Citation22 However, the utility of these approaches is often restricted because of poor stability, complexity associated with manufacturing, and unqualified bioavailability, which makes them unsuitable for large-scale production and clinical application.Citation23
Liquid NPs have proved an effective vehicle that could increase the bioavailability for many drugs.Citation24,Citation25 Our previous study has shown that liquid NPs for intravenous administration exhibiting better bioavailability and no systemic toxicity may act as a potential Tan IIA vehicle for clinical application.Citation24
The purpose of this study was to develop a novel and safe liquid NP as Tan IIA vehicle to determine whether it could reduce postoperative adhesion formation in vivo and to elucidate its mechanism of action in vitro.
Materials and methods
Materials
Tan IIA (with a purity proven by high-performance liquid chromatography as 99.2%) was purchased from Natural Field Bio-technique Co. Ltd. (Xi’an, People’s Republic of China). Medium-chain triglyceride (MCT) and egg phos-phatidylcholine (EPC) were obtained from Lipoid GmbH (Steinhausen, Switzerland). Dimethyl sulfoxide (DMSO) and cholesterol were purchased from Sigma-Aldrich Co. (St Louis, MO, USA). All chemicals and reagents used were of analytical or chromatographic grade. Ultrapure water was used throughout the whole study.
Animals
Male Sprague–Dawley (SD) rats 180–200 g and BALB/c mice 18–20 g (5 weeks old) were obtained from the Southern Medical University Experimental Animal Center (Guangzhou, People’s Republic of China) for all experiments. The animals were housed at a constant room temperature, with 12-hour light and dark cycles, and were provided standard rodent chow (Southern Medical University Experimental Animal Center) and water ad libitum. The Institutional Animal Care and Use Committee at the Southern Medical University (Guangzhou, People’s Republic of China) approved the study. All animal care and procedures were performed in accordance with the recommendations outlined in the National Institutes of Health Guide for the Care and Use of Laboratory Animals.
Cell culture
Human peritoneal mesothelial cell line (HMrSV5) was purchased from Cell Culture Centre, Institute of Basic Medical Sciences, Chinese Academy of Medical Sciences (Beijing, People’s Republic of China). HMrSV5 was originally isolated from human omentum. Briefly, omentum collected from consenting non-uremic patients undergoing elective abdominal surgery was incubated in 0.05% (weight/volume [w/v]) trypsin and 0.01% (w/v) ethylenediaminetetraacetic acid for 20 minutes at 37°C. The harvested mesothelial cells were centrifuged at 1,200 rpm for 5 minutes and then transferred into 75 cm2 tissue culture flasks and cultured in an incubator with a humidified atmosphere consisting of 95% O2 and 5% CO2 at 37°C in Dulbecco’s Modified Eagle’s Medium (DMEM) (Thermo Fisher Scientific, Waltham, MA, USA) supplemented with 10% fetal bovine serum (FBS), 100 U/mL penicillin, 100 μg/mL streptomycin, 2 mmol/L L-glutamine, and 20 mmol/L hydroxyethyl piperazine ethanesulfonic acid (Thermo Fisher Scientific). The medium was changed every 2 or 3 days.
Preparation of Tan IIA liquid NPs
Tan IIA liquid NPs (Tan IIA-NPs) were prepared by the emulsion/solvent evaporation method. The concentration of MCT, the ratio of EPC and cholesterol, and the concentration of Tan IIA were identified as critical factors, and the best preparation method was optimized using an orthogonal design. The optimized formulation was composed of MCT (15%, w/v), Tan IIA (1.0 mg/mL), EPC (1.2%, w/v), cholesterol (0.06%, w/v), and glycerin (2.0%, volume/volume [v/v]). The optimized preparation methods included the following:Citation26 briefly, EPC, cholesterol, and Tan IIA were dissolved in 20 mL absolute ethyl alcohol and evaporated under reduced pressure at 50°C for at least 6 hours, and then dispersed in sterile water for injection by sonication, forming a liposome suspension. After that, the liposome suspension was coupled with MCT, and emulsified by high-speed shear mixing (JJ-2; Jintan Yitong Electronics Co. Ltd., Jintan, People’s Republic of China) at 10,000 rpm for 4 minutes. Next, the emulsified mixture was transferred to a nano-homogenizer (AH2010 high-pressure homogenizer and liposome extruder; ATS Engineering Incorporated, Shanghai, People’s Republic of China) and continuously processed at 800 bar for 3 minutes. Sodium hydroxide was used to regulate the pH value to 7.2. Finally, three batches of the completed products were filtered through 0.45 μm membrane and then sealed in 2 mL ampules after purging with nitrogen gas, and autoclaved at 121°C for 10 minutes. The blank NPs were prepared without the addition of Tan IIA.
Characterization of Tan IIA-NPs
Particle size, size distribution, and zeta potential
Particle size, polydispersity index, and zeta potential were measured using a Malvern Zetasizer 3000 HSA (Malvern Instruments, Malvern, UK). Experiments were performed in triplicate.
Transmission electron microscopy morphology
Transmission electron microscopy (TEM) was used to observe the morphology of the Tan IIA-NPs by the phosphotungstic acid negative dyeing method. One drop of Tan IIA-NPs was placed on a copper grid, then the excess liquid was drained by filter paper and dried at room temperature. The copper grid was stained in a 2% phosphotungstic acid solution (pH 7.0) for 2 minutes. Observations were carried out at 80 kV with a transmission electron microscope (HITACHI 7650; Hitachi Ltd., Tokyo, Japan).
Evaluation of drug encapsulation efficiency
The amount of encapsulated Tan IIA in the NPs was evaluated by a direct method. One milliliter of the samples (1.0 mg/mL) was collected and diluted with methanol to 10 mL; demulsification was then performed by sonication (SB25-12-YDTD; Scientz, Ningbo, People’s Republic of China) for 15 minutes. The mobile phase was diluted to a constant volume of 10 mL, and 1 mL of the testing solution was filtered through a 0.45 μm organic membrane filter before being detected by high-performance liquid chromatography (LC-20A; Shimadzu, Kyoto, Japan). The mobile phase was a mixture of water and acetonitrile (15:85). The flow rate was set to 1 mL/min with a detection of 270 nm. Separation was achieved using a Platisil C18 column (150 mm ×4.6 mm, 5 μm; Dikma, Beijing, People’s Republic of China). The column temperature was 30°C. The encapsulation efficiency (EE%) was evaluated using the following formula:
Stability study of Tan IIA-NPs
Accelerated testing
To investigate the physicochemical stability of Tan IIA-NPs when exposed to the exceptional conditions in the accelerated testing cabinet (TX-VTH-2000; Technox Inc., Incheon, South Korea). Briefly, three batches of Tan IIA-NP samples were placed into the accelerated testing cabinet at 60°C and room temperature with 4,500±500 lx for 10 days. At the time intervals of 0, 5, and 10 days, Tan IIA-NP samples were collected and investigated for the aspects of mean particle size, zeta potential, pH value, and EE% to evaluate the physicochemical stability of the Tan IIA-NPs during storage.
Long-term stability
The Tan IIA-NPs were stored at 25°C±2°C away from light over 12 months. At the time intervals of 0, 3, 6, 9, and 12 months, NP samples were collected and investigated for the aspects of mean particle size, zeta potential, pH value, and drug content to evaluate the physicochemical stability of the Tan IIA-NPs during storage.
Safety study of Tan IIA-NPs
Bacterial endotoxin test
Chromogenic substrate limulus amebocyte lysate was used to detect the content of bacterial endotoxin in Tan IIA-NPs. Briefly, a control standard endotoxin calibration curve was prepared following the manufacturer’s instructions in a chromogenic substrate limulus reagent kit (Xiamen Limulus Reagent Co. Ltd., Xiamen, People’s Republic of China). Three batches of samples, which had been autoclaved, were diluted tenfold with bacterial endotoxin test of water, and were then prepared following the manufacturer’s instructions. The content of bacterial endotoxin in each sample was determined by extrapolation from a control standard endotoxin curve. The bacterial endotoxin limited value was evaluated using the following formula:
Acute toxicity study
Sixty BALB/c mice weighing 18–20 g were equally designated into three groups (each group had ten males and ten females), and the first two groups were given Tan IIA-NPs and Tan IIA-free NPs via tail veins at a dosage level of 20 mg/kg, respectively, while the third group received an equivalent volume (20 mL/kg) of 0.9 g/dL natrium chloride as control. The injection was repeated three times within 24 hours. Following a period of 14 days after the last administration, routine clinical observations were made daily, and the body weights of mice were measured and recorded in detail. After 14 days, blood and serum were obtained from the eyeballs of mice, and blood routine examination and blood biochemical determination were made by the Institute of Laboratory Medicine, Nanfang Hospital, Southern Medical University. The major organs (liver, heart, lungs, kidneys, and spleen) were harvested, fixed with paraformaldehyde, and embedded in paraffin. The 5 μm histological sections were stained with hematoxylin and eosin. Histological sections were observed for toxicity under a microscope.
In vivo studies
Determination of the effect of Tan IIA-NPs on peritoneal adhesion formation
Peritoneal adhesions were created in 180–200 g rats as described previously.Citation18 Briefly, animals were anesthetized by intraperitoneal injection of 0.3% pentobarbital sodium solution (30 mg/kg). Laparotomies via a midline incision were performed in 75 male SD rats, and three or four ischemic buttons were created approximately 1 cm apart on each peritoneal sidewall by discretely ligating small areas of peritoneum with 4-0 silk sutures. The rats were randomly assigned to the high-dose (HD) group (10 mg/kg Tan IIA-NPs), medium-dose (MD) group (5 mg/kg Tan IIA-NPs), low-dose (LD) group (2.5 mg/kg Tan IIA-NPs), Tan IIA-free NP group (10 mL/kg), and model control group (10 mL/kg 0.9 g/dL natrium chloride) (N=15 per group) with each treatment administered via tail injection after surgery. After 7 days, the animals were killed, and the number of adhesions to each ischemic button was quantified.
Grading of adhesions in rats
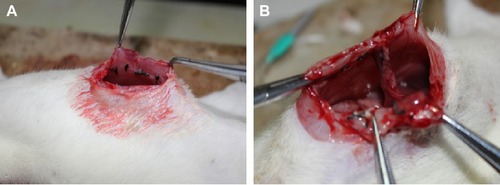
On postoperative day 7, an abdominal incision was made using the previously described anesthetic method. The adhesions () were graded as described by Nair et alCitation27 and the adhesion scores were determined by an investigator blinded to the division of the groups ().
Table 1 Grading of adhesions in rats according to the criteria of Nair et alCitation27
Figure 2 Illustration of experimental postoperative peritoneal adhesions in rats.
Notes: (A) Creation of ischemic buttons to peritoneal sidewall. (B) Adhesions to the buttons at postoperative day 7.
Determination of tPA activity in peritoneal fluid
Seven days after initial surgery,Citation18 the peritoneal fluid was collected by rinsing the peritoneal cavity with 2 mL of phosphate buffer containing heparin (1 IU/mL, pH =7.4) at 37°C from each rat. Approximately 1 mL of the fluid was recovered and added to an equal volume of 0.2 mol/L sodium acetate, pH 3.9. The cellular debris was then removed by microcentrifugation (2,000 rpm ×1 minute, 4°C).Citation28 The tPA activity in each sample was assayed in duplicate by adding 50 μL of the diluted sample to different wells of a 96-well microtiter plate containing 50 μL of tPA stimulator (0.6 mg/mL cyanogen bromide-digested fibrinogen; American Diagnostica Inc., Greenwich, CT, USA). Then, 150 μL of assay buffer (16.7 μg/mL human plasminogen [Athens Research and Technologies, Athens, GA, USA], 667 μM S-2251 substrate [Chromogenix, Bubendorf, Switzerland], and 20 mmol/L Tris, pH 8.3) was added to each well and gently mixed. Cleavage of the S-2251 substrate by tPA-activated plasmin produced a yellow color that absorbed wavelengths of 405 and 490 nm. The change in absorbance was measured at 37°C over a 6-hour period using a Spectra Max 250 spectrophotometer. The activity of tPA in each sample was determined by extrapolation from a tPA standard curve.
Detection of tPA and PAI expression levels by quantitative real-time polymerase chain reaction
Peritoneal tissue adjacent to and including the ischemic button was collected from animals in each group and stored at −80°C until use. The ischemic button tissues were homogenized by pulverization in liquid nitrogen, and 1 mL of 0.1 g/dL Triton X 100 was added for every 40 mg of tissue. The total RNA from the peritoneal ischemic button tissue was isolated according to the manufacturer’s instructions (RNAiso Plus; Takara Biotechnology, Tokyo, Japan). The RNA concentrations were determined spectrophotometrically by measuring the absorbance at 260 and 280 nm, and the RNA quality was assessed through gel electrophoresis. The complementary DNA (cDNA) was synthesized from the total RNA using the All-in-one™ first-strand cDNA synthesis kit (Genecopoeia, Rockville, MD, USA), according to the manufacturer’s instructions, and quantitative real-time polymerase chain reaction (qRT-PCR) was conducted using the All-in-one™ qPCR mix system (Genecopoeia, USA) with SYBR Green, according to the standard protocol. The following primer sets were used to amplify the following probes: tPA, 5′-CGCTGTACCTCACAGCATCTGTTTA-3′ (forward) and 5′-CATCCGCTTATCGATCATGCAC-3′ (reverse); PAI, 5′-ACCATCTCCGTGCCCATGA-3′ (forward) and 5′-GGGCAGTTCCAGGATGTCGTA-3′ (reverse); and β-actin, 5′-GGAGATTACTGCCCTGGCTCCTA-3′ (forward) and 5′-GACTCATCGTACTCCTGCTTGCTG-3′ (reverse).
qRT-PCR was performed using an Agilent Stratagene 3005P system. All polymerase chain reactions were performed under the conditions recommended by the manufacturer: 95°C for 10 minutes for initial denaturation, 40 cycles of 95°C for denaturation, 60°C for 20 seconds for annealing, and 72°C for 20 seconds for extension.
Determination of the ratio of tPA/PAI-1 in peritoneal tissue
Peritoneal tissue adjacent to and including the ischemic button was collected from animals in each group. One hundred milligrams of tissue was rinsed with 1× phosphate-buffered saline (PBS), homogenized in 1 mL of 1× PBS, and stored overnight at −20°C. After two freeze–thaw cycles were performed to break the cell membranes, the homogenates were centrifuged for 5 minutes at 15,000 rpm, 2°C–8°C. The supernatant was assayed and removed immediately. Alternatively, the supernatant was aliquoted and samples stored at −20°C or −80°C. The sample was centrifuged again after thawing before the assay, avoiding repeated freeze–thaw cycles. The total protein concentration was determined by bicinchoninic acid protein assay (KeyGen BioTECH, Nanjing, People’s Republic of China). The supernatants of each group were collected, and the tPA/PAI value was detected by enzyme-linked immunosorbent assay (ELISA), following the manufacturer’s instructions in the rat tPA and PAI ELISA kit (Abcam, Cambridge, UK). The ratio of tPA/PAI was evaluated using the following formula:
Immunohistochemistry
On postoperative day 7, ischemic button tissues of the rats were cleaned and soaked in formalin, and then the tissues were embedded in paraffin and sectioned. After that, the paraffin sections were deparaffinized in xylene, rehydrated in graded alcohols, and incubated with 3% hydrogen peroxide to block endogenous peroxidase activity. Then, the sections were stained with primary anti-TGF-β1 and anti-collagen I antibody (Santa Cruz Biotechnology Inc., Dallas, TX, USA) (1:1,000 dilutions) at 4°C overnight, respectively. After incubation with a biotinylated secondary antibody at room temperature for 40 minutes, the slides were stained with 3,3-diaminobenzidine. Finally, the sections were counter-stained with Mayer’s hematoxylin, differentiated, dried, and sealed. Images were taken in five randomly selected fields on each slide to determine the average optical density value (integrated optical density/area). The optical density was analyzed by Image-Pro Plus 6.0 software.
Anastomotic strength
To assess whether Tan IIA-NPs have an impact on wound healing, the model of anastomotic healing was used. Twenty-five male SD rats (180–200 g) were anesthetized using pentobarbital sodium solution and a lower midline incision was performed.Citation29 Segments of colon approximately 2 cm distal to the cecum were identified and completely transected, following which, continuity was restored by an end-to-end anastomosis using a continuous 6-0 polypropylene suture. The rats were randomly assigned to the HD group (10 mg/kg Tan IIA-NPs), MD group (5 mg/kg Tan IIA-NPs), LD group (2.5 mg/kg Tan IIA-NPs), Tan IIA-free NP group (10 mL/kg), and control group (10 mL/kg saline) (N=5 per group) with each treatment administered via tail injection after surgery. On postoperative day 7, the animals were killed and anastomotic segments approximately 4 cm in length (with the anastomosis in the middle) were carefully resected, including surrounding tissue and adhesions. The specimens were washed in saline and the stool was removed from the lumen. The anastomotic bursting pressure was measured. Briefly, one end of the bowel segment was cannulated with a short segment of 8-Fr intravenous tubing and secured with 6/0 silk suture. The other end was occluded with an atraumatic bowel clamp, and the entire segment was submerged in water while being insufflated with a constant flow of air (1–2 mL/s) through bifurcated tubing with a digital manometer (LEAKIN Co. Ltd., Ningbo, People’s Republic China) attached to one end and a 60 mL syringe to the other. The burst pressure was defined as the pressure at which the bowel segment leaked air.
In vitro study
tPA/PAI value in HMrSV5 cells induced by TGF-β1
The HMrSV5 cells were seeded into six-well plates (Corning Incorporated, Corning, NY, USA) at a density of 3×10⁵ cells/well and incubated for 12 hours. The cells were then treated with 3, 6, and 9 pmol/L TGF-β1 (R&D Systems, Inc., Minneapolis, MN, USA) for 0.5, 2, and 4 hours, respectively, and an equal volume of serum-free medium was added to the control group cells. The supernatants of each group were collected, and the tPA/PAI value was detected by ELISA (Abcam), following the manufacturer’s instructions in the human tPA and PAI ELISA kit.
Effect of Tan IIA-NPs on the tPA/PAI value in HMrSV5 cells induced by TGF-β1
The HMrSV5 cells were seeded into 24-well plates at a density of 5×10⁴ cells/well and incubated for 12 hours. The cells were then treated with 9 pmol/L TGF-β1 for 4 hours, and an equal volume of serum-free medium was added to the control group cells.
Tan IIA-NPs were diluted with DMEM (without FBS) to 20, 10, and 5 μg/mL. Free-Tan IIA was dissolved in 100 μL DMSO and diluted with DMEM (without FBS) to 20 μg/mL. The final DMSO concentration was maintained at less than 0.1% (v/v). Then, HMrSV5 cells induced by TGF-β1 were treated with Tan IIA-NPs, drug-free NPs, and free-Tan IIA, respectively. The TGF-β1-induction group and control group were incubated normally. An equal volume of DMEM was added to the TGF-β1-induction group and control group. After 24 hours, the supernatants of each group were collected to detect the tPA/PAI value using an ELISA kit.
Western blot analysis
HMrSV5 cells of each group were collected after 24 hours. The harvested cells were washed twice with ice-cold PBS and cell lysis buffer was added. The lysates were centrifuged (13,000 rpm) at 4°C for 20 minutes. The protein concentration was determined by bicinchoninic acid protein assay. The supernatants with loading buffer were boiled at 100°C for 10 minutes and separated by sodium dodecyl sulfate polyacrylamide gel electrophoresis with 10% gels. The separated proteins were then transferred to polyvinylidene fluoride membranes. The membranes were blocked with 5% nonfat milk for 1 hour at room temperature and then incubated overnight with primary antibodies (anti-TGF-β1; anti-collagen I) at 4°C. After 12 hours, the membranes were incubated with secondary antibody at room temperature followed by three 5-minute washes with Tris-buffered saline and Tween 20. After that, the membrane was scanned by in vivo imaging systems. To calculate fold changes, the densities of protein bands were determined by quantity one.
Statistical analysis
All experimental data were expressed as mean ± standard deviation. The Kruskal–Wallis test was used to identify the differences in the adhesion grades between the groups. The grouped data were analyzed with SPSS 13.0. Statistical analysis was performed by analysis of variance followed by Bonferroni post hoc analysis. The data were obtained by Kolmogorov–Smirnov test and confirmed to have a normal distribution. P<0.05 was considered to indicate statistical significance.
Results
Preparation and characterization of Tan IIA-NPs
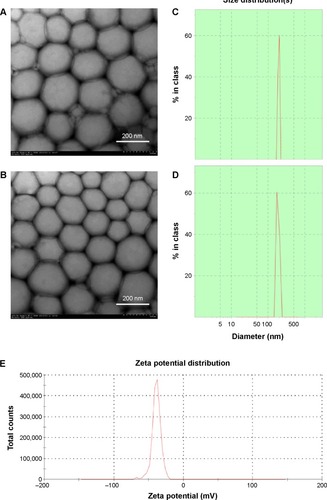
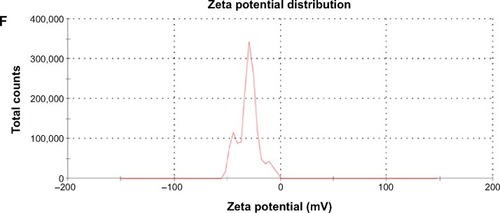
shows the particle size of various NPs. The average diameter of the Tan IIA-NPs was approximately 217.25±5.68 nm with a polydispersity index of 0.17±0.035. There was no significant difference in particle size between Tan IIA-NPs and Tan IIA-free NPs. The zeta potentials of Tan IIA-NPs and Tan IIA-free NPs were −31.2±2.7 mV and −37.6±3.2 mV, respectively. As shown in , there was no distinct difference in size distribution for these two NPs (). Moreover, the zeta potential distribution over the particle surfaces remained uniform and showed no distinct difference (). TEM showed that Tan IIA-NPs and Tan IIA-free NPs had a spheroidal surface. No distinct differences in shape were observed between the different NPs (). The particle size measured from the TEM images matched with the results measured by the Malvern Zetasizer 3000 HSA. The optimal Tan IIA EE% of Tan IIA-NPs was 97.86%±0.23%.
Table 2 Particle sizes, zeta potentials, and polydispersity index values of various NPs (n=3)
Figure 3 Characterization of Tan IIA-NPs and blank NPs.
Notes: Transmission electron microscopy images of (A) blank NPs ×25.0 k and (B) Tan IIA-NPs ×25.0 k. Malvern Zetasizer 3000 HSA size measurement of (C) blank NPs and (D) Tan IIA-NPs. Malvern Zetasizer 3000 HSA zeta potential measurement of (E) blank NPs and (F) Tan IIA-NPs.
Abbreviations: NPs, nanoparticles; Tan IIA-NPs, tanshinone IIA liquid NPs.
Stability study of Tan IIA-NPs
Accelerated testing
When exposed to the conditions of 60°C or room temperature with 4,500±500 lx for 10 days, there was no significant difference of physical appearance between each group (). The decrease of drug content from 97.86% to 94.03% indicated that the elevation of temperature may not significantly affect the chemical stability of the Tan IIA-NPs. However, the content of Tan IIA-NPs declined from 97.86% to 66.79% under the 4,500±500 lx ray of light for 10 days, indicating that Tan IIA was unstable in light. Meanwhile, the physical appearance of Tan IIA-NPs underwent a change from an orange-yellow appearance to a milky appearance, implying that the light may have induced degradation of the Tan IIA.
Table 3 Characterization of Tan IIA-NPs stored under 60°C and room temperature with 4,500±500 lx for 10 days (n=3)
Long-term stability
It is essential to investigate the long-term stability of a lipid NP system under a practical condition. After 12 months, the mean particle size of the Tan IIA-NPs slightly increased, while pH value, zeta potential, and drug content were slightly decreased (), but did not change significantly. Tan IIA-NPs kept an orange-yellow appearance with no creaming, coalescence, or visible droplets observed during the storage.
Table 4 Characterization of Tan IIA-NPs stored at 25°C±2°C away from light during 12 months (n=3)
Safety study of Tan IIA-NPs
Bacterial endotoxin test
shows the content of bacterial endotoxins in each batch. The content of bacterial endotoxin in each batch was less than the bacterial endotoxin limited value, suggesting that the steam pressure sterilization method is an ideal way for Tan IIA-NPs to control the content of bacterial endotoxin.
Table 5 The content of bacterial endotoxin in each batch (n=10)
Acute toxicity study
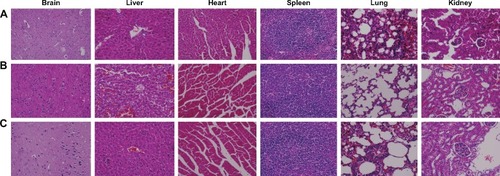
None of the animals showed visual signs of fatigue or discomfort and body weight slowly increased during the 2-week period (). The hematological results show that the chosen hematology markers such as white blood cells, red blood cells, platelets, and lymphocytes (%) in the groups treated with the Tan IIA-NPs and blank NPs appeared to be normal compared with the group with 0.9 g/dL natrium chloride. The liver function markers including aspartate transaminase activity, alanine transaminase activity, and total bilirubin concentration in the Tan IIA-NP and blank NP groups showed no difference compared with the group with 0.9 g/dL natrium chloride. The kidney function markers including blood urea nitrogen, serum creatinine, blood urea, and blood uric acid in the Tan IIA-NP and blank NP groups showed no difference compared with the group with 0.9 g/dL natrium chloride (). The histological toxicity results are shown in . Major tissues including the heart, liver, spleen, lung, and kidney showed no obvious lesions in any of the tested animals. The results suggested that neither the drug carrier (drug-free NPs) nor the Tan IIA had obvious acute toxicity to the mice.
Table 6 Effects on hematology, liver function, and kidney function parameters in healthy BALB/c mice determined by acute toxicity study (n=20)
Figure 4 The change of body weight (g) of mice before and after administration of corresponding solutions over 14 days.
Notes: Body weight (g) of mice in each group slowly increased during the 2-week period. There was no significant difference in body weight compared with the saline group.
Abbreviations: NPs, nanoparticles; Tan IIA-NPs, tanshinone IIA liquid NPs.
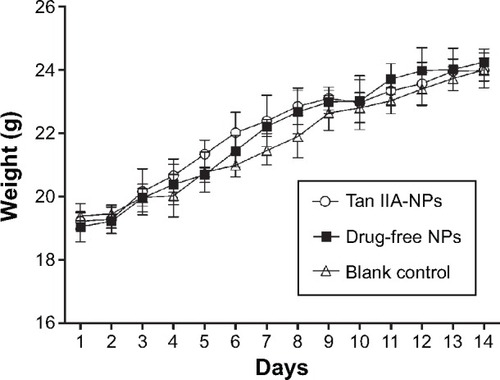
Figure 5 Histological staining of excised organs from healthy BALB/c mice following intravenous administration three times within 24 hours with (A) 0.9 g/dL natrium chloride, (B) drug-free NPs, or (C) Tan IIA-NPs.
Note: Representative images of organ sections were at 400× magnification.
Abbreviations: NPs, nanoparticles; Tan IIA-NPs, tanshinone IIA liquid NPs.
Intravenous administration of Tan IIA-NPs decreases adhesion formation
summarizes the scores for intra-abdominal adhesions on postoperative day 7 of rats. The intravenous administration of HD, MD, and LD Tan IIA-NPs showed significantly lower adhesion scores than in the vehicle group. What calls for special attention was that drug-free NPs had no effect on decrease of adhesion formation, indicating that this case might be attributable to Tan IIA effect. Compared with vehicle-treated rats, the HD group exhibited a 73% reduction in adhesion formation, the MD group exhibited a 53% reduction, and the LD group exhibited a 36% reduction in adhesion formation.
Table 7 Intra-abdominal adhesion scores of groups (n=15)
Tan IIA-NPs increased tPA activity in the peritoneum
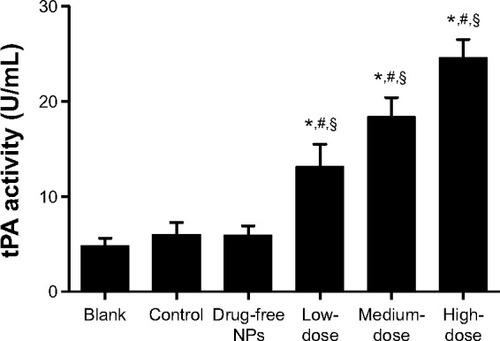
At the 7-day time point, the peritoneal fluid of the rats in each group was collected to detect tPA activity. The administration of Tan IIA-NPs increased tPA activity in the peritoneal lavage fluid at 7 days after surgery (). tPA activity in the HD, MD, and LD Tan IIA-NP groups was, respectively, 119%, 206%, and 309% higher than in the control group and 171%, 279%, and 408% than in controls at 7 days. Meanwhile, drug-free NPs showed no effect on tPA activity.
Figure 6 Effects of tPA activity in intraperitoneal lavage fluid.
Notes: High, medium and low dose groups were administered with 10, 5 and 2.5 mg/kg Tan IIA-NPs via tail vein injection, respectively. High- (n=15), medium(n=15), and low-dose (n=15) groups showed a significant increase in tPA activity in peritoneal fluid compared with the control, blank, and drug-free NP groups. *P<0.05 compared with blank; #P<0.05 compared with control; §P<0.05 compared with drug-free NPs.
Abbreviations: NPs, nanoparticles; tPA, tissue-type plasminogen activator.
Tan IIA-NPs increased the tPA/PAI value in the peritoneal tissues
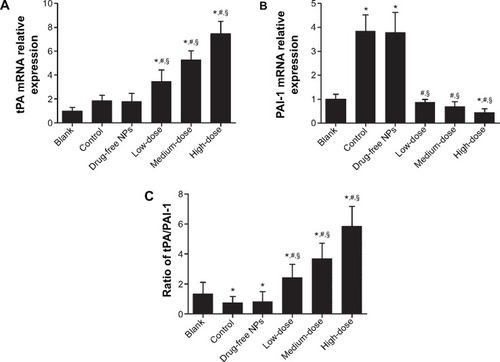
When the animals were sacrificed, the ischemic button tissues in the abdomen of each rat were collected. The total RNA of the ischemic button tissues was isolated and analyzed by qRT-PCR, and the results showed a significant increase in tPA mRNA expression levels in Tan IIA-NP-treated animals and a significant decrease in PAI mRNA expression levels in the HD and MD Tan IIA-NP-treated animals (). However, there was no significant difference in PAI mRNA expression levels compared with the vehicle-treated group. As shown in , the ratio of protein level of tPA/PAI in the Tan IIA-NP-treated animals was significantly higher than in the vehicle-treated animals and blank controls; in contrast, the tPA/PAI value in vehicle-treated animals was significantly lower than in the blank controls.
Figure 7 tPA mRNA expression (A), PAI-1 mRNA expression (B), and the ratio of protein expression level of tPA/PAI (C) in peritoneal tissues.
Notes: High, medium and low dose groups were administered with 10, 5 and 2.5 mg/kg Tan IIA-NPs via tail vein injection, respectively. Relative expression levels of tPA and PAI-1 mRNAs are normalized against β-actin. The ratio of protein expression level of tPA/PAI was detected by enzyme-linked immunosorbent assay and the ratio was evaluated using the following formula: ratio of tPA/PAI = (level of tPA protein/total protein)/(level of PAI protein/total protein). Results are expressed as a percentage of controls and shown as mean ± standard deviation (n=5). *P<0.05 compared with blank; #P<0.05 compared with control; §P<0.05 compared with drug-free NPs.
Abbreviations: NPs, nanoparticles; tPA, tissue-type plasminogen activator.
Tan IIA-NPs decreased the expression of TGF-β1 and collagen I in the peritoneal tissues
On postoperative day 7, compared with the vehicle group, the TGF-β1 () and collagen I () expression in the peritoneal tissues of the Tan IIA-NP HD, MD, and LD groups (P<0.05) were significantly reduced. The TGF-β1 and collagen I expressions in the vehicle group were significantly higher than in the blank control group. Moreover, there were no significant differences between the vehicle group and drug-free NP group.
Figure 8 TGF-β1 expression in the peritoneal tissues after 7 days of treatment, detected by immunohistochemistry.
Notes: High, medium and low dose groups were administered with 10, 5 and 2.5 mg/kg Tan IIA-NPs via tail vein injection, respectively. Representative images (at 200× magnification) of peritoneal tissues that were stained immunohistochemically with anti-TGF-β1 antibody. (A) Blank control group. (B) Control group. (C) Drug-free group. (D) Low-dose group. (E) Medium-dose group. (F) High-dose group. (G) Quantitative assay of OD from five randomly selected fields. The results are presented as mean ± standard deviation (n=5). *P<0.05 compared with blank; #P<0.05 compared with control; §P<0.05 compared with drug-free NPs.
Abbreviations: NPs, nanoparticles; OD, optic density; TGF-β1, transforming growth factor-β1.
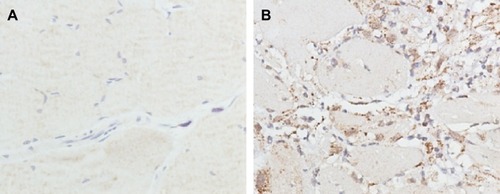
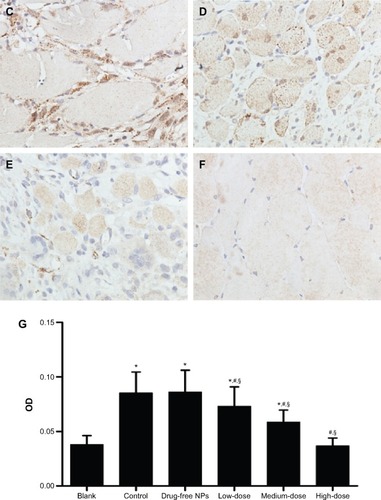
Figure 9 Collagen I expression in the peritoneal tissues after 7 days of treatment, detected by immunohistochemistry.
Notes: High, medium and low dose groups were administered with 10 mg/kg, 5 mg/kg and 2.5 mg/kg Tan IIA-NPs via tail vein injection, respectively. Representative images (at 200× magnification) of peritoneal tissues that were stained immunohistochemically with anti-collagen I antibody. (A) Blank control group. (B) Control group. (C) Drug-free group. (D) Low-dose group. (E) Medium-dose group. (F) High-dose group. (G) Quantitative assay of OD from five randomly selected fields. The results are presented as mean ± standard deviation (n=5). *P<0.05 compared with blank; #P<0.05 compared with control; §P<0.05 compared with drug-free NPs.
Abbreviations: NPs, nanoparticles; OD, optic density.
Tan IIA-NP administration does not impair anastomotic healing
On postoperative day 7, Tan IIA-NP-treated and control animals were killed and the previously created colonic anastomoses were excised, with care taken not to cause iatrogenic enterotomies. These 3–4 cm segments of colon (with the anastomoses in the middle) were then insufflated with air until perforation, and the burst pressures were measured. There was no significant difference between Tan IIA-NP-treated groups and the control group ().
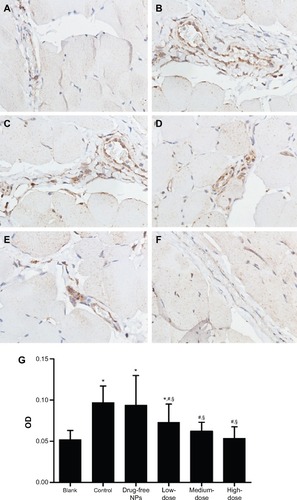
Figure 10 Effect of Tan IIA-NPs on wound healing in the model of anastomotic healing.
Notes: The results are presented as mean ± standard deviation (n=5). High- (n=5), medium- (n=5), and low-dose (n=5) groups showed no significance in burst pressure compared with the control and drug-free NP groups.
Abbreviations: NPs, nanoparticles; Tan IIA-NPs, tanshinone IIA liquid NPs.
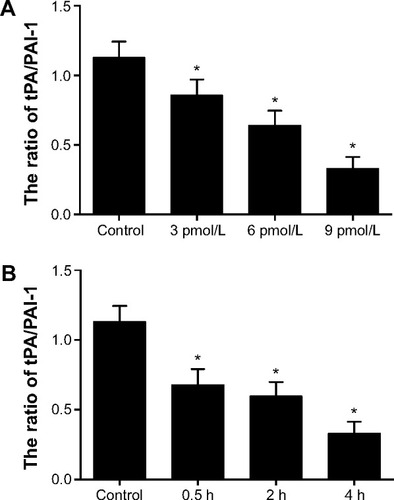
Tan IIA-NPs undermined the downregulation effect of TGF-β1 on tPA/PAI value in HMrSV5 cells
TGF-β1 treatment significantly increased the level of the PAI and decreased the level of tPA in a time- and dose-dependent manner compared with the control group (). The levels of tPA/PAI induced by 9 pmol/L TGF-β1 for 4 hours were the lowest.
Figure 11 Effect of TGF-β1 on the ratio of tPA/PAI-1 in HMrSV5 cells.
Notes: (A) Change of the ratio of tPA/PAI-1 induced by different concentrations of TGF-β1 for 4 hours. (B) Change of the ratio of tPA/PAI-1 induced by 9 pmol/L TGF-β1 at 0.5-, 2-, and 4-hour points. Data are expressed as mean ± standard deviation (n=3). *P<0.05 compared with control.
Abbreviations: PAI-1, plasminogen activator inhibitor-1; TGF-β1, transforming growth factor-β1; tPA, tissue-type plasminogen activator.
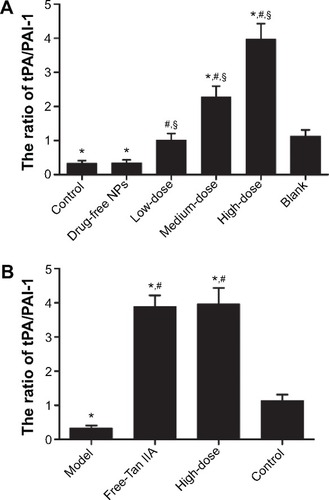
After incubation with Tan IIA-NPs or free-Tan IIA for 24 hours, the level of tPA was increased and PAI was decreased. The tPA/PAI value was markedly increased in the free-Tan IIA group () and in a dose-dependent manner by Tan IIA-NP () treatment. At the same time, the tPA/PAI value in the free-Tan IIA and HD Tan IIA-NP group showed no statistical significance.
Figure 12 Effect of free-Tan IIA (A) and Tan IIA-NPs (B) on the ratio of tPA/PAI-1 in HMrSV5 cells induced by TGF-β1.
Notes: High, medium and low dose groups were treated with 20, 10, and 5 μg/mL Tan IIA-NPs, respectively. And free-Tan IIA group was treated with 20 μg/mL Tan IIA. Data are expressed as mean ± standard deviation (n=3). *P<0.05 compared with control; #P<0.05 compared with model; §P<0.05 compared with blank.
Abbreviations: NPs, nanoparticles; Tan IIA, tanshinone IIA; Tan IIA-NPs, Tan IIA liquid NPs; PAI-1, plasminogen activator inhibitor-1; TGF-β1, transforming growth factor-β1; tPA, tissue-type plasminogen activator.
Tan IIA-NPs decreased the expression of TGF-β1 and collagen I in HMrSV5 cells induced by TGF-β1
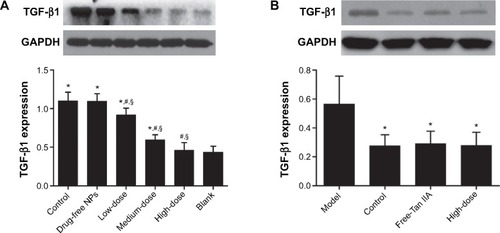
The results of Western blot analysis showed that the protein expression of TGF-β1 in HMrSV5 cells was significantly decreased by the HD, MD, and LD Tan IIA-NPs () and in the free-Tan IIA group () compared with the control group. There was no significant difference between the HD Tan IIA-NP and free-Tan IIA groups. The suppression of TGF-β1 protein expression in HMrSV5 cells was in a dose-dependent manner.
Figure 13 Effect of Tan IIA-NPs (A) and free-Tan IIA (B) on the TGF-β1 protein expression in HMrSV5 cells.
Notes: High, medium and low dose groups were treated with 20, 10, and 5 μg/mL Tan IIA-NPs, respectively. And free-Tan IIA group was treated with 20 μg/mL Tan IIA. Data are expressed as mean ± standard deviation (n=3). *P<0.05 compared with blank; #P<0.05 compared with control; §P<0.05 compared with drug-free NPs.
Abbreviations: NPs, nanoparticles; Tan IIA, tanshinone IIA; Tan IIA-NPs, Tan IIA liquid NPs; TGF-β1, transforming growth factor-β1.
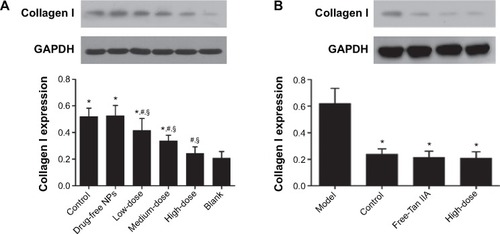
The collagen I protein expression in HMrSV5 cells decreased along with the Tan IIA-NPs in a dose-dependent manner. Compared with the control group, the HD and MD Tan IIA-NP () and free-Tan IIA groups () had significantly decreased expression of collagen I protein. The expression of collagen I in the LD Tan IIA-NP group was ameliorated, but there was no significant difference.
Figure 14 Effect of Tan IIA-NPs (A) and free-Tan IIA (B) on collagen I protein expression in HMrSV5 cells.
Notes: High, medium and low dose groups were treated with 20, 10, and 5 μg/mL Tan IIA-NPs, respectively. And free-Tan IIA group was treated with 20 μg/mL Tan IIA. Data are expressed as mean ± standard deviation (n=3). *P<0.05 compared with blank; #P<0.05 compared with control; §P<0.05 compared with drug-free NPs.
Abbreviations: NPs, nanoparticles; Tan IIA, tanshinone IIA; Tan IIA-NPs, Tan IIA liquid NP; TGF-β1, transforming growth factor-β1.
Discussion
In addition to meticulous surgical technique, synthetic solid barrier is one of the most widely used approaches to prevent adhesion formation. However, this method has not proven to be uniformly efficacious under all surgical conditions.Citation2,Citation9 In our previous study, Tan IIA was a potent postoperative adhesion preventer, but it proved to have low oral bioavailability in the dosage forms of tablet or capsule.Citation19 In order to enhance the bioavailability of Tan IIA, we developed an NP delivery system to prevent postoperative adhesion. In this study, we performed a series of experiments to show that the NP system is safe for intravenous administration and shows remarkable anti-adhesion efficacy. The results support the hypothesis that NPs may serve as an efficient Tan IIA delivery vehicle to prevent adhesion formation ().
The genesis of adhesion formation is a kind of trauma that results in the initiation of an inflammatory response.Citation10,Citation11,Citation18,Citation30 There is production of a fibrin-rich inflammatory exudate and excessive deposition of extracellular matrix (ECM) components including collagens, which organize to form dense adhesions. Decreased peritoneal fibrinolysis due to an imbalance of tPA and PAI has been shown to play a pivotal role in the formation of postoperative adhesions. We found the tPA/PAI value in TanIIA-NP-treated animals was significantly higher than in the animals of the control or vehicle group (). The tPA has a high affinity for fibrin, thereby strongly promoting the conversion of inactive plasminogen into active plasmin, which is highly effective in degrading fibrin into fibrin degradation products.Citation31,Citation32 The PAI-1 protein, which appears to be an acute-phase reactant protein,Citation33 is the most important inhibitor of tPA and uPA.Citation34,Citation35 Both Falk et al and Segura et al demonstrated that the RNA interference-mediated downregulation of the PAI-1 gene in rats can prevent abdominal adhesion formation.Citation11,Citation36
Our experiments proved that Tan IIA-NPs reduced intra-abdominal adhesion formation by upregulating fibrinolysis activity in rats, because tPA activity level in the peritoneal lavage fluid was increased significantly in the Tan IIA-NP-treated groups (). Studies showed that upregulating fibrinolysis could lead to a decline in the expression of collagen I protein, which is the most important component of ECM.Citation37,Citation38 In the vehicle group, collagen I expression in the peritoneal tissues was significantly higher than that in the control group, indicating that excessive ECM components were already deposited, but could be reduced by administration of Tan IIA-NPs (). We also found that the mRNA expression level of tPA was increased in the peritoneal tissue of the Tan IIA-NP-treated animals, and, in contrast, Tan IIA-NPs significantly decreased the PAI mRNA expression level (). This effect may be mediated through the inhibition of TGF-β1, as the evidence showed that Tan IIA-NPs reversed the upregulation of the value of PAI and downregulation of the value of tPA, which was induced by TGF-β1. A number of studies have shown that the expression level of TGF-β1 in adhesion tissues was significantly higher than that in normal peritoneal tissue.Citation13,Citation14,Citation39 Overexpressed TGF-β1 may increase the expression of PAI and TIMP-1, and simultaneously decrease the level of MMP-1 in the peritoneal mesothelial cell, which may result in decreased peritoneal fibrinolytic capacity and excessive deposition of ECM, and finally organizes to form dense adhesions.Citation13,Citation14 PAI-1 is positioned downstream of the TGF-β1/Smad signal pathway.Citation40,Citation41 TGF-β1 can increase the production of PAI-1 through the phosphorylation of Smad2/3 and R-Smad/Smad4 complex in myofibroblasts.Citation42 In the in vivo study, Tan IIA-NPs decreased the TGF-β1 protein expression level remarkably compared with the control group (). It is noteworthy that this treatment does not impair anastomotic healing, as the evidence showed that there was no statistical significance of the burst pressure in each treatment group compared with the control (). In the in vitro study, treatment with TGF-β1 significantly increased the level of PAI and collagen I, but decreased the level of tPA in a time- and dose-dependent manner in the HMrSV5 cells (, , and ). After incubation with Tan IIA-NPs or free-Tan IIA, the protein expressions of TGF-β1 and collagen I were significantly decreased ( and ), which indicated that the effect of Tan IIA-NPs in preventing adhesion formation was comparable to that of the free-Tan IIA. Our experiments showed that TGF-β1 may tip the balance between tPA and PAI, resulting in decreased peritoneal fibrinolytic capacity. However, it could be reversed by administration of Tan IIA-NPs.
Conclusion
In this study, we designed a novel drug delivery vehicle that shows good stability for storage and safety for intravenous administration to prevent postoperative peritoneal adhesions. Our data provide direct evidence from both in vivo and in vitro studies that Tan IIA-NPs reduce intra-abdominal adhesion formation by modulating the peritoneal fibrinolytic environment. Whether Tan IIA-NPs prove to be therapeutically efficacious in preventing adhesion in humans remains to be investigated. Moreover, this research has identified that this therapeutic effect may be realized by the TGF-β signal pathway. This signaling pathway offers many potential therapeutic approaches, and consideration should perhaps be given to widening the application of existing drugs known to modulate the TGF-β signal pathway.
Acknowledgments
This study was supported by the National Natural Science Foundation of China (number 30873271), the Science and Technology Planning Project of Guangdong Province, People’s Republic of China (number 2012A080204020), and the Science Foundation of Nanfang Hospital, Southern Medical University, Guangzhou, People’s Republic of China (number G201109, 201366).
Disclosure
The authors report no conflicts of interest in this work.
References
- HolmdahlLRisbergBAdhesions: prevention and complications in general surgeryEur J Surg199716331691749085057
- SchnürigerBBarmparasGBrancoBCLustenbergerTInabaKDemetriadesDPrevention of postoperative peritoneal adhesions: a review of the literatureAm J Surg2011201111112120817145
- De VrieseASTiltonRGMortierSLameireNHMyofibroblast transdifferentiation of mesothelial cells is mediated by RAGE and contributes to peritoneal fibrosis in uraemiaNephrol Dial Transplant20062192549255516757496
- López-CabreraMAguileraAAroeiraLSEx vivo analysis of dialysis effluent-derived mesothelial cells as an approach to unveiling the mechanism of peritoneal membrane failurePerit Dial Int2006261263416538870
- De VrieseASThe John F. Maher Recipient Lecture 2004: Rage in the peritoneumPerit Dial Int200525181115770917
- Jiménez-HeffernanJAAguileraAAroeiraLSImmunohistochemical characterization of fibroblast subpopulations in normal peritoneal tissue and in peritoneal dialysis-induced fibrosisVirchows Arch2004444324725614749928
- BolandGMWeigelRJFormation and prevention of postoperative abdominal adhesionsJ Surg Res2006132131216457846
- AaronsCBCohenPAGowerAStatins (HMG-CoA reductase inhibitors) decrease postoperative adhesions by increasing peritoneal fibrinolytic activityAnn Surg2007245217618417245169
- LiakakosTThomakosNFinePMDervenisCYoungRLPeritoneal adhesions: etiology, pathophysiology, and clinical significance. Recent advances in prevention and managementDig Surg200118426027311528133
- CheongYCLairdSMLiTCSheltonJBLedgerWLCookeIDPeritoneal healing and adhesion formation/reformationHum Reprod Update20017655656611727864
- FalkKBjörquistPStrömqvistMHolmdahlLReduction of experimental adhesion formation by inhibition of plasminogen activator inhibitor type 1Br J Surg200188228628911167882
- BrantonMHKoppJBTGF-beta and fibrosisMicrobes Infect19991151349136510611762
- HolmdahlLKotseosKBergströmMFalkPIvarssonMLCheginiNOverproduction of transforming growth factor-beta1 (TGF-beta1) is associated with adhesion formation and peritoneal fibrinolytic impairmentSurgery2001129562663211331455
- CheginiNKotseosKZhaoYDifferential expression of TGF-beta1 and TGF-beta3 in serosal tissues of human intraperitoneal organs and peritoneal adhesionsHum Reprod20011661291130011387308
- DongXDongJZhangRFanLLiuLWuGAnti-inflammatory effects of tanshinone IIA on radiation-induced microglia BV-2 cells inflammatory responseCancer Biother Radiopharm200924668168720025548
- CaoEHLiuXQWangJJXuNFEffect of natural antioxidant tanshinone II-A on DNA damage by lipid peroxidation in liver cellsFree Radic Biol Med19962068018068728027
- FangJXuSWWangPTanshinone II-A attenuates cardiac fibrosis and modulates collagen metabolism in rats with renovascular hypertensionPhytomedicine2010181586420638255
- WangCLiXMengXZhouJQinFHouLPrevention of experimental postoperative peritoneal adhesions through the intraperitoneal administration of tanshinone IIAPlanta Med2014801296997325089738
- YuXYLinSGZhouZWRole of P-glycoprotein in the intestinal absorption of tanshinone IIA, a major active ingredient in the root of Salvia miltiorrhiza BungeCurr Drug Metab20078432534017504222
- LiuJZhuJDuZQinBPreparation and pharmacokinetic evaluation of Tashinone IIA solid lipid nanoparticlesDrug Dev Ind Pharm200531655155616109628
- HaoHWangGCuiNLiJXieLDingZPharmacokinetics, absorption and tissue distribution of tanshinone IIA solid dispersionPlanta Med200672141311131717024606
- LiHLZhangZYMaLLChenXYPreparation of tanshinone micro-emulsion and its absorption in rat intestine in situZhongguo Zhong Yao Za Zhi2007321110241027 Chinese17672333
- DateAANagarsenkerMSParenteral microemulsions: an overviewInt J Pharm20083551–2193018295991
- LiXQinFYangLMoLLiLHouLSulfatide-containing lipid perfluorooctylbromide nanoparticles as paclitaxel vehicles targeting breast carcinomaInt J Nanomedicine201493971398525170267
- ChuTZhangQLiHDevelopment of intravenous lipid emulsion of tanshinone IIA and evaluation of its anti-hepatoma activity in vitroInt J Pharm20124241–2768822226873
- LanzaGMWallaceKDScottMJA novel site-targeted ultrasonic contrast agent with broad biomedical applicationCirculation19969412333433408989148
- NairSKBhatIKAuroraALRole of proteolytic enzyme in the prevention of postoperative intraperitoneal adhesionsArch Surg197410868498534829809
- LimRMorrillJMPrushikSGAn FDA approved neurokinin-1 receptor antagonist is effective in reducing intraabdominal adhesions when administered intraperitoneally, but not orallyJ Gastrointest Surg200812101754176118709513
- de HinghIHde ManBMLommeRMvan GoorHHendriksTColonic anastomotic strength and matrix metalloproteinase activity in an experimental model of bacterial peritonitisBr J Surg200390898198812905552
- di ZeregaGSCampeauJDPeritoneal repair and post-surgical adhesion formationHum Reprod Update20017654755511727863
- CollenDLijnenHRMolecular basis of fibrinolysis, as relevant for thrombolytic therapyThromb Haemost19957411671718578451
- CollenDOn the regulation and control of fibrinolysis. Edward Kowalski Memorial LectureThromb Haemost198043277896450468
- de BoerJPAbbinkJJBrouwerMCPAI-1 synthesis in the human hepatoma cell line HepG2 is increased by cytokines – evidence that the liver contributes to acute phase behaviour of PAI-1Thromb Haemost19916521811851711245
- KruithofEKTran-ThangCRansijnABachmannFDemonstration of a fast-acting inhibitor of plasminogen activators in human plasmaBlood19846449079136434006
- van MourikJALawrenceDALoskutoffDJPurification of an inhibitor of plasminogen activator (antiactivator) synthesized by endothelial cellsJ Biol Chem19842592314914149216438106
- SeguraTSchmokelHHubbellJARNA interference targeting hypoxia inducible factor 1alpha reduces post-operative adhesions in ratsJ Surg Res2007141216217017561118
- BrochhausenCSchmittVHPlanckCNCurrent strategies and future perspectives for intraperitoneal adhesion preventionJ Gastrointest Surg20121661256127422297658
- FriedmanSLHepatic fibrosis – overviewToxicology2008254312012918662740
- HobsonKGDeWingMHoHSWolfeBMChoKGreenhalghDGExpression of transforming growth factor beta1 in patients with and without previous abdominal surgeryArch Surg2003138111249125214609876
- TahashiYMatsuzakiKDateMDifferential regulation of TGF-beta signal in hepatic stellate cells between acute and chronic rat liver injuryHepatology2002351496111786959
- DerynckRZhangYESmad-dependent and Smad-independent pathways in TGF-beta family signallingNature2003425695857758414534577
- YangYYangSChenMZhangXZouYZhangXCompound Astragalus and Salvia miltiorrhiza Extract exerts anti-fibrosis by mediating TGF-beta/Smad signaling in myofibroblastsJ Ethnopharmacol2008118226427018502066