
 ?Mathematical formulae have been encoded as MathML and are displayed in this HTML version using MathJax in order to improve their display. Uncheck the box to turn MathJax off. This feature requires Javascript. Click on a formula to zoom.
Abstract
The present work investigated the topical delivery potential of nanoemulsion gel loaded with curcumin (CR). CR nanoemulsion (CR-NE) was prepared by spontaneous emulsification method using oil (Labrafac PG/glyceryl triacetate), surfactant:cosurfactant (Smix) (tween 80/polyethylene glycol [PEG] 400) and water. The pseudo-ternary phase diagrams were constructed and thermodynamic stability testing was performed. Droplet size and zeta potential were evaluated using photon correlation spectroscopy and transmission electron spectroscopy. Six formulations selected with an average droplet size ≤70±2.72 nm showed a fourfold increase in skin permeation as compared to crude CR solution in oil. The formulation CR-NE4 having a flux of 117.04±2.32 µg/cm2/h and with maximum retention (42.87%) was selected, characterized (droplet size =41.13±3.34 nm and zeta potential =−33.1±1.45 mV), and incorporated into gel using carbopol-980 (1% w/v). Skin dynamics analyzed by confocal laser scanning microscopy showed maximum deposition of CR up to a depth of 86.98 µm and was in concordance with differential scanning calorimetry and Fourier transform infrared spectroscopy studies that confirmed lipid bilayer disruption, enhancing permeation. A 28-day anti-arthritic evaluation (body weight, paw edema, tibiotarsal joint thickness, TNF-α and IL-1β levels, and histopathology) on Freund’s complete adjuvant induced arthritic rat model after topical application of CR-NE gel in Wistar rats demonstrated substantial reversal of arthritic symptoms. Thus, CR-NE gel possesses potential for therapeutic effects locally in inflammatory arthritic disorders with improved topical bioavailability.
Introduction
Arthritic disorders are rheumatic diseases that are a major cause of locomotory dysfunction and disability in adult human population.Citation1 The most prevalent forms of these articular diseases being osteoarthritis and rheumatoid arthritis. Rheumatoid arthritis is an auto immune disorder caused due to trigger of pro-inflammatory cytokines (eg, TNF-α and IL-1β) while osteoarthritis is a degenerative joint disease characterized by the progressive breakdown of articular cartilage. The pharmacotherapy for various forms of arthritis is achieved through symptomatic treatment with simple analgesics, steroidal and non-steroidal anti-inflammatory drugs, classically as the first line treatment followed by intra-articularly injected glucocorticoids and hyaluronic acid preparations as the disease progresses.Citation2 The mainstay treatment, however has recurrent and potentially harmful side effects, low efficacy, and poor patient compliance.Citation3 Several anti-inflammatory drugs have been withdrawn by the US Food and Drug Administration (FDA) due to severe cardiovascular side effects, and consequently, plant-based agents are being promoted for the management of arthritis.Citation4 Curcumin (CR), the yellow coloring agent found in turmeric (Curcuma longa, family Zingiberaceae), is a diferuloylmethane [1,7-Bis(4-hydroxy-3-methoxyphenyl)-1,6-heptadiene-3,5-dione] and has been used for centuries as a spice in the Indian subcontinent.Citation5 It has been reported to have a wide range of activities like anti-inflammatory, anti-oxidant, anti-parasitic, anti-mutagenic, anti-cancer, and anti-arthritic (both in vitro and in vivo), as suggested by many studies.Citation6–Citation12 It has also been used in wound healing and as dietary supplement for arthritis in traditional medicine. The wide use of this drug, however, is limited by poor oral bioavailability due to extensive hepatic metabolism, low gastrointestinal absorption, and rapid elimination.Citation13–Citation16 Several nanoformulations of CR have been extensively investigated over the last decade like liposomes, nanoparticles, nanoconjugates, and nanoemulsions, which have been aimed at enhancing bioavailability by solubilization or encapsulation thus protecting against hydrolysis and achieving sustained release at the site of targeting.Citation17–Citation22 However, much attention has not been given to the topical formulation of CR which will aim at controlling local macrophage activity in synovial membrane by inhibiting the production of cytokines in arthritis related inflammation. Overcoming low oral bioavailability of CR is a big challenge, and it being highly lipophilic in nature (log P=2.92) shows good skin retention, therefore, topical delivery was intriguing. Nanoemulsion as a topical carrier system is very suitable with merits like low skin irritation, excellent permeation, and high drug-loading capacity as compared to other colloidal carriers.Citation23,Citation24 However, due to low retention at the site of application by virtue of low viscosity of nanoemulsion system and inconvenient application, it is often converted into a gel form.Citation25–Citation28
Hence, in the present study a gel based colloidal carrier system loaded with CR intended to be used as adjunct therapy for the treatment of inflammation related to arthritic disorders was developed and investigated on a Freund’s complete adjuvant (FCA)-induced arthritic rat model. A mechanistic insight to the topical targeting potential of nanoemulsion gel (NEG) was investigated through skin dynamic study by differential scanning calorimetry (DSC), FT-IR microscopy and confocal laser scanning microscopy (CLSM) analysis of the treated rat skin.
Materials and methods
CR was purchased from Sigma Aldrich Co. (St Louis, MO, USA). Tween 80, and polyethylene glycol (PEG) 400 was procured from Hi-Media (Mumbai, India). Labrafac PG and Labrasol were generously gifted by Gattefosse, Bad Krozingen, Germany. Glyceryl triacetate (triacetin) was purchased from Thomas Baker, Mumbai, India. High performance liquid chromatography (HPLC) grade methanol and acetonitrile were purchased from Merck Millipore, India. MilliQ water produced in-house by MilliQ water purification system (EMD Millipore, Billerica, MA, USA) was used for all the experiments. All other chemicals and reagents were of analytical grade.
Solubility studies for excipient screening
Screening of oils
In order to select the most suitable oil, solubility studies were conducted. An excess quantity of the drug (CR) was added to 1 mL of different oils (viz oleic acid, coconut oil, castor oil, sefsol, Labrafac PG, almond oil, isostearyl isostearate, olive oil, ethyl oleate, triacetin, arachis oil, sesame oil, and Miglyol 810n) taken separately in vials, until the loss of visual transparency. The vials were tightly stoppered and were continuously stirred for 24 hours at 37°C±0.5°C on a mechanical shaker. Samples were examined and the solubility was determined by the developed reversed-phased (RP)-HPLC analysis.
Screening of surfactants and co-surfactants
Similarly, for selection of the ideal surfactant tween 80, tween 60, tween 20, and Labrasol were tried. Likewise, PEG 400, Plurol Oleique, propylene glycol, and Transcutol P were chosen as co-surfactants and drug solubility was determined as described under “Screening of oils”.
Construction of pseudo-ternary phase diagrams
Pseudo-ternary phase diagrams were constructed using aqueous titration method which includes stepwise addition of water to each weight ratio of oil and surfactants, and then mixing the components with the help of vortex mixer at 25°C.Citation29 Surfactant:co-surfactant (Smix) ratios of 1:0, 1:1, 1:2, 1:3, 2:1, 3:1, and 4:1 were tried. Twelve different combinations in different weight ratios of oil and Smix, 1:9, 1:8, 1:7, 1:6, 1:5, 1:4, 1:3, 1:2, 1:1, 6:4 (1:0.7), 7:3 (1:0.43), and 9:1, were taken for each Smix ratio. For the determination of existence zone of nanoemulsion, the oil and Smix mixture was titrated with distilled water until a clear, isotropic and thermodynamically-stable dispersion with low viscosity was obtained. The volume of water was then recorded. The pseudo-ternary phase diagrams were constructed by plotting water phase, oil phase and Smix phase used in the experiment.
Thermodynamic stability testing of nanoemulsion
The best ratios from pseudo-ternary phase diagram having oil content 9%–12%, and Smix 50%–55% were selected and further subjected to thermodynamic stability evaluation. Parameters like opalescence, creaming and phase separation were observed.
Centrifugation
The formulations were centrifuged at 3,000 rpm at room temperature for 30 minutes and observed.
Heating cooling cycle
The formulations were stored at two different temperatures of 4°C–48°C for not less than 48 hours. Six cycles of this exposure were performed and stability was noted.
Freeze-thaw cycle
The same formulation was subjected to freeze-thaw cycle at temperature ranging from −21°C to 25°C for not less than 48 hours. The experiment was again performed six times and formulation was observed visually.
Formulation of CR-loaded nanoemulsion
CR-loaded nanoemulsions were prepared by first dissolving CR (0.25% w/v) in oil mix (Labrafac PG and glyceryl triacetate in equal ratio) and then slowly adding the required weight of Smix (tween 80 and PEG 400) and water, as calculated from the pseudo-ternary phase diagram, under constant magnetic stirring.
Characterization of CR nanoemulsion (CR-NE)
Droplet size, size distribution, and zeta potential
Droplet size and size distribution was determined using photon correlation spectroscopy that analyzes the fluctuations in light scattering due to Brownian motion of the droplets using Zetasizer Nano-ZS (Malvern Instruments, Malvern, UK). About 0.1 mL of the formulation was suitably diluted with water, mixed thoroughly with vigorous shaking and light scattering was monitored at 25°C at an angle of 90°. Zeta potential of the formulation was also determined using the same instrument.
Transmission electron microscopy (TEM)
TEM was performed to see the droplets’ morphology. A drop of the nanoemulsion was suitably diluted with distilled water (1:100), and applied on carbon-coated copper grid, negatively stained with 2% phosphotungstic acid and left for 30 seconds. Excess of phosphotungstic acid was removed by absorbing on a filter paper and the grid was analyzed using the Morgagni 268D transmission electron microscope (FEI Company, Hillsboro, OR, USA) operated at 60–80 kV at 1,550× magnification.
RP-HPLC
A simple RP-HPLC method was developed and validated for the estimation of CR in the bulk drug and nanoemulsion formulation. Shimadzu HPLC equipment comprising of quaternary LC-10AVP pumps, SPD-10AVP column oven, a variable-wavelength programmable UV-visible detector, and an-SCL-10AVP system controller consisting of 25 cm ×4.6 mm internal diameter (ID), 5-µm particle, 516 C18 DB reversed phase column (Supelco, Sigma-Aldrich, St Louis, MO, USA) was used. Mobile phase comprised of acetonitrile and 20 mM potassium dihydrogen orthophosphate (pH adjusted to 3.0) in the ratio 55:45 v/v, with a flow rate of 1 mL/min and injection volume of 20 µL. The detection wavelength was monitored at 420 nm. The concentration of drug was calculated by comparing the area peaks of unknown and standard samples with known concentrations.
Preparation of skin samples
Abdominal skin in full thickness was obtained from male Wistar rats weighing 224±14.2 g from Institutional Animal Ethical Committee of Jamia Hamdard, New Delhi, India after approval from animal ethics committee. The hair on the skin surface was carefully shaved off using electrical razor, subcutaneous tissue was surgically removed and dermis side was wiped with isopropyl alcohol. The skin was washed with distilled water and visually inspected for integrity. A 3.0×3.0 cm2 section of it was wrapped in aluminum foil and stored in a deep freezer at −20°C.
Ex vivo skin permeation and deposition study
Ex vivo permeation studies through rat skin were performed using an automated diffusion cell sampling system (SFDC6, Logan Instruments, Somerset, NJ, USA). Epidermal membrane samples were mounted onto the double-jacketed diffusion cells, 12 mL capacity and area 1.77 cm2, equilibrated at 37°C±0.5°C for 24 hours. Amongst the nanoemulsion formulations that passed thermodynamic stability tests, six formulations containing 0.25% w/v of CR each (CR-NE1, CR-NE2, CR-NE3, CR-NE4, CR-NE5, and CR-NE6), with particle size ≤70 nm and different Smix ratios were selected and applied on the skin surface in the donor compartment. Aliquot (500 µL) was withdrawn from the receptor compartment at designated time intervals (viz 1, 2, 4, 6, 8, 10, 12, and 24 hours) for 24-hour period and analyzed for drug content by the developed RP-HPLC method. Receiver volume was immediately replenished with the same amount of medium-mixture of acetate buffer (pH 5.5) and ethanol in a ratio 7:3. Ethanol was added to the buffer to maintain the sink conditions. All the operations were carried out in triplicate. For skin deposition study, the skin was collected from the diffusion cell after the end of permeation study and homogenized in tissue homogenizer, the drug was extracted as per the developed liquid-liquid extraction method and analyzed. A control formulation (crude curcumin solution [C-CR]) containing CR (0.25% w/v) in the same oil was used for all comparisons.
Data analysis of skin permeation
The cumulative amount of drug permeated through the unit surface area corresponding to time, t, was calculated and plotted as a function of time. The steady state rate of skin permeation, flux (Jss, µg/cm2/h) was calculated from the slope of the permeation graph and the intercepts on the x-axis corresponded to the lag time. The permeability coefficient Kp was also calculated from the flux using the following equations:Citation30
Preparation of CR-NEG and CR crude gel (CR-CG)
The formulation showing the lower permeation flux was selected as the optimized one and converted into gel. In 10 mL of the CR-NE, 1% w/v Carbopol-980 was dispersed slowly with the help of a magnetic stirrer and kept in dark for 24 hours for complete swelling. The dispersion was neutralized using triethanolamine and propylene glycol was added as a plasticizer to obtain the gel. CR solution in ethanol (0.25% w/v) was prepared and incorporated in Carbopol-980 (1% w/v) gel (CR-CG) for comparative mechanistic and in vivo analysis.
Skin dynamics study
The freshly-prepared rat abdominal skin was washed with phosphate buffered saline (PBS) pH 7.4 thrice and mounted over a Franz diffusion cell with its epidermis facing the upper surface and 1 g of CR-NEG or CR-CG was placed in the donor compartment and sealed with parafilm. The receptor chamber was filled with acetate buffer (pH 5.5) and ethanol mixture (7:3) and left for 24 hours under constant magnetic stirring.
DSC study of skin
Approximately 5 mg of the skin was weighed and taken individually from the CR-NEG and CR-CG-treated skin, respectively, washed with PBS, blot-dried and hermetically sealed in aluminum pans for DSC studies. The scanning was done on a DSC6, differential scanning calorimeter (PerkinElmer Inc., Waltham, MA, USA) at a scanning rate of 10°C/min over the temperature range of 30°C–400°C. A DSC scan of each sample served as control for itself and the changes in the structures of both the skins were assessed and compared.
FT-IR microscopy study of the skin
The FT-IR spectra of the treated skin was recorded using Varian 7000 FT-IR spectrometer in conjunction with an UMA 600 microscope and a 128×128 focal-plane array detectors (FPA) detector, facility at Advanced Instrumentation Research Facility (AIRF), Jawaharlal Nehru University, New Delhi, India. The skin samples, treated separately with CR-NEG and CR-CG as described above, were taken for analysis. Later on, the skin samples were cut across the perimeter of the diffusion cell area and washed with PBS and air dried. Skin slides were prepared and mounted on the stage of microscope with coverslip removed and the FT-IR spectra of treated skin discs were recorded.
CLSM study
After 24 hours of permeation study, the skin was removed and washed with ethanol. The treated area was cut and mounted over glass slide with coverslip over it. CLSM was carried out using laser confocal microscope with fluorescence correlation spectroscope, Olympus FluoView FV1000 (Olympus Corporation, Tokyo, Japan) with an argon laser beam at AIRF, Jawaharlal Nehru University, New Delhi. The fluorescent dye, Rhodamine B, being water-soluble, having an excitation wavelength of 520 nm, was incorporated in the CR-NEG to study drug deposition and penetration. CR, itself being fluorescent with an excitation wavelength of 420 nm gave blue fluorescence along with Rhodamine B which gave red fluorescence.
In vivo studies
Animal studies were carried out after approval from Institutional Animal Ethics Committee, Jamia Hamdard, New Delhi (Protocol number 965) and guidelines laid down by Committee for the Purpose of Control and Supervision of Experiments on Animals were duly followed. A total of 30 male Wistar rats, having an average body weight 240±15 g, were randomly divided into five groups consisting of six animals each. Group I served as healthy normal control, Group II consisted of untreated arthritis-induced negative control, Groups III, IV, and V consisted of arthritis-induced animals treated with diclofenac-containing marketed gel, CR-NEG and CR-CG, respectively. The animals were housed in propylene cages in controlled conditions (temperature =20°C±2°C and humidity =55%±15%) and fed with standard pellet diet and water ad libitum.
Dose calculation
Dose calculation for herbal drugs is a difficult task due to lack of experimental data. However, in case of CR, acute oral toxicity in rats has been observed at a dose of >10,000 mg/kg, while its bioavailability is less than 25%. For topical application in rats, dose was calculated as follows. Effective human dose of CR (1,200 mg/kg) was divided by a conversion factor of 5/56 and the result was multiplied by its oral bioavailability.Citation31 Thus, a topical dose of 25.71 mg/kg body weight was obtained.
Disease induction and dosing schedule
The animals were injected into the sub-planter region of the left hind paw, with 0.1 mL of FCA.Citation32,Citation33 This consisted of 5 mg Mycobacterium butyricum (Difco) being suspended in heavy paraffin oil (Merck Millipore) by thoroughly grinding with mortar and pestle to give a concentration of 5 mg/mL (0.05% w/v). This day was assigned as day “0”. Dosing with the drug formulation and with the standard was done twice on the same day and continued for 28 days, including the day of inoculation. A thick layer of the prepared gel was applied on the tibiotarsal joint in such a way as to cover the maximum area of the paw.
Body weight measurement
The body weight of all the animals in each group was measured on the day of initiation and the days specified (0, 4th, 7th, 14th, 21st, and 28th)Citation34 and the change in body weight of each animal after the inoculation with FCA was calculated using the formula:
Tibiotarsal joint thickness (TJT) measurement
The ankle (tibiotarsal) joint diameter of all the animals in each group was measured using a screw gauge on the specified days. Change in joint thickness was calculated by using the formula:Citation34
Hind paw edema volume (PV) measurement
Paw volume of the left hind paw was measured plethysmographically on 0, 7th, 14th, and 28th day. The paw volume on the day “0” was taken as initial volume and difference in volume as an indicator of inflammation was measured for all the animals in all the groups on days given. Percent edema rate (ER %) and arthritic index (AI%) was calculated using the following formulae:
Preparation of joint tissue homogenate
At the end of the experiment, the paw at the level of malleolus was amputated and the digits were trimmed off. The skin and underlying tissue at the joint were carefully removed using a surgical blade. An approximate area of the tibiotarsal joint was taken and carefully dipped in liquid nitrogen. The joint was grounded and homogenized using a tissue homogenizer (Remi Instruments, Mumbai, India) using 10× volume of PBS at pH 7.4 at 15,000 rpm for 30 minutes. This was later centrifuged and the supernatant was collected for the biochemical estimation of TNF-α and IL-1β.
Biochemical estimation of cytokines in serum
Blood was collected in a sterile centrifuge tube from the tail vein of all groups using a micro-capillary tube on the 28th day and left undisturbed at 37°C for 45 minutes. During this period, the serum exuded and the clot retracted. The serum was aspirated using a sterile pipette after centrifugation at 3,000 rpm for 15 minutes. The serum samples obtained by centrifugation at room temperature were used for the biochemical estimation of TNF-α and IL-1β using ELISA (enzyme-linked immunosorbent assay) kit supplied by RayBio Lab, New Delhi, India and manufactured by RayBiotech, Inc., Norcross, GA, USA.
Histopathological examination
At termination of the study, the tibiotarsal joint was transected at the level of the medial and lateral malleolus and was collected into formalin for histopathological evaluation. Ankle joints were collected into 10% neutral buffered formalin for at least 24 hours prior to placement in Surgipath Decalcifier I (Leica Microsystems, Wetzlar, Germany) for approximately 1 week. After decalcification, the digits were trimmed and the ankle joint was transected in the longitudinal plane to give approximately equal halves. Joints were processed for paraffin embedment, sectioned, and stained with hematoxylin and eosin for cartilage changes.
Statistical analysis
All the quantitative data were expressed as an average ± SD for each group. Comparisons were made using the Dunnett’s t-test. In all cases P<0.05 were considered statistically significant.
Results and discussion
Solubility studies for excipient screening
In the present study, different oils, natural as well as semi-synthetic, were chosen and solubility of CR was determined. The selection of the oil phase was made in such a way that a maximum amount of CR should get incorporated and it should be best suited for topical application. Therefore, the oil phase comprising of Labrafac PG and glyceryl triacetate (triacetin) in equal ratio was selected. Glyceryl triacetate, being an excellent solvent blended well with the oil and enhanced the solubility of CR.
For the selection of surfactant and co-surfactant solubilization efficiency was taken into account. The surfactant chosen must be able to lower the interfacial tension to a very small value, provide a flexible film that can readily deform around droplets, and have the appropriate hydrophilic lipophilic balance (HLB) value to provide the correct curvature at the interfacial region for the desired nanoemulsion type. Transient negative interfacial tension and fluid interfacial film is rarely achieved by the use of single surfactant, usually necessitating the addition of a co-surfactant.Citation35 Therefore, tween 80, a non-ionic, non-irritant surfactant having an HLB value of 15 was selected as the surfactant and PEG 400 as the co-surfactant.
Construction of pseudo-ternary phase diagrams and formulation of CR-NE
The pseudo-ternary phase diagrams were constructed for different ratios of tween 80 and PEG 400. The surfactant and co-surfactant mass ratios greatly affected the area of nanoemulsion formation on the phase diagram. Higher concentration of co-surfactant (Smix 1:2, 1:3, 1:4) led to narrower zone of nanoemulsion region with higher frequency of breakdown of nanoemulsion upon storage, which can be attributed to the fact that increase in co-surfactant concentration might lead to destabilization effect. A wider zone of nanoemulsion was obtained from Smix ratios in the order of 2:1<4:1>3:1 (). This phenomenon has been supported by the fact that increase in surfactant concentration leads to lowering of the interfacial barrier and formation of thermodynamically-stable nanoemulsion owing to reduction in size, high surface area and charge.Citation36
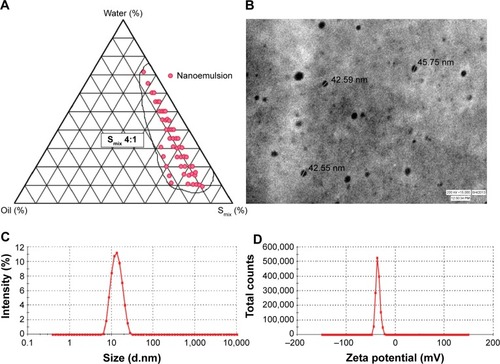
Figure 1 Nanoemulsion region in pseudoternary plot and characterization parameters of optimized nanoemulsion CR-NE4.
Notes: (A) Pseudo-ternary phase diagram at Smix 4:1; (B) TEM photomicrograph; (C) droplet size distribution analysis; (D) zeta potential graph.
Abbreviations: CR-NE, curcumin nanoemulsion; TEM, transmission electron microscopy; Smix, surfactant:cosurfactant.
Further optimization of the nanoemulsion was carried out by the stability test comprising of heating and cooling cycles, centrifugation and freeze-thaw cycle. Different formulations from pseudo-ternary phase diagram of each Smix ratio were selected based on the criteria that they should possess an optimum oil concentration ranging from 9% to 12% and surfactant and co-surfactant ratio of 50%–55%. The Smix ratios of 1:0, 1:1, and 1:2 showed turbidity or phase separation upon thermodynamic stability testing. This may be due to increase in particle diameter upon centrifugation. Opalescence is observed which may be reversed on standing. Heating results in randomness due to increase in enthalpy, while cooling results in loss of entropy or coalescence, leading to an increase in particle size.Citation37
Characterization of optimized formulation
The evaluation of morphology by TEM revealed that the size of the nanoemulsion was less than 50 nm (), which was in concordance with the photon correlation spectroscopy analysis. The average hydrodynamic particle size and poly dispersity index (PDI) of the optimized formulation (CR-NE4) were found to be 41.13±3.34 nm and 0.173±0.04, respectively (). The zeta potential of the formulation was found to be −33.1±1.45 mV, as evident from . The size of the nanoemulsion globule less than 50 nm, having a dispersibility of less than one is considered ideal for topical delivery, as it would provide a large surface area.Citation38,Citation39 The nanoemulsion globules were spherical with a smooth flexible boundary. The negative zeta potential value of 30 mV or less was considered sufficient to prevent coalescence and maintain the interfacial boundary of the nanoemulsion.Citation25
Ex vivo permeation and deposition study
Six formulations, two each from Smix ratios of 2:1, 3:1, and 4:1 having an oil content (Labrafac PG: glyceryl triacetate =1:1) 9%–12% v/v and Smix range 50%–55% v/v, were selected and characterized for droplet size (). CR at a concentration of 0.25% w/v was mixed thoroughly with the oil phase. Then, the required amount of Smix and water was added under constant magnetic stirring.
Figure 2 Comparative zeta size analysis and permeation study of selected CR-NEs.
Notes: (A) Droplet size distribution analysis of selected curcumin-loaded nanoemulsions, CR-NE1, CR-NE2, CR-NE3, CR-NE4, CR-NE6, and CR-PLC; (B) comparative permeation profile of the same.
Abbreviations: CR-NE, curcumin nanoemulsion; CR-PLC, curcumin placebo nanoemulsion; C-CR, crude curcumin solution in oil; hr, hour(s).
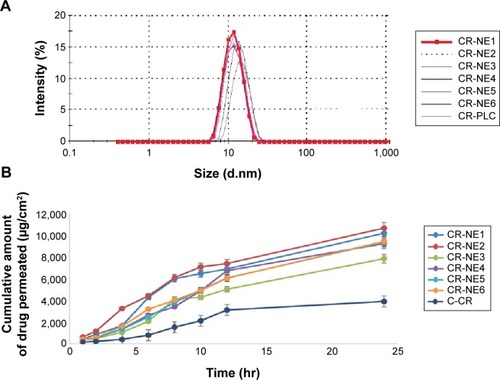
The comparative permeability study was performed for the selected nanoemulsions CR-NE1, CR-NE2, CR-NE3, CR-NE4, CR-NE5, and CR-NE6 through the excised rat skin. The steady state flux and permeability coefficient were compared with that of control, C-CR (). The selected formulations owing to their low particle size (Z-average ≤70 nm), greatly enhance the rate of permeation. The Smix blend increases the solubilization efficiency and permeability coefficient of the skin as the interfacial barrier decreases and partitioning improves owing to increase in lipophilicity.Citation40 It is evident that the steady state flux (Jss) and the permeability coefficient of CR-NE4 are 117.03±2.32 µg/cm2/h and 4.68×10⁻³ cm/h, respectively, which are the lowest amongst the nanoemulsions, but higher than the CR solution in oil, C-CR (). Enhancement ratio showed that there was a fourfold increase in the steady state flux in case of nano-emulsion, with P-value <0.0001, which is highly significant (). In topical drug delivery, a low rate of permeation and high retention is desirable. The percent skin deposition of the drug in the six investigated nanoformulations were found to be in the range of 20%–43% with CR-NE4 showing the highest skin retention of 42.87%±1.72% which is significantly higher (P<0.05) than the C-CR which showed only 9.12%±1.23% drug retention. Thus, CR-NE4 was selected as the optimized formulation for further studies.
Table 1 Permeation data of selected curcumin nanoemulsions and curcumin solution in oil
Preparation of NEG
The formulation CR-NE4 was selected as the optimized one on the basis of its permeation data and was converted into gel by using carbopol-980 (1% w/v) () for mechanistic and in vivo investigations. The gel matrix further lowers the permeation rate and allows free movement of globules within due to hydration resulting in increase in the surface area.Citation41 It provides ease of application and holds drug topically on affected area for a longer duration.
Table 2 Composition of different curcumin formulations
Skin dynamics study
DSC study of skin
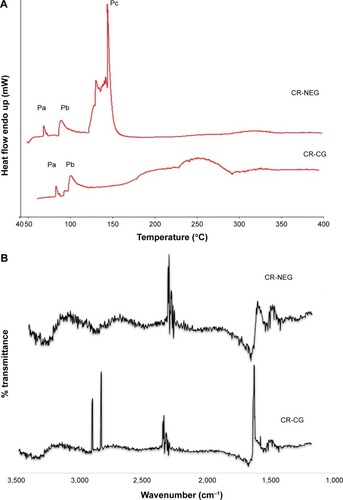
DSC study of the skin provides a direct measurement of the changes in the skin surface based on enthalpy changes. The mechanism of permeation enhancement by the NEG could be elucidated by the thermograms obtained from the CR-NEG treated skin, while the one treated with CR-CG served as the control. The DSC thermograms of the CR-CG skin showed the presence of peaks Pa and Pb obtained at 80°C–110°C, respectively, which can be attributed to melting of stratum corneum lipids (). In the DSC thermograms of CR-NEG treated skin the peaks at Pa and Pb shifted further lower by 10°C–20° indicating enhanced fluidization of the lipids. In addition to this, an additional peak Pc appeared at temperature 142°C which may be attributed to stratum corneum protein denaturation. The bent in the peak is characteristic of a reaction interfering with a physical transition which may be due to incorporation of the nanoemulsion into the stratum corneum.Citation42
Figure 3 Skin dynamics study by DSC and FT-IR.
Notes: (A) DSC thermograms and; (B) FT-IR peaks of skin treated with CR-NEG and CR-CG, respectively.
Abbreviations: FT-IR, Fourier transform infrared spectroscopy; CR-NEG, curcumin nanoemulsion gel; CR-CG, curcumin crude gel; DSC, differential scanning calorimetry.
FT-IR microscopy study of the skin
After the 24 hours permeation study, the skins were removed from the Franz diffusion cell and the treated area was excised, analyzed, and compared for the characteristic FT-IR bands. There is a pronounced difference in the FT-IR spectra of the CR-NEG treated skin when compared with the CR-CG treated one which served as control (). Characteristic peaks in the FT-IR spectra of the CR-CG treated skin appeared at 2,920 cm−1 and 2,849 cm−1, which corresponds to asymmetric and symmetric C-H stretching, respectively. Amide I band C=O stretching appeared near 1,650 cm−1. The C-H stretching wave numbers are related to lipid order in the skin and C=O is related to protein conformation.Citation43 The peak intensities were high and predominantly mimicked the spectra of untreated skin with slight shift in wavenumber which can be attributed to hydration of the skin.Citation43 The peak height decreased in CR-NEG-treated skin for C-H stretching which can be contributed to the lipid bilayer conformational disruption and fluidization of membrane lipids. The nanoemulsion caused a change in fluidity of lipids, and therefore the characteristic peaks of C-H stretching at 2,850 cm−1 and 2,920 cm−1 were of weaker intensity.
CLSM studies
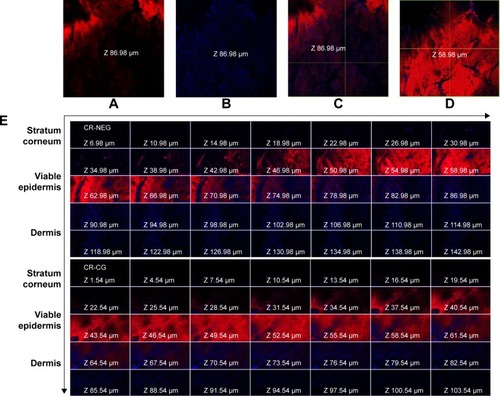
CLSM images of the Rhodamine B dye-loaded CR-NEG were compared with that of C-CR (). The figure shows intense red and blue fluorescence corresponding to Rhodamine B and CR, respectively. The intensity of red fluorescence increases consistently with the depth of skin up to 58.98 µm and faded afterward, while blue fluorescence was highest at the depth of 86.98 µm (). This could be attributed to the fact that oil-in-water (o/w) nanoemulsion created a diffusion barrier as a result of partitioning across lipid bilayer of the stratum corneum. Rhodamine B being hydrophilic followed the polar pathway of permeation, while CR diffused from the inner core following the continuous non-polar pathway.Citation44 Skin integrity has been altered by the nanoemulsion proving that nanoemulsion has the potential to permeate across the stratum corneum. The drug got released due to the increase in concentration gradient created as a result of partitioning following Fickian diffusion.Citation45 The lipophilicity increased with the thickness of the skin, hence blue fluorescence increased gradually indicating higher concentration of CR.
Figure 4 CLSM images of the rat skin treated with CR-NEG and CR-CG showing permeation of Rhodamine B (red fluorescence) and curcumin (blue fluorescence) at different depths of skin.
Notes: (A, B) Red and blue fluorescence at a depth of 86.98 µm; (C) combined fluorescence at depth of 86.98 µm; (D) maximum red fluorescence at a depth of 58.98 µm; (E) combined fluorescence in different skin layers after 24 hours.
Abbreviations: CLSM, confocal laser scanning microscopy; CR-NEG, curcumin nanoemulsion gel; CR-CG, curcumin crude gel.
In vivo studies
Body weight measurement
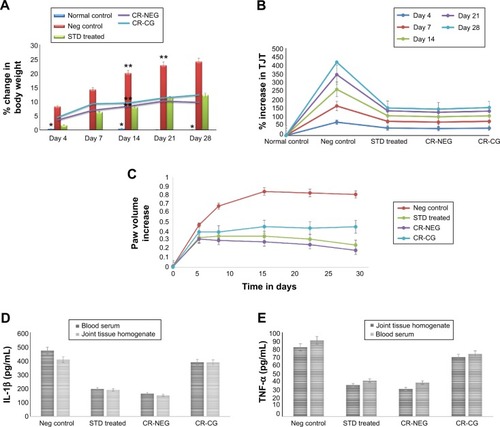
Body weight measurement data after FCA injection showed a close relationship between the extent of joint inflammation and the degree of body weight loss (). Significant weight loss was observed between days 14, 21, and 28 in group II (P<0.001). However, groups receiving treatment with CR-NEG and standard drug did not show any significant weight loss after day 14 owing to the effect of treatment. Moreover, the shielding effect of CR-NEG was significantly greater as compared to standard formulation after the inflammatory phase subsided after day 14.
Figure 5 Change in various in vivo parameters of different treatment groups on days specified.
Notes: (A) Percent body weight change (*P<0.05; **P<0.01); (B) percent change in tibiotarsal joint thickness (P<0.05); (C) left hind paw volume increase; (D) level of IL-1β in blood serum and joint tissue homogenate (P<0.01); (E) level of TNF-α in blood serum and joint tissue homogenate (P<0.01).
Abbreviations: Neg, negative; CR-NEG, curcumin nanoemulsion gel; CR-CG, curcumin crude gel; TJT, tibiotarsal joint thickness; STD, standard.
TJT measurement
Upon injection with FCA, there was inflammation at the site and joint at day 4, there was noticeable difference in %TJT in groups II, III, IV, and V, as compared to the normal control. Significant enhancement was found in group II on 4, 7, and 14 days compared to healthy control (). After day 14 until 28 the rate of inflammation decreased. Reversal was observed in all the treatment groups with varying magnitude. Treatment with CR-NEG was found to be almost as effective as standard in controlling tibiotarsal joint inflammation.
PV measurement
Between 0 and 7th day insignificant differences in PV were found among all the groups. Ominously increasing trend was seen in PV for group II from day 1 onward until day 4, when there is maximum inflammation (). Afterward, inflammation started declining until day 14 but there was reversal and inflammation could be noticed on the non-injected paws as well owing to secondary lesions and all the comparisons were made between 4th, 14th, 21st, and 28th days’ observations. Mean AIs of the groups and In% in different treatment groups are shown in . AI is used to define the severity of joint inflammation based on calculation of scores of the paws after arthritis induction as compared to the normal control.Citation46 The AIs of CR-NEG treated group on day 4 and 14 were 49.67%±6.42% and 198.20%±7.91%, respectively, and %In on day 14 and 28 were 70.50%±8.17% and 85.30%±1.72%, respectively, which were significantly higher than both standard (P<0.05) and CR-CG (P<0.01) treatments. The days 4–14 mark the proliferative phase which is characteristic of inflammation, hyperplasia and macrophage activities in the synovial membrane. The rate of inhibition was clearly better in case of CR-NEG as compared to CR-CG (P<0.01).
Table 3 Arthritic index (AI%) and rate of inhibition of arthritis (In%) calculated from hind paw volume for each group
Biochemical estimation of cytokines in serum and joint tissue homogenate
The pro-inflammatory cytokines, TNF-α and IL-1β were significantly enhanced in blood as well as joint tissue on 28th day of induction of arthritis in group II rats as compared to group I (healthy control) (P<0.01). TNF-α and IL-1β concentrations were markedly reduced in group III, IV, and V. However, most significant effect was seen in CR-NEG treated group followed by standard treatment group (). This trend was observed in both the serum as well as in joint tissue homogenate. But, at the level of control the effect was more pronounced in tissue homogenate as compared to serum mainly due to etiology of arthritic disorders. TNF-α is secreted by macrophages, monocytes, neutrophils, T-cells and NK-cells following their stimulation by bacterial lipopolysaccharide. TNF-α shares many of the pro-inflammatory activities of IL-1β, and may therefore also promote synovitis and stimulate cartilage and bone breakdown.Citation47 The affected joints synthesize and release IL-1β, IL-6, and TNF-α which are synergistic in inflammatory activity and TNF-α may be an essential stimulus for the production of other cytokines such as IL-1β in the arthritic joint since neutralizing antibodies directed against TNF-α reduce the spontaneous production of IL-1β from synovial mononuclear cells derived from the joint.Citation48 Thus, the elevated TNF-α and IL-1β levels in group II indicated the extent of cartilage damage. The CR-NEG showed most significant depression of both TNF-α and IL-1β levels as compared to CR-CG which can be attributed to high permeability achieved through nanoemulsion.
Histopathological examination
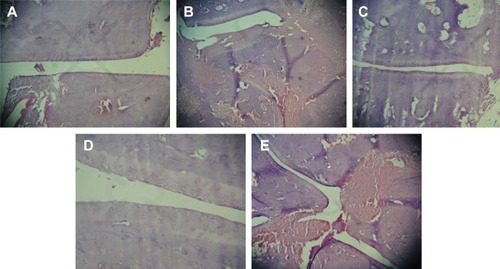
The representative photomicrographs of histological sections are shown in . Group I, (), being normal control revealed smooth synovial epithelium with normal joint cavity without any sign of cellular infiltration or bone erosion. Group II () rats showed marked cellular infiltration and synovial hyperplasia, joint cavity, cartilage destruction, and bone erosion as compared to healthy rats. Treatments with standard marketed gel (), after arthritis induction, not only showed significant effects on cellular infiltration, joint space narrowing, and synovial hyperplasia, but markedly retarded the process of cartilage destruction and bone erosion as well. However, most effective amelioration of the symptoms was found in CR-NEG system (). Here, the synovial epithelium hyperplasia is less as compared to standard as well as CR-CG. Trabeculae are intact and the joint spaces are also maintained. However, CR-CG () did not seem to have comparable effects as that of groups III and IV. The histological sections confirmed the increased capability of CR-NEG to suppress the arthritic symptoms. Thus, from the above findings it can be concluded that CR-loaded NEG was better in controlling the progression of arthritis than the standard marketed formulation upon topical application.
Figure 6 Photomicrographs of histological section of ankle joint in the respective groups.
Notes: (A) Group I – normal joint, (B) group II – control; (C) group III – treatment with standard marketed gel, (D) group IV – treatment with CR-NEG; and (E) group V – treatment with CR-CG. Images taken on 10× magnification.
Abbreviations: CR-NEG, curcumin nanoemulsion gel; CR-CG, curcumin crude gel.
Conclusion
In the present study, an NEG loaded with CR was developed and characterized for topical administration in the management of inflammation related to arthritis. The skin dynamics study, ex vivo permeation and deposition study clearly indicated that nanoemulsion as the delivery system has high potential of drug delivery to the target by overcoming the stratum corneum barrier. The DSC thermograms and the FT-IR scan of the CR-NEG treated skin provided an insight into the mechanism of topical delivery of drugs like CR. The in vivo studies revealed that potential of topical treatment with CR cannot be overlooked as CR can effectively reduce the local macrophage activity and the reduction of cytokines (TNF-α and IL-1β) in tissue homogenate points toward this. CLSM studies revealed that higher amount of CR got deposited in the epidermis and dermis and lipophilicity of CR allows it to be retained, hence it can retard the slow progression of the disease. Histopathology at the end of day 28 further supported this as the arthritic symptoms are highly suppressed. Thus, it can be concluded that the developed nanoemulsion-based gel has better potential in the management and control of arthritis progression.
Acknowledgments
The authors are grateful to the University Grant Commission, New Delhi, India for providing fellowship to Zrien Naz as financial assistance under Maulana Azad Scholarship Scheme.
Disclosure
The research work is original and the authors report no conflict of interest.
References
- RamadanGEl-MenshawyOProtective effects of ginger-turmeric rhizomes mixture on joint inflammation, atherogenesis, kidney dysfunction and other complications in a rat model of human rheumatoid arthritisInt J Rheum Dis201316221922923773648
- GerwinNHopsCLuckeAIntraarticular drug delivery in osteoarthritisAdv Drug Deliv Rev200658222624216574267
- BadgerAMLeeJCAdvances in antiarthritic therapeuticsDrug Dis Today1997210427435
- FunkJLFryeJBOyarzoJNEfficacy and mechanism of action of turmeric supplements in the treatment of experimental arthritisArthritis Rheum200654113452346417075840
- ShishodiaSSinghTChaturvediMMModulation of transcription factors by curcuminAdv Exp Med Biol200759512714817569208
- JoeBRaoUJLokeshBRPresence of an acidic glycoprotein in the serum of arthritic rats: modulation by capsaicin and curcuminMol Cell Biochem19971691–21251349089639
- OnoderaSKanedaKMizueYMacrophage migration inhibitory factor up-regulates expression of matrix metalloproteinases in synovial fibroblasts of rheumatoid arthritisJ Biol Chem2000275144445010617637
- LiaciniASylvesterJLiWQInduction of matrix metalloproteinase-13 gene expression by TNF-alpha is mediated by MAP kinases, AP-1, and NF-kappaB transcription factors in articular chondrocytesExp Cell Res2003288120821712878172
- JacksonJKHigoTHunterWLBurtHMThe antioxidants curcumin and quercetin inhibit inflammatory processes associated with arthritisInflamm Res200655416817516807698
- Lev-AriSStrierLKazanovDCurcumin synergistically potentiates the growth-inhibitory and pro-apoptotic effects of celecoxib in osteoarthritis synovial adherent cellsRheumatology (Oxford)200645217117716249246
- ShakibaeiMJohnTSchulze-TanzilGLehmannIMobasheriASuppression of NF-kappaB activation by curcumin leads to inhibition of expression of cyclo-oxygenase-2 and matrix metalloproteinase-9 in human articular chondrocytes: Implications for the treatment of osteoarthritisBiochem Pharmacol20077391434144517291458
- RamadanGAl-KahtaniMAEl-SayedWMAnti-inflammatory and anti-oxidant properties of Curcuma longa (turmeric) versus Zingiber officinale (ginger) rhizomes in rat adjuvant-induced arthritisInflammation201134429130121120596
- AnandPKunnumakkaraABNewmanRAAggarwalBBBio-availability of curcumin: problems and promisesMol Pharm20074680781817999464
- TonnesenHHMássonMLoftssonTStudies of curcumin and curcuminoids. XXVII. Cyclodextrin complexation: solubility, chemical and photochemical stabilityInt J Pharm20022441–212713512204572
- WangYJPanMHChengALStability of curcumin in buffer solutions and characterization of its degradation productsJ Pharm Biomed Anal19971512186718769278892
- GuptaVAsehARiosCNAggarwalBBMathurABFabrication and characterization of silk fibroin-derived curcumin nanoparticles for cancer therapyInt J Nanomedicine2009411512219516890
- FessiHPuisieuxFDevissaquetJPNanocapsule formation by interfacial polymer deposition following solvent displacementInt J Pharm198955R1R4
- KimTYKimDWChungJYPhase I and pharmacokinetic study of Genexol-PM, a cremophor-free, polymeric micelle formulated paclitaxel, in patients with advanced malignanciesClin Cancer Res200410113708371615173077
- MaZShayeganpourABrocksDRLavasanifarASamuelJHigh-performance liquid chromatography analysis of curcumin in rat plasma: application to pharmacokinetics of polymeric micellar formulation of curcuminBiomed Chromatogr20072154652
- ThangapazhamRLPuriATeleSBlumenthalRMaheshwariRKEvaluation of a nanotechnology-based carrier for delivery of curcumin in prostate cancer cellsInt J Oncol20083251119112318425340
- SunYLeeCCHungWCThe bound states of amphipathic drugs in lipid bilayers: study of curcuminBiophys J20089552318232418515370
- AggarwalBBHarikumarKBPotential therapeutic effects of curcumin, the anti-inflammatory agent, against neurodegenerative, cardiovascular, pulmonary, metabolic, autoimmune and neoplastic diseasesInt J Biochem Cell Biol2009411405918662800
- PeltolaSSaarinen-SavolainenPKiesvaaraJSuhonenTMUrttiAMicroemulsions for topical delivery of estradiolInt J Pharm200325429910712623186
- MaestrelliFGonzalez-RodriguezMLRabascoAMMuraPEffect of preparation technique on the properties of liposomes encapsulating ketoprofen-cyclodextrin complexes aimed for transdermal deliveryInt J Pharm20063121–2536016469460
- LawrenceMJReesGDMicroemulsion-based media as novel drug delivery systemsAdv Drug Deliv Rev20004518912111104900
- ChenHChangXWengTA study of microemulsion systems for transdermal delivery of triptolideJ Control Rel2004983427436
- ValentaCSchultzKInfluence of carrageenan on the rheology and skin permeation of microemulsion formulationsJ Control Rel2004952257265
- GulsenDChauhanADispersion of microemulsion drops in HEMA hydrogel: a potential ophthalmic drug delivery vehicleInt J Pharm20052921–29511715725557
- SpiclinPHomarMZupancic-ValantAGasperlinMSodium ascorbyl phosphate in topical microemulsionsInt J Pharm20032561–2657312695012
- FerreiraLASeillerMGrossiordJLVehicle influence on in vitro release of glucose: w/o, w/o/w and o/w systems comparedJ Control Rel199533349356
- GhoshMNToxicity studiesFundamentals of Experimental pharmacology, third editionKolkata, IndiaHilton and company2005190197
- PearsonCMWoodFStudies of polyarthritis and other lesions induced in rats by injection of mycobacterial adjuvant. I. General clinical and pathological characteristics and some modifying factorsArthritis Rheum19592440459
- NewbouldBBChemotherapy of arthritis induced in rats by Mycobacte-rial adjuvantBr J Pharmacol Chemother19632112713614066137
- KunkelSLOgawaHConranPBWardPAZurierRBSuppression of acute and chronic inflammation by orally administered prostaglandinsArthritis Rheum1981249115111586458304
- AzeemARizwanMFarhanJANanoemulsion components screening and selection: a technical noteAAPS Pharm Sci Tech20091016976
- HaitSKMoulikSPInterfacial composition and thermodynamics of formation of water/isopropyl myristate water-in-oil microemulsions stabilized by butan-1-ol and surfactants like cetyl pyridinium chloride, cetyl trimethyl ammonium bromide, and sodium dodecyl sulfateLangmuir20021867366744
- ChoYHKimSBaeEKMokCKParkJFormulation of a cosurfactant-free o/w microemulsion using nonionic surfactant mixturesJ Food Sci2008733E115E12118387105
- Fernandez CamposFCalpena CampmanyACRodríguez DelgadoGLópez SerranoOClares NaverosBDevelopment and characterization of a novel nystatin-loaded nanoemulsion for the buccal treatment of candidosis: ultrastructural effects and release studiesJ Pharm Sci2012101103739375222777575
- Garduño-RamírezMLClaresBDomínguez-VillegasVSkin permeation of cacalol, cacalone and 6-epi-cacalone sesquiterpenes from a nanoemulsionNat Prod Commun20127782182322908555
- PottsROGuyRHPredicting skin permeabilityPharm Res1992956636691608900
- OkayOGeneral Properties of HydrogelsGerlachGArndtKFHydrogel Sensors and ActuatorsSpringerBerlin Heidelberg2009114
- PottsROGoldenGMFrancoeurMLMechanism and enhancement of solute transport across the stratum corneumJ Control Rel199115249260
- GaridelPMid-FTIR-Microspectroscopy of stratum corneum single cells and stratum corneum tissuePhys Chem Chem Phys2002456715677
- GoatesCYKnutsonKEnhanced permeation of polar compounds through human epidermis. I. Permeability and membrane structural changes in the presence of short chain alcoholsBiochim Biophys Acta1994119511691797918560
- AsquithDLMillerAMMcInnesIBLiewFYAnimal models of rheumatoid arthritisEur J Immunol20093982040204419672892
- LubbertsEvan den BergWBCytokines in the pathogenesis of rheumatoid arthritis and collagen-induced arthritisAdv Exp Med Biol200352019420212613579
- FeldmannMBrennanFMWilliamsROWoodyJNMainiRNThe transfer of a laboratory based hypothesis to a clinically useful therapy: the development of anti-TNF therapy of rheumatoid arthritisBest Pract Res Clin Rheumatol2004181598015123038
- ArendWPDayerJMCytokines and cytokine inhibitors or antagonists in rheumatoid arthritisArthritis Rheum19903333053152180403