
 ?Mathematical formulae have been encoded as MathML and are displayed in this HTML version using MathJax in order to improve their display. Uncheck the box to turn MathJax off. This feature requires Javascript. Click on a formula to zoom.
Abstract
Alginate–dextran sulfate-based particles obtained by emulsification/internal gelation technology can be considered suitable carriers for oral insulin delivery. A rational study focused on the emulsification and particle recovery steps was developed in order to reduce particles to the nanosize range while keeping insulin bioactivity. There was a decrease in size when ultrasonication was used during emulsification, which was more pronounced when a cosurfactant was added. Ultrasonication add-on after particle recovery decreased aggregation and led to a narrower nanoscale particle-size distribution. Insulin encapsulation efficiency was 99.3%±0.5%, attributed to the strong pH-stabilizing electrostatic effect between insulin and nanoparticle matrix polymers. Interactions between these polymers and insulin were predicted using molecular modeling studies through quantum mechanics calculations that allowed for prediction of the interaction model. In vitro release studies indicated well-preserved integrity of nanoparticles in simulated gastric fluid. Circular dichroism spectroscopy proved conformational stability of insulin and Fourier transform infrared spectroscopy technique showed rearrangements of insulin structure during processing. Moreover, in vivo biological activity in diabetic rats revealed no statistical difference when compared to nonencapsulated insulin, demonstrating retention of insulin activity. Our results demonstrate that alginate–dextran sulfate-based nanoparticles efficiently stabilize the loaded protein structure, presenting good physical properties for oral delivery of insulin.
Introduction
The challenge of orally administered insulin has been addressed in order to help relieve the pain and stress caused during insulin injections by millions of diabetics. Insulin is a peptide drug and therefore it is a challenge for oral delivery, due to enzymatic degradation in the gastrointestinal tract and, particularly, to the difficulty to permeate the intestinal epithelium.
Much research has been focused on an oral insulin delivery system that mimics the physiologic pattern of insulin secretion.Citation1–Citation4 To ensure enteric protection, recent advances in nanoencapsulation resulted in an increasing growth of innovative formulations such as micro-Citation5,Citation6 and nanoparticles.Citation7,Citation8 In drug delivery, nanoparticles have demonstrated numerous advantages over conventional formulations.Citation9,Citation10 Particle size plays a crucial role in biomedical applications, namely on biorecognition,Citation11 biodistribution,Citation12 bioadhesion,Citation13 biocompatibility,Citation14 and biodegradation.Citation15 However, most techniques for producing submicron particles require organic solvents, high temperature, or vigorous agitation, which are potentially harmful parameters to the structure of insulin and consequently lead to loss of activity. Submicron particles have been produced under particularly mild processing conditions by using emulsification/internal gelation technology, which has previously been applied to the production of larger-sized microparticlesCitation16–Citation19 and micron- and nanometer-sized particles.Citation20 This technology involves experimental conditions such as nonextreme values of temperature and pH and refraining from using harsh chemicals. All of those conditions are potentially threats to the stability of peptides and proteins. Indeed, this technology makes use of naturally occurring polymers such as alginate and dextran sulfate, which are a suitable choice due to their excellent biocompatibility, drug carrying ability, adjustable controlled-release property, lower cost, abundance in nature, and easier application.Citation21 Previous studies revealed that the presence of a copolymer, such as dextran sulfate, enhances the loading of hydrophilic drugs and that the type of polymer has a considerable effect on the loading capacity.Citation22
However, one of the limitations of emulsification/internal gelation technology consists of the difficulty to obtain mono-dispersed populations of particles. As drug-delivery systems, the size control and size uniformity of carriers are of great interest to generate in vitro and in vivo reproducible as well as repeatable profiles and behaviors, which will further result in benefits in clinical use.Citation23 Alginate/dextran sulfate particles show polydispersed populations, characterized by a wide size distribution which derives from nano- and microparticles and also aggregates coexistence,Citation24 characteristic of emulsification methods using biodegradable polymers.Citation25 Over the past years, emulsification-based technologies have been optimized to produce polysaccharide-based particles with a lower size and monodispersed populations.Citation20,Citation26–Citation28 Ultrasonication is particularly effective in breaking up the aggregates of particles, thereby reducing their size and polydispersity.Citation29 However, ultrasonication has also been related to formation of protein aggregates with structural changes.Citation30
As delivery systems for insulin, the most important characteristics of particles include size distribution, encapsulation efficiency (EE), and the release profile of insulin from particles while maintaining the biological activity of insulin during and after processing. From an industrial and economic perspective, the EE is crucial especially in the case of proteins, which are expensive products.Citation31
Stability is a major challenge especially when insulin is encapsulated in polymeric particles using an emulsion-based technique. The emulsification step is identified as critical for protein inactivation and aggregation. The hydrophobic interface created between the water and oily solvent, and the hydrophobic interactions between protein and polymer, may lead to adsorption of insulin at the interface, which results in insulin unfolding and/or aggregation.Citation32–Citation34 In addition, the shear used for the emulsification can also contribute to insulin denaturation.Citation35 Hence, maintaining the native conformation of insulin during the encapsulation process is highly important, which otherwise may lead to protein aggregation and immunogenicity.
The purpose of this work was to develop a formulation of insulin-loaded biopolymer-based nanoparticles produced by emulsification/internal gelation technique with good physical properties for oral delivery and assess how emulsion droplet size may affect the resultant particles, while probing the activity of insulin after each step of the process. The emulsification step was performed with and without ultrasonication assistance and in the presence of one or two surfactants. The recovery strategy of particles was also investigated to increase recovery yield and ensure removal of residual oil from the surface of particles. For better insight about the formation of alginate/dextran sulfate particles, molecular modeling studies were performed. Here, quantum mechanics calculations were employed to understand the electronic properties of the multicomponent system of alginate/dextran sulfate.
Particles were characterized according to size distribution, surface charge, morphology, EE, and in vitro insulin release behavior. Activity of insulin during and after each stage of processing was assessed either in vitro or in vivo.
Materials and methods
Materials
Low-viscosity sodium alginate (viscosity of 1% solution at 25°C, 4–12 cP), dextran sulfate, sorbitan monooleate (Span 80®), phosphotungstic acid, trifluoroacetic acid 99%, and acetonitrile (LiChrosolv) high-performance liquid chromatography (HPLC) grade were all obtained from Sigma-Aldrich Co. (St Louis, MO, USA); calcium carbonate (Setacarb; Omya, Orgon, France), paraffin oil (Scharlau, Barcelona, Spain), insulin 100 IU/mL (Actrapid®; Novo Nordisk A/S, Bagsværd, Denmark), poloxamer 188 (Lutrol®F68; BASF, Ludwigshafen, Germany), sodium citrate dehydrate (Sigma-Aldrich Co., St Louis, MO, USA), and Nile red (Sigma-Aldrich Co.) were also obtained.
Preparation of alginate/dextran sulfate-based particles
Insulin-loaded particles were prepared through a modified emulsification/internal gelation technique.Citation20,Citation24 Briefly, the water in oil (w/o) emulsion was formed by mixing alginate/dextran sulfate matrix with the oil phase. An aqueous solution of sodium alginate (2.0%, w/v) and dextran sulfate (0.75%, w/v) was prepared by stirring (100 rpm) overnight. Insulin was added and dissolved (100 IU/mL, 10 mL). Then, an aqueous suspension of ultrafine calcium carbonate (5%, w/v) was ultrasonicated for 30 minutes to break up crystal aggregates, and was dispersed at a calcium–alginate ratio of 16.7% (w/w). The resultant dispersion was emulsified within paraffin oil (aqueous phase/oil phase 50/50, v/v) facilitated by sorbitan monooleate (2%, v/v) by impeller-stirring homogenization (1,600 rpm). The effects of cosurfactant addition, poloxamer 188, keeping the hydrophilic–lipophilic balance (HLB) required for a w/o emulsion (HLB =4–6)Citation36 and ultrasonication add-on during the emulsification step at different times (10, 15, 20, 25, and 30 minutes) as well as at different ultrasonic amplitudes (30%, 45%, and 60%) were tested.
After emulsification, gelation was induced by addition of paraffin oil containing glacial acetic acid (molar ratio of acid–calcium, 3.5) to solubilize calcium dispersed in the alginate/dextran droplets for 15 minutes. Unloaded particles were prepared as controls.
Particle recovery
Oil-dispersed alginate particles were recovered through an extraction mediumCitation20 (protocol A) consisting of acetate buffer solution (pH 4.5) (USP 34) with dehydrating solvents (acetone, isopropanol, and hexane) added under continual stirring (600 rpm) followed by centrifugation (12,500× g at 4°C for 10 minutes). Different extraction protocols (B–F) were developed, which can be seen in .
Table 1 Composition of protocol media to recover emulsion-dispersed particles
The other protocols included a first step where the oil-dispersed particles were submitted to extraction with hexane (protocols B–E) or a hexane/acetate buffer mixture (protocol F) for 1 hour in an orbital shaker. Particle recovery occurred after the addition of the other solvents by decantation. Different volume ratios of dehydrating solvents with acetate buffer were studied. Recovery yield was determined by measuring insulin content in the aqueous phase after particle recovery (EquationEquation 1(1) ):
Before emulsification, the oil phase was stained with Nile red to better assess the efficiency of oil elimination from particles.
Added solvents to recover particles were removed by using a rotoevaporator system (BUCHI, V-700, Vacuum controller V-870/B-491/R-210) under reduced pressure at controlled temperature.
Ultrasonication exposure
Ultrasonication was applied to the aqueous suspension of particles with an ultrasonicator (Sonics®, VCX130; Sonics & Materials, Newton, CT, USA) with an amplitude of 60% for 5 and 10 minutes in order to break up agglomerates. The temperature was kept below 25°C by using an ice bath.
Determination of insulin content
Insulin was extracted from particles through dissolution in sodium citrate (55 mM) prepared in phosphate buffer solution (PBS) at pH 7.4 (USP 34) for 1 hour in an orbital shaker. After particle dissolution, the medium was centrifuged (12,500× g at 4°C for 10 minutes) and insulin content in supernatant was assessed by HPLC.
Emulsion and particle size
Emulsion droplet size measurements were performed by dynamic light scattering (DLS) (DelsaNano C, Beckman Coulter Delsa™, Krefeld, Germany). Measurements were carried out at 25°C with a detection angle of 60°. The size distribution was represented by normalized intensity distribution. The instrument was routinely checked and calibrated using a standard latex particle kit (Beckman Coulter, Inc., Krefeld, Germany).
Particle-size distribution analysis was performed by laser diffraction (LS) using a particle size analyzer (Beckman Coulter® LS 13 320; Beckman Coulter, Inc., Miami, FL, USA) with polarization intensity differential scattering. The real and the imaginary refractive index were set to 1.36 and 0.01, respectively. Three measurements of 90 seconds were used and the size distribution was represented by volume, given as diameter values corresponding to percentiles of 10%, 50%, and 90% together with the relative span value. Particle size before and after each cycle of ultrasonication was additionally investigated by DLS.
Zeta potential
Surface charge was determined by electrophoretic light scattering using a zeta potential analyzer (DelsaNano C, Beckman Coulter Delsa™) at pH 4.5 and 25°C. The equipment was routinely checked and calibrated using mobility standard (Beckman Coulter, Inc.).
Insulin EE
Insulin EE was calculated by the difference between the total amount of insulin used to prepare particles and the amount of free insulin per total amount of insulin. Insulin-loaded particles were separated from aqueous supernatant containing free insulin by centrifugation (12,500× g at 4°C for 10 minutes), and the amount of free insulin was determined by HPLC.
Morphological analysis
Morphology of single surfactant-assisted particles was monitored by scanning electron microscopy (SEM). The suspension was diluted in deionized water (Milli-Q) (1:10, v/v) and dried in a desiccator for 24 hours. Particle morphology was observed using a scanning electron microscope (Phenom G2 Pure). The shape, surface, and mass spectroscopy of cosurfactant and ultrasonication-assisted particles were analyzed by field environmentalcryo-SEM scanning microscope (EDS-JEOL JSM 6301 F, Oxford INCA Energy 350, Gatan Alto 2500). Phosphotungstic acid-stained particles were frozen using liquid nitrogen slush (−210°C) under vacuum to allow their fracture in order to obtain a fresh and clean surface for examination. Then, samples were sublimated at −90°C for 4 minutes to remove top layers of water molecules. Finally, samples were sputter coated with gold/palladium for 40 seconds, followed by image capturing.
Insulin retention/release studies
For determination of the insulin retention/release profile in enzyme-free simulated digestive fluids, 5 mL of aqueous suspension of particles were incubated in 10 mL of simulated gastric fluid without pepsin (USP 34) at 37°C for 2 hours with shaking of 100 strokes/minute using a shaking water bath (SS40-D; GRANT, Cambridge, UK), followed by incubation of particles in 10 mL of simulated intestinal fluid without pancreatin (USP 34) for 6 hours. Sample aliquots were collected and replaced by the same volume of fresh incubation medium at predetermined times. For determination of insulin released from particles, withdrawn samples were centrifuged at 12,500× g at 4°C for 10 minutes before HPLC injection. The difference between the initial amount of insulin and the insulin in the supernatant corresponds to the amount of insulin retained within particles.
Insulin quantification
Insulin was analyzed by HPLC (LC-2010 HT; Shimadzu Co., Kyoto, Japan) equipped with a quaternary pump, a column 5 μm, 4.6×250 mm (X-Terra RP 18; Waters Co., Milford, MA, USA), and precolumn 5 μm, 4×4 mm (Purospher STAR RP-18; Merck KGaA, Darmstadt, Germany). The mobile phase consisted of acetonitrile and 0.1% trifluoroacetic acid aqueous solution initially set in the ratio of 30:70 (v/v), which was linearly changed to 40:60 (v/v) over 5 minutes. From 5 to 10 minutes, the ratio of 40:60 (v/v) was kept constant. Eluent was pumped at a flow rate of 1 mL/min, the injection volume was 20 μL, and detection wavelength was 214 nm. The chromatograms were recorded and the peak area responses were measured using an automatic integrator.Citation37
Quantum mechanical studies
The three-dimensional structures of sodium alginate and dextran sulfate were constructed using a software program (Spartan’10 v1.1.0; Wavefunction, Inc., Irvine, CA, USA). Each structure was submitted to energy minimization to obtain the most energetically stable conformation. Then, geometry optimization by the PM6 semiempirical method was conducted and the stereoelectronic properties were obtained, such as the frontier molecular orbitals (HOMO and LUMO) distribution coefficient, and energy, dipole moment vector, and volume. Quantum chemical calculations for other polymers were also performed, such as cellulose sulfate,Citation38 sodium polyphosphate,Citation39 and sodium carboxymethylcellulose,Citation40 previously described as reinforcement polymers.
Conformational stability of insulin
Circular dichroism spectroscopy
To evaluate the conformational stability of insulin released from particles, circular dichroism (CD) spectroscopy was performed with a spectropolarimeter (Olis DSM 20 CD; On-line Instrument Systems, Bogart, GA, USA) equipped with a temperature controller, continuously purged with nitrogen, and controlled by GLOBALWORKS software. Spectra were collected at 37°C using a 0.1 cm cell over the wavelength range of 200–260 nm. A scanning speed (7 nm/min) with a 6-second response time was employed. Each spectrum represents an average of three consecutive scans, and blank buffer subtraction and data analysis were performed. The molar ellipticity of insulin was calculated as:
Fourier transform infrared spectroscopy analysis
Nonencapsulated insulin in solution before and after ultrasonication and insulin entrapped into alginate/dextran sulfate particles before and after ultrasonication were analyzed through Fourier transform infrared spectroscopy (FTIR) technique. All spectra were collected with 256 scans and a 4 cm−1 resolution in the region of 4,000−6,00 cm−1. Insulin spectra were obtained following a double subtraction procedure,Citation42 followed by a 15-point Savitsky–Golay second derivative, and a baseline correction using a 3- to 4-point adjustment at the amide I region (1,710−1,590 cm−1). Finally, all spectra were area-normalized for further comparison. All of the described spectral treatment was performed using the HorizonMB FTIR software (ABB, Zurich, Switzerland).Citation43
Insulin biological activity
Animals were maintained and tested in accordance with the Federation of European Laboratory Animal Science Association and the European Union Council Directive 86/609/EEC. Animals procedures and manipulations were conducted according to the ethical principles and guidelines for housing and experiments on animals of the Direcção Geral de Veterinária. Male Wistar rats weighing 250–350 g were housed under controlled temperature and humidity, and a 12–12-hour light–dark cycle. Diabetes was induced with single intraperitoneal injection of 60 mg/kg streptozotocin in citrate buffer pH 4.5 to damage the pancreatic cells. During the 24 hours after streptozotocin injection, rats were given 5% glucose physiologic solution to prevent hypoglycemia due to pancreatic damage. After 3 days, rats with frequent urination, loss of weight, and fasting plasma glucose levels higher than 250 mg/dL were randomized into three groups (six rats per group) for in vivo studies. The animals were fasted for 12 hours before the experiments with free access to water. To minimize the diurnal blood glucose fluctuations, experiments were performed during the 12-hour light cycle.
Insulin bioactivity was analyzed in diabetic rats after subcutaneous administration at 2 IU/kg. Animals were tested in two different studies, in which the same groups were used. In the first study, insulin was extracted from nanoparticles through dissolution in sodium citrate (55 mM) prepared in PBS at pH 7.4. Unloaded particles were submitted to the same treatment and were used as negative control. Nonencapsulated insulin was used as positive control. Two days after the first administration, the second study was carried out with the formulations dispersed in water. Then, insulin entrapped in nanoparticles was tested, and unloaded nanoparticles and nonencapsulated insulin were used as negative and positive controls, respectively.
Blood samples were collected from the tip of the tail vein during an 8-hour span and blood glucose levels were measured using the ACCU-CHEK Aviva device.
Statistical analysis
All the experiments were performed in triplicate and are represented as mean ± standard deviation. Statistical evaluation was performed with a one-way analysis of variance followed by Bonferroni post hoc test. A P<0.05 was taken as the criterion of significance. The level of significance was set at probabilities of P<0.05, P<0.01, and P<0.001.
Results and discussion
Several factors could affect the size of alginate/dextran sulfate particles obtained by emulsification, namely stirring speed, emulsification time, viscosity of both internal and external phases, the concentration and type of surfactant, and the recovery protocol.Citation44,Citation45 For the design and development of insulin-loaded alginate/dextran sulfate particles, additional components and steps were integrated into previously described alginate-based particles obtained by emulsification, and their influence on physicochemical and biological parameters, such as size distribution and insulin EE, were evaluated.
Protein stability during formulation and product-development costs remain major challenges in pilot scale-up of micro- and nanoparticles which need to be addressed at all levels of research and development so a novel technology can be successfully achieved. Thus, probing insulin secondary structure during the nanoencapsulation process was of major concern, and was assessed whenever possible.
Emulsion size analysis
Submicron size carriers have previously been shown to enable insulin absorption through intestinal membranes.Citation46,Citation47 The influence of nanoparticle size is obvious, giving rise to the possibility that larger-sized particles may remain in the Peyer’s patches, which are rich in M-cells, and lead to slower action. Smaller nanoparticles, if appropriately charged, can pass through the lymphatic pathway and later enter the systemic circulation.Citation4 Therefore, it is admitted that the optimal size for nanoparticles to be taken up by M-cells would be below 1 μm,Citation48 and more precisely, below 200 nm.Citation49,Citation50
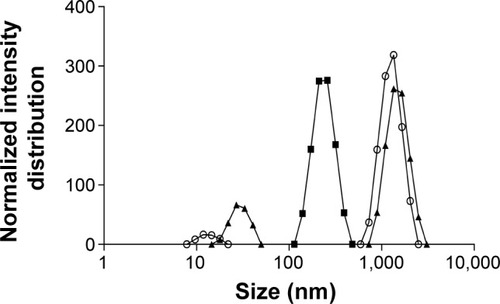
Accordingly, the first approach in this study was to reduce the w/o emulsion droplet size to the nanoscale. An insufficient dispersion of phases during emulsification results in large particles with wide size distribution.Citation51 The final size of nanoparticles depends on the globule size throughout the emulsification process,Citation52 which is mainly determined by the energy input, as well as by the nature of the emulsifying agent/agents.Citation53 To verify the influence of these factors on emulsion size distribution, ultrasonication add-on for 15 and 30 minutes and different ultrasonic amplitudes were tested. It was noticed that an increase in ultrasonication time until 15 minutes led to a displacement of the emulsion size-distribution curve toward lower size (), with median diameters decreasing from 1,119 to 442 nm. On the other hand, increasing time of ultrasonication until 30 minutes led to bigger emulsion droplets. According to these results, there was an optimal ultrasonication time of 15 minutes, and beyond it coalescence may become predominant due to the cavitation phenomena. Therefore, the ultimate size would occur when a balance between droplet breakup and re-coalescence is assured.Citation54 In this work, the optimal condition was an ultrasonication amplitude of 60% for 15 minutes. Different ultrasonic amplitudes were tested at 15 minutes of emulsification (data not shown) and the smallest emulsion median diameter was obtained with 60%.
Figure 1 Influence of ultrasonication time on emulsion size distribution.
Notes: Empty circles: without sonication. After 15 minutes (full squares) and 30 minutes (full triangles) of ultrasonication exposure.
The influence of addition of cosurfactant poloxamer 188 on emulsion size distribution at different time points ranging from 10 to 30 minutes of emulsification was also evaluated (). Maintaining the initial percentage of surfactant used, the lowest ratio of sorbitan monooleate/poloxamer 188 required to achieve the necessary HLB to obtain a w/o emulsion (1.84% [v/v] of sorbitan monooleate and 0.16% [w/v] of poloxamer 188) was employed. There was a decrease in the emulsion size when the cosurfactant was added.
Figure 2 Influence of cosurfactant addition on emulsion size distribution.
Notes: After 10 minutes (empty squares), 15 minutes (full diamonds), 20 minutes (full triangles), 25 minutes (empty circles), and 30 minutes (empty triangles) of ultrasonication exposure.
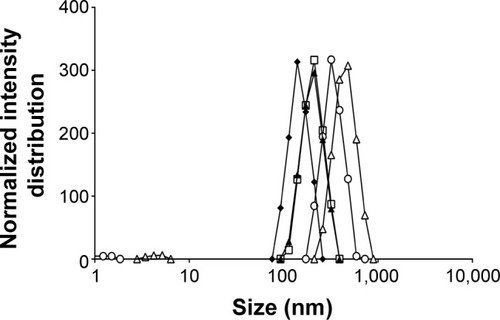
The effect of ultrasonication time in the presence of cosurfactant led to similar results, since periods higher than 15 minutes increased the diameter of emulsion droplets, but with only 10 minutes of exposure, the decrease was less efficient (). The use of sorbitan monooleate/poloxamer 188 decreased median diameters of emulsion droplets from 442 to 317 nm after 15 minutes of ultrasonication exposure. This phenomenon can be expected, since a blend of surfactants with high and low HLB are known to produce more stable emulsions than do single surfactants, since they provide better coverage at the interface.Citation55 Nanoemulsions are all characterized by a great stability in suspension due to their very small size, essentially due to significant steric stabilization between droplets.Citation56
Particle recovery
The recovery yield of the six protocols studied was evaluated both by its capacity to eliminate residual oil and oil droplets, and by insulin content in the recovered particles. In the standard protocol,Citation20 oil-dispersed particles were recovered by a washing step (protocol A, ) associated with centrifugation, which resulted in 29.4%±7.2% () of insulin content. Insulin losses could have been due to particle stress during either their preparation or recovery. Firstly, during washing used to remove residual oil from the surface of particles, insulin may have been drawn out, in which smaller particles were probably more affected. Secondly, centrifugal force may have also contributed to insulin losses, due to the porous nature of alginate particles. Thus, the balance between insulin retention inside alginate/dextran sulfate particles, protocol extraction, and/or centrifugal force was considered. Other protocols (B–F) were designed by varying solvent proportions, and centrifugal force was replaced by gravity separation. Generally, the higher the shear put into creating the emulsion, the finer the droplets produced, and the more stable the emulsion. However, very stable emulsions are more difficult to break.Citation57 Therefore, the difficulty to recover oil-dispersed particles to the aqueous suspension takes on special importance when lower-sized particles are considered.
Figure 3 Influence of protocol extractions (A–F) on insulin-based particles recovery yield from the oil phase.
Note: Each value represents mean ± standard deviation, n=3.
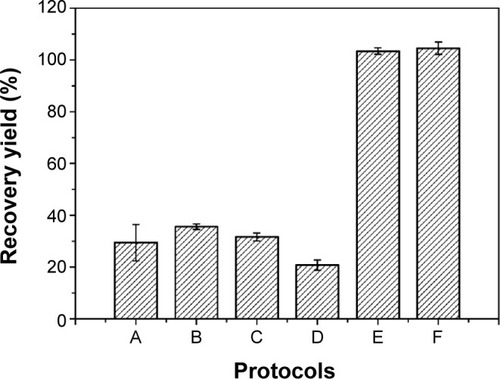
All protocols began with emulsion dissolution in hexane for 1 hour, which was considered as the minimum time for complete dissolution. Hexane is often used as a solvent for oil extraction due to its lower boiling point for easy removal after extraction, its nonpolar nature, and its low toxicity when compared to other solvents.Citation58 Protocols B–D were also ineffective as recovery media (). On the other hand, insulin content after the application of protocol E was 103.4%±1.2%, demonstrating its efficacy. Protocol E was composed of hexane, ethanol, and isopropanol. Ethanol and isopropanol are suitable solvents and have also been used on other nanoparticle formulations.Citation59 Bilati et al have shown that the mean particle size was dependent on polarity decrease,Citation60 and therefore mixtures of ethanol and isopropanol (less polar-solvent than ethanol) with different proportions were evaluated. In order to minimize the use of these organic solvents, acetate buffer pH 4.5 was included in the washing protocol and protocol F was chosen, enabling the overall quantification of insulin (). The attainment of recovery yields higher than 100%, as happened with particles recovered using protocols E and F, can be explained by some variations of volumes used during all steps included in particle production and recovery, which may change the theoretical insulin content to values higher or lower than expected. Nile red-stained oil phase allowed for the confirmation of effective oil removal from the aqueous phase, since all the fluorescence was present in the upper phase (oil phase) during decantation.
Removal of organic solvents
Organic solvents were removed from the extracted particles by rotoevaporation. The best conditions capable of removing all the organic solvents, keeping particles (with the maximum amount of insulin content) in the aqueous phase, were 40°C, 70 mbar, for 15 minutes. It is well established that all proteins unfold above their melting temperature.Citation61 The melting point described for insulin was 63°C±1°C, a point where both the size and the intensity start to increase significantly.Citation62 Below this temperature, insulin tertiary structure is believed to be stable;Citation37,Citation62 therefore, the chosen rotoevaporation temperature would not affect insulin tertiary structure. Furthermore, insulin is unaffected by pressures of 48,000 bar in the solid state at room temperature, which may be due to its relative rigidity combined with its small size.Citation63
Particle size analysis
The presence of aggregates was macroscopically observed after single surfactant-assisted particle recovery. Insulin and the biopolymers (both alginate and dextran sulfate) have opposite charges, allowing electrostatic interactions to occur, which may contribute to particle aggregation.Citation64
Size distribution of particles is shown in in terms of volume. Diameters of particles corresponding to percentiles of 10%, 50%, and 90% as well as span value are depicted in . Concerning single surfactant-assisted particles, two different populations can be observed: a small one consisting of nanoparticles and low-sized particles (<6 μm); and the main range consisting of higher-sized microparticles (D90=326±128 μm). These particles possess, therefore, a wide size distribution, with the predominant percentage being of microparticles, probably due to the presence of aggregates, and a lower percentage of low-sized particles.
Table 2 Granulometric distribution of particles
Figure 4 Size distribution of particles under the following processing steps.
Notes: Full circles: single surfactant-assisted particles. Empty circles: cosurfactant and ultrasonication-assisted particles. Full squares: after 5 minutes of ultrasonication exposure. Empty squares: after 10 minutes of ultrasonication exposure.
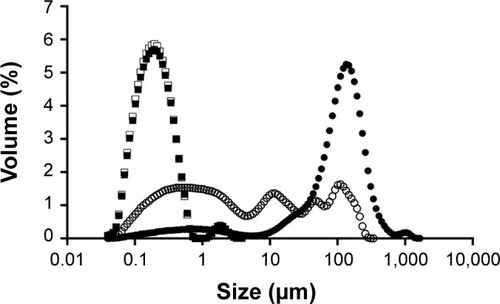
Emulsion optimization and recovery-medium development resulted in particles with a median size of 659 nm, with a higher population of particles in the nanometer range, while the higher-sized microparticles, which constituted the main population before, sharply decreased (D90=11±3 μm). The strategies implied in the emulsion optimization (blend of cosurfactants and ultrasonication add-on) were essential to the size reduction observed, since the emulsion droplets produced during the emulsification step originate the final particles. In order to achieve a unique population of nanoparticles, ultrasonication add-on after particle recovery was chosen as a strategy to eliminate or decrease aggregation and therefore to allow a narrower particle-size distribution. Maintaining the same amplitude applied in the emulsion optimization (60%), the effect of ultrasonication on particle-size distribution was evaluated and compared for 5 and 10 minutes. After 5 minutes of exposure to ultrasonication, particles showed a deviation to the left of the distribution curve (), predominantly to the nanoscale, with a slight and isolated population of approximately 2 μm. Consequently, the percentile values suffered a huge decrease, as can be seen in . After 10 minutes of ultrasonication, on the other hand, a single population of nanoparticles was observed. These particles were also analyzed by DLS. Results are depicted in , being consistent with the results obtained by LS and confirming the nanoscale size range of particles.
Zeta potential analysis
The results summarized in exhibit that alginate/dextran sulfate nanoparticles are strongly negatively charged with zeta potentials ranging from −53.4 to −60.4 mV. Negative zeta potential values are essentially due to surface charges of alginate and dextran sulfate chains at pH 4.5, which confer negative charges to nanoparticles. The charge behavior of nanoparticles was also studied at different pHs, namely at alginate pKa and at pH 1.5. At alginate pKa, alginate chains are almost neutral and the zeta potential of particles increased from −59.6 to −25.0 mV. Particle charge was due to sulfate dextran chains that remained permanently charged since they have a negative first pKa value and a second pKa value near 2.Citation65 At pH 1.5, blocks of dextran sulfate chains become positive and zeta potential increased to −9.2 mV. Thus, nanoparticle charge is essentially due to the matrix of alginate and dextran sulfate, which was proven by the charge behavior of nanoparticles at different pHs. No effect of rotoevaporation and ultrasonication was detected on nanoparticle zeta potential, highlighting the absence of any physical stability changes. Unloaded nanoparticles presented similar results compared to insulin-loaded nanoparticles, demonstrating no effect of insulin regarding particle charge. Zeta potential of insulin-loaded nanoparticles was expected to be less negative compared to unloaded nanoparticles, given the positive charge of insulin at pH below its isoelectric point: 5.3. The adsorption of insulin on the surface of nanoparticles may be assumed as negligible and insulin was mainly incorporated inside nanoparticles’ matrix. Zeta potential of both insulin-loaded and unloaded nanoparticles at pH 6.8 decreased approximately by 10 mV (data not shown), since the matrix of biopolymers became more ionized. The magnitude of zeta potential may indicate the potential electrostatic stability of nanoparticles, with values greater than 30 mV or less than −30 mV related to nanoparticles with higher stability in suspension and lower aggregation tendency. Particles are strongly charged at pH 4.5, which leads to the prevention of aggregation by repulsive forces upon random impact of adjacent particles, as previously reported.Citation66
Table 3 Zeta potential (mean ± standard deviation, n=3) of nanoparticles after each processing step at different pHs
Insulin EE
Insulin EE value was 99.3%±0.5%, higher than that previously reported by us.Citation24,Citation67 This high level can be attributed to the pH effect of nanoparticle components. Insulin has an isoelectric point at approximately pH 5.3Citation68 and alginate has pKa values of 3.38 and 3.65 for mannuronic and guluronic residues, respectively.Citation69 Therefore strong electrostatic attractions at the final pH of 4.5 may occur providing high EE of the oppositely charged protein.Citation24 Furthermore, calcium ions interact with the guluronic residues and can establish ionic bridges with negatively charged carboxylic residues of insulin, strengthening the association between insulin and alginate.Citation70 The addition of poloxamer 188 can also contribute to insulin EE due to steric stabilization by molecules of poloxamer.Citation66
Morphological analysis
The structure of single surfactant-assisted particles was examined by SEM (). Presence of agglomerates with individual particles of approximately 5 μm can be seen.
Figure 5 SEM microphotograph.
Notes: (A) Scale bar =20 μm; single surfactant-assisted particles. (B) Scale bar =1 μm; cryo-SEM microphotographs of cosurfactant and ultrasonication-assisted particles.
Abbreviation: SEM, scanning electron microscopy.
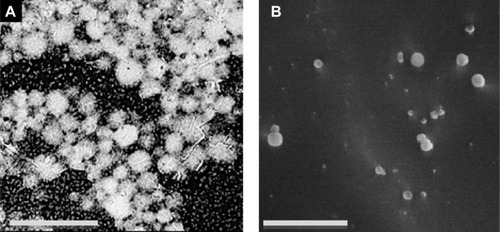
The structure of the cosurfactant and ultrasonication-assisted nanoparticles was verified by cryo-SEM, which demonstrated good sphericity and smooth surfaces (). The size of nanoparticles determined by morphological analysis is in accordance with the previously measured size (by LS and DLS), lying in the nanoscale range. The smooth and dense particle surface could be due to residual surfactants, as observed previously.Citation71
Although both particles demonstrated spherical shape, shows smaller particles with smoother surfaces. These particles were obtained from a more stable emulsion produced with cosurfactant and ultrasonication addition, which originated nanodroplets during emulsification. Small particles are known to dramatically enhance Brownian motion, which further prevents particle aggregation, offers increased stability,Citation72 and justifies the lower tendency of cosurfactant and ultrasonication-assisted particles to aggregate compared to single surfactant-assisted particles. Particles of have a more porous texture, contrary to particles of , probably because during the recovery step they lost a significant amount of water during centrifugation, leading to a change of the polymeric structure.Citation20 Furthermore, cosurfactant addition has been shown to make particles smoother and slightly porous in previous studies.Citation73
Insulin retention/release studies
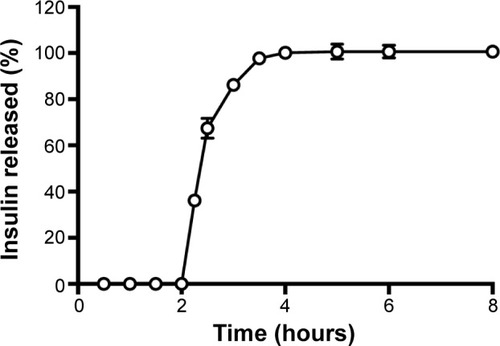
Insulin release from nanoparticles was studied as a function of time in enzyme-free simulated digestive fluids as illustrated in . Insulin-loaded nanoparticles showed the protective effect of biopolymers at the beginning in simulated gastric fluid during the first 2 hours. This retention capacity can be attributed to the gel strength of nanoparticles in the dissolution media, preventing the release of insulin from the formulation.Citation74 Then, a burst release of insulin was noticed under basic conditions (pH 6.8) simulating the intestinal environment. In this pH, polymers swell due to deprotonation,Citation75 allowing insulin release from nanoparticles. Total insulin release was achieved during the following 3 hours. The release profile of insulin showed a pH-dependent behavior, indicating that these nanoparticles are an effective controlled-delivery system for insulin. Previous studies with biopolymer particles also prepared with emulsification/internal gelation showed a burst release during the first 4 hours but a sustained release profile up to 10 hours, achieving only approximately 75% of cumulative-released insulin.Citation27 Although a sustained release of insulin is desired, insulin release should not take that long, unless particles are sufficiently mucoadhesive to stay in the intestinal epithelium, maintaining insulin structure for such a prolonged period of time.
Figure 6 Insulin release profile simulated in pH 1.2 gastric fluid for 2 hours followed by 4 hours in pH 6.8 intestinal fluid at 37°C.
Note: Each value represents mean ± standard deviation, n=3.
Quantum mechanical studies
Theoretical parameter analysis showed a relationship between highest occupied molecular orbital (HOMO) and lowest unoccupied molecular orbital (LUMO), dipole moment vector, and EE values (). GAP value is the difference between the energies of the frontier orbitals (HOMO-LUMO) and plays a critical role in chemical reactivity, which is related to intermolecular interactions.Citation76 Previous experimental resultsCitation77 revealed that the reinforcement of alginate matrix with dextran sulfate presented the highest insulin EE and one of the lowest particle sizes, compared to the other anionic polymers. Considering theoretical results for the reinforcement polymers, HOMO-LUMO gap () and dipole moment values of dextran sulfate were the closest to alginate values (). These findings can be directly related to important electrostatic interactions in nano complex formation and explain the high insulin EE found in our study.
Table 4 Theoretical studies of HOMO-LUMO gap and dipole moment of anionic polymers
Figure 7 Predicted interaction between biopolymers based on distribution of frontier molecular orbitals (HOMO and LUMO).
Notes: (A) HOMO-LUMO gap and (B) interaction between alginate (I) and dextran sulfate (II) based on their distribution coefficients of HOMO and LUMO, respectively. The positive and negative regions are represented by blue and red colors, respectively.
Abbreviations: HOMO, highest occupied molecular orbital; LUMO, lowest unoccupied molecular orbital.
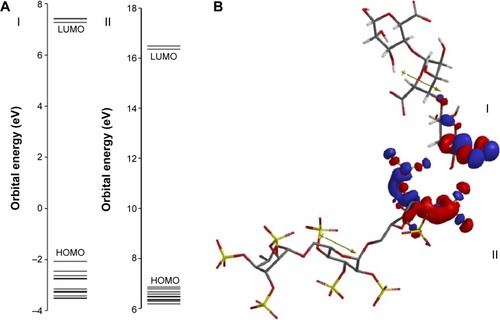
Besides, based on HOMO and LUMO distribution coefficients and dipole moment vector orientation, it was possible to predict the interactions between alginate and dextran sulfate (). Based on these results, it could be seen that the negatively charged groups of alginate remain free to establish electrostatic interactions with positively charged groups from the insulin surface. So, based on the HOMO and LUMO distributions coefficients, it was possible to suggest the interaction between the sodium alginate and dextran sulfate. Considering the high value of insulin EE (99.3%±0.5%) obtained with these nanoparticles, a correlation between theoretical studies and insulin EE can be predicted.
Conformational stability of insulin
CD and FTIR are techniques that can provide structural information about proteins. The spectroscopic characterization of protein secondary structure is often partially unreliable when samples are not extremely pure and abundant. This problem may be overcome by the combination of CD and FTIR.Citation78 The stability of insulin encapsulated and released from nanoparticles was evaluated using these two techniques at different time points. Conformational changes in the secondary structure of insulin during each processing of encapsulation were monitored by CD and FTIR analysis.
CD spectroscopy
The conformation of proteins or peptides is important for the exertion of optimal therapeutic effect and it can be easily damaged under conditions such as high temperature, mechanical manipulation, and exposure to organic solvents. Generally, the secondary structure (α-helix and β-sheet) can illustrate the efficacy of insulin. CD is regarded as one of the most effective methods to evaluate the secondary structures of proteins and peptides.Citation79
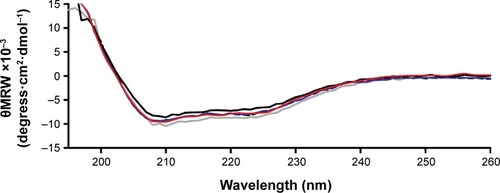
represents the CD spectra of insulin secondary structures. Nonencapsulated insulin showed two minima at 210 and 220 nm, which is typical of predominant α-helix structure proteins. These results were in agreement with results presented by other studies.Citation70,Citation80 CD spectra of insulin released from nanoparticles after recovery, rotoevaporation, or exposure to ultrasonication revealed no substantial alterations in the two α-helix minima when compared to nonencapsulated insulin. To better assess the structural transition, the CD spectra of insulin were de-convoluted through the software from the DICHROWEB websiteCitation41 and the results are displayed in . Practically no difference in the relative proportions of secondary structure elements was detected along the preparation of nanoparticles, suggesting no insulin fibrillation/aggregation among the conditions tested.
Table 5 Estimation results of the secondary structural content of insulin extracted from nanoparticles before and after recovery, rotoevaporation, and ultrasonication as obtained from circular dichroism spectral analyses
Figure 8 Circular dichroism spectra of insulin in phosphate-buffered saline at pH 7.4 and 25°C.
Notes: Solid black line: nonencapsulated insulin. Solid blue line: insulin released from nanoparticles after recovery. Solid red line: insulin released from nanoparticles after rotoevaporation. Solid grey line: insulin released from nanoparticles after ultrasonication exposure.
Abbreviation: θMRW, mean residue molar ellipticity.
FTIR analysis
The second-derivative FTIR spectra of insulin are represented in . Characteristic bands found in the infrared spectra of proteins and polypeptides include the amide I and amide II. Amide I absorption arises from the amide bonds that link the amino acids and is directly related to the backbone conformation, with a major contribution from C=O stretching vibration and minor contribution from the C–N stretching vibration. The major component of the amide I spectrum is the α-helix band, whereas the β-sheet and β-turn bands contribute less to the secondary structure.Citation81 The modifications of α-helix are the most characteristic of protein denaturation and consequent loss of activity. Nonencapsulated insulin in solution is dominated by α-helix content (1,655 cm−1), but also high- and low-frequency β-sheet content (1,682 and 1,614 cm−1).
Figure 9 Fourier transform infrared spectra of insulin.
Notes: Fourier transform infrared spectra of nonencapsulated reference insulin in solution (solid black line), nonencapsulated insulin in solution after 10 minutes of ultrasonication exposure (dashed black line), insulin entrapped into nanoparticles (solid grey line), and insulin entrapped into nanoparticles after 10 minutes of ultrasonication exposure (dashed grey line).
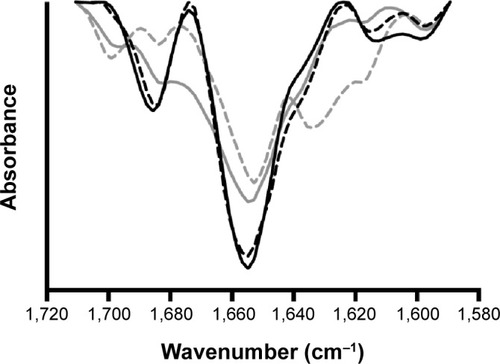
In the spectrum of nonencapsulated insulin in solution submitted to ultrasonication presented an area overlap of 0.92 compared to nonencapsulated insulin without processing, indicating that ultrasonication slightly affects insulin secondary structure. This structural modification motivated by ultrasonication was characterized just by a slight decrease on the α-helix band. The spectrum of insulin-loaded nanoparticles submitted to ultrasonication presented an area-overlap of 0.75 compared to nonencapsulated insulin in solution, which was similar to the formulation without ultrasonication (0.76), indicating that the native conformation of insulin changed with either ultrasonication or formulation procedure and those changes were quantitatively similar. Besides similar area-overlap values, it was noticed that after entrapment into nanoparticles, insulin structure changed, originating a decrease of α-helix and β-sheet content. Furthermore, after ultrasonication of insulin-loaded nanoparticles, the structure of insulin changed by decreasing its α-helix content at approximately 1,655 cm−1 and increasing β-sheet at 1,635 cm−1. These modifications are representative of insulin denaturation. The band at 1,700 cm−1 also indicated an unordered structural change. Besides the structural changes of insulin upon entrapment into nanoparticles and ultrasonication, the maintenance of α-helix band on the second-derivative amide I FTIR spectra, despite some decrease, still is a good indicator of insulin bioactivity. Additionally, possible structural rearrangements of insulin upon entrapment into nanoparticles may help to mitigate the decrease of insulin bioactivity.
Insulin biological activity
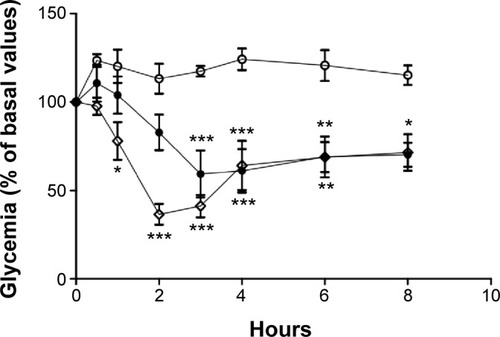
Blood glucose profiles following subcutaneous injection of insulin to diabetic rats at a dose level of 2 IU/kg are illustrated in and . Insulin released from nanoparticles and nonencapsulated insulin promoted a rapid and intense decrease of glycemia, hitting less than 20% of the initial values after 2 hours (). Then, blood glucose levels increased, reaching approximately 70%–90% of basal values at 8 hours. In the second study (), insulin entrapped into nanoparticles showed a slight and less-pronounced decrease of glycemia (57% of the initial values) than insulin released from nanoparticles, whereas nonencapsulated insulin provided a rapid and intense decrease of glycemia, which was, however, also less pronounced than in the first study (35% of the initial values). Then, blood glucose levels increased, reaching approximately 70% of basal values at 8 hours. Insulin entrapped into nanoparticles allowed a more controlled and smooth antihyperglycemic effect over time than insulin released from nanoparticles, which was already in the free form (isolated from the polymeric matrix) when subcutaneously administered, enabling a faster and abrupt effect. There were no statistical differences between groups treated with the same dose level of nonencapsulated insulin and insulin-loaded nanoparticles, confirming retention of insulin activity. The integrity of insulin after nanoformulation and, consequently, its biological activity were insured.
Figure 10 Blood glucose levels of diabetic Wistar rats after subcutaneous administration of insulin.
Notes: Full circles: nonencapsulated insulin. Empty diamonds: insulin released from nanoparticles. Comparison is made to extracted unloaded nanoparticles (empty circles). The formulations were administered in sodium citrate in phosphate-buffered pH 7.4 solution. Results are expressed as mean ± standard deviation, n=6 per group. Statistically different from empty nanoparticles: *P<0.5; **P<0.01.
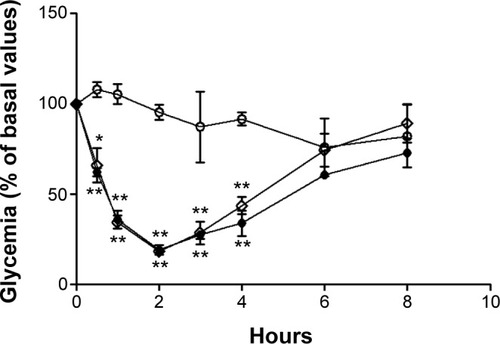
Figure 11 Blood glucose levels of diabetic Wistar rats after subcutaneous administration of 2 IU/kg of insulin in water.
Notes: Empty diamonds: nonencapsulated insulin. Full circles: insulin entrapped into nanoparticles. Comparison is made to unloaded nanoparticles (empty circles). The formulations were administered in water. Results are expressed as mean ± standard deviation, n=6 per group. Statistically different from empty nanoparticles: *P<0.05; **P<0.01; ***P<0.001.
Conclusion
Emulsification/internal gelation technique was successfully optimized to overcome drawbacks imposed by this technique, such as wide size distribution in the microscale and low recovery yield. These results demonstrated that ultrasonication add-on was an efficient strategy that allowed the reduction of the size of emulsion droplets and, therefore, the formation of particles in the nanoscale. This strategy was further improved using a blend of cosurfactants (sorbitan monooleate and poloxamer 188). The recovery of oil-dispersed nanoparticles was also developed, achieving a maximum of insulin content in the aqueous phase. The further submission of these particles to ultrasonication led to a monodisperse population of particles in the nanoscale, observed by the deviation of the size-distribution profile from the micrometric to the nanometric range and the decrease of respective span values.
Molecular modeling studies brought an unprecedented evaluation of quantum mechanics through studies of biopolymers interactions. Results showed a relationship between electronic properties and insulin EE. Furthermore, they indicated electronic requirements to improve EE, allowing for prediction of the interaction model between sodium alginate and dextran sulfate.
Strongly negatively charged nanoparticles with high insulin EE and insulin retention within nanoparticles in gastric simulation medium were obtained. The secondary structure of insulin tested by CD showed that insulin retains its biological activity during the process of encapsulation, while FTIR analysis showed rearrangements of insulin structure. However, biological activity of released insulin from nanoparticles after subcutaneous injection to diabetic Wistar rats demonstrated retention of insulin activity. Insulin entrapped into nanoparticles showed a slight and less-pronounced decrease than insulin released from nanoparticles, justified by the interaction of insulin with biopolymers.
This optimized methodology with mild conditions for insulin during encapsulation and easily manipulated procedures allowed for the preparation of alginate/dextran sulfate-based insulin-loaded particles in the nanometric range with retention of insulin activity, which has important applications for the pharmaceutical field.
Acknowledgments
The authors thank Fundação para a Ciência e Tecnologia (FCT) of Portugal (SFRH/BD/79123/2011) and Coordenação de Aperfeiçoamento de Pessoal de Nível Superior (CAPES) of Brazil.
Disclosure
The authors report no conflicts of interest in this work.
References
- CarinoGPJacobJSMathiowitzENanosphere based oral insulin deliveryJ Control Release2000651–226126910699286
- FontePAraújoFSilvaCPolymer-based nanoparticles for oral insulin delivery: Revisited approachesBiotechnol Adv. Epub2015226
- LopesMAAbrahimBASeiçaRVeigaFRodriguesCRRibeiroAJIntestinal uptake of insulin nanoparticles: facts or myths?Curr Pharm Biotechnol201415762963825219866
- LopesMAAbrahimBACabralLMIntestinal absorption of insulin nanoparticles: contribution of M cellsNanomedicine20141061139115124632248
- Déat-LainéEHoffartVGarraitGBeyssacEWhey protein and alginate hydrogel microparticles for insulin intestinal absorption: evaluation of permeability enhancement properties on Caco-2 cellsInt J Pharm2013453233634223796829
- SituWChenLWangXLiXResistant starch film-coated microparticles for an oral colon-specific polypeptide delivery system and its release behaviorsJ Agric Food Chem201462163599360924684664
- DuXZhangJZhangYDecanoic acid grafted oligochitosan nanoparticles as a carrier for insulin transport in the gastrointestinal tractCarbohydr Polym201411143344125037372
- SamantMBanerjeeSSTanejaNZopeKGhogalePKhandareJJBiophysical interactions of polyamidoamine dendrimer coordinated Fe3O4 nanoparticles with insulinJ Biomed Nanotechnol20141071286129324804549
- SakumaSHayashiMAkashiMDesign of nanoparticles composed of graft copolymers for oral peptide deliveryAdv Drug Deliv Rev2001471213711251243
- SoppimathKSAminabhaviTMKulkarniARRudzinskiWEBiodegradable polymeric nanoparticles as drug delivery devicesJ Control Release2001701–212011166403
- HwangWSTruongPLSimSJSize-dependent plasmonic responses of single gold nanoparticles for analysis of biorecognitionAnal Biochem2012421121321822146558
- HirnSSemmler-BehnkeMSchlehCParticle size-dependent and surface charge-dependent biodistribution of gold nanoparticles after intravenous administrationEur J Pharm Biopharm201177340741621195759
- HassaniSPellequerYLamprechtASelective adhesion of nanoparticles to inflamed tissue in gastric ulcersPharm Res20092651149115419205850
- AkbarNMohamedTWhiteheadDAzzawiMBiocompatibility of amorphous silica nanoparticles: Size and charge effect on vascular function, in vitroBiotechnol Appl Biochem201158535336221995538
- CuiXHunterWYangYChenYGanJBiodegradation of pyrene in sand, silt and clay fractions of sedimentBiodegradation201122229730720714921
- AlexakisTBoadiDKQuongDMicroencapsulation of DNA within alginate microspheres and crosslinked chitosan membranes for in vivo applicationAppl Biochem Biotechnol199550931067702366
- PonceletDLenckiRBeaulieuCHalleJPNeufeldRJFournierAProduction of alginate beads by emulsification/internal gelation. I. MethodologyAppl Microbiol Biotechnol199238139451369009
- QuongDNeufeldRJSkjåk-BrækGPonceletDExternal versus internal source of calcium during the gelation of alginate beads for DNA encapsulationBiotechnol Bioeng199857443844610099220
- RibeiroAJNeufeldRJArnaudPChaumeilJCMicroencapsulation of lipophilic drugs in chitosan-coated alginate microspheresInt J Pharm1999187111512310502618
- ReisCPRibeiroAJNeufeldRJVeigaFAlginate microparticles as novel carrier for oral insulin deliveryBiotechnol Bioeng200796597798917001630
- StopsFFellJTCollettJHMartiniLGFloating dosage forms to prolong gastro-retention – the characterisation of calcium alginate beadsInt J Pharm20083501–230131117964096
- AbbaspourMMakhmalzadehBSArastooZJahangiriAShiralipourREffect of anionic polymers on drug loading and release from clindamycin phosphate solid lipid nanoparticlesTrop J Pharm Res2013124477482
- MaTWangLYangTMaGWangSHomogeneous PLGA-lipid nanoparticle as a promising oral vaccine delivery system for ovalbuminAsian Journal of Pharmaceutical Sciences201493129136
- ReisCPRibeiroAJHoungSVeigaFNeufeldRNanoparticulate delivery system for insulin: design, characterization and in vitro/in vivo bioactivityEur J Pharm Sci200730539239717280820
- GaumetMGurnyRDelieFLocalization and quantification of biodegradable particles in an intestinal cell model: the influence of particle sizeEur J Pharm Sci2009364–546547319124077
- ZhangJPeppardTLReinecciusGADouble-layered emulsions as beverage clouding agentsFlavour Fragr J2015303218223
- SantosACCunhaJVeigaFCordeiro-da-SilvaARibeiroAJUltrasonication of insulin-loaded microgel particles produced by internal gelation: impact on particle’s size and insulin bioactivityCarbohydr Polym20139821397140824053820
- Corzo-MartínezMSoriaACVillamielMOlanoAHarteFMMorenoFJEffect of glycation on sodium caseinate-stabilized emulsions obtained by ultrasoundJ Dairy Sci2011941515821183016
- KimHYHanJAKweonDKParkJDLimSTEffect of ultrasonic treatments on nanoparticle preparation of acid-hydrolyzed waxy maize starchCarbohydr Polym201393258258823499099
- StathopulosPBScholzGAHwangYMRumfeldtJALepockJRMeieringEMSonication of proteins causes formation of aggregates that resemble amyloidProtein Sci200413113017302715459333
- FontePSoaresSCostaAEffect of cryoprotectants on the porosity and stability of insulin-loaded PLGA nanoparticles after freeze-dryingBiomatter20122432933923507897
- SahHProtein behavior at the water/methylene chloride interfaceJ Pharm Sci199988121320132510585229
- MorlockMKollHWinterGKisselTMicroencapsulation of rh-erythropoietin, using biodegradable poly(D,L-lactide-co-glycolide): protein stability and the effects of stabilizing excipientsEur J Pharm Biopharm19974312936
- KangFSinghJConformational stability of a model protein (bovine serum albumin) during primary emulsification process of PLGA micro-spheres synthesisInt J Pharm2003260114915612818819
- AndreasKZehbeRKazubekMBiodegradable insulin-loaded PLGA microspheres fabricated by three different emulsification techniques: investigation for cartilage tissue engineeringActa Biomater2011741485149521168535
- ICI Americas IncThe HLB System: A Time-saving Guide to Emulsifier SelectionWilmingtonICI Americas Inc1984
- SarmentoBMartinsSRibeiroAVeigaFNeufeldRFerreiraDDevelopment and comparison of different nanoparticulate polyelectrolyte complexes as insulin carriersInt J Pept Res Ther200612131138
- CanapleLRehorAHunkelerDImproving cell encapsulation through size controlJ Biomater Sci Polym Ed200213778379612296444
- TimmySAVictorSPSharmaCPKumariJVBetacyclodextrin complexed insulin loaded alginate microspheres – oral insulin deliveryTrends Biomater Artif Organs20021524853
- GürsoyAKarakuşDOkarIPolymers for sustained release formulations of dipyridamole-alginate microspheres and tabletted microspheresJ Microencapsul199916443945210420330
- WhitmoreLWallaceBADICHROWEB, an online server for protein secondary structure analyses from circular dichroism spectroscopic dataNucleic Acids Res200432Web Server issueW668W67315215473
- DongAHuangPCaugheyWSProtein secondary structures in water from second-derivative amide I infrared spectraBiochemistry19902913330333082159334
- FontePSoaresSSousaFStability study perspective of the effect of freeze-drying using cryoprotectants on the structure of insulin loaded into PLGA nanoparticlesBiomacromolecules201415103753376525180545
- DâasAHamdaouiOExtraction of anionic dye from aqueous solutions by emulsion liquid membraneJ Hazard Mater20101781–397398120211520
- ChaouchiSHamdaouiOAcetaminophen extraction by emulsion liquid membrane using Aliquat 336 as extractantSep Purif Technol20141293240
- AboubakarMCouvreurPPinto-AlphandaryHInsulin-loaded nanocapsules for oral administration: In vitro and in vivo investigationDrug Dev Res2000492109117
- WoitiskiCBSarmentoBCarvalhoRANeufeldRJVeigaFFacilitated nanoscale delivery of insulin across intestinal membrane modelsInt J Pharm20114121–212313121501675
- GullbergELeonardMKarlssonJExpression of specific markers and particle transport in a new human intestinal M-cell modelBiochem Biophys Res Commun2000279380881311162433
- FlorenceATNanoparticle uptake by the oral route: Fulfilling its potential?Drug Discov Today Technol200521758124981758
- des RieuxAFievezVGarinotMSchneiderYJPréatVNanoparticles as potential oral delivery systems of proteins and vaccines: a mechanistic approachJ Control Release2006116112717050027
- SilvaCMRibeiroAJFigueiredoMFerreiraDVeigaFMicroencapsulation of hemoglobin in chitosan-coated alginate microspheres prepared by emulsification/internal gelationAAPS J200674E903E91316594643
- MainardesRMEvangelistaRCPLGA nanoparticles containing praziquantel: effect of formulation variables on size distributionInt J Pharm20052901–213714415664139
- DickinsonEInterfacial interactions and the stability of oil-in-water emulsionsPure and Applied Chemistry19926417211724
- WuZMZhouLGuoXDHP55-coated capsule containing PLGA/RS nanoparticles for oral delivery of insulinInt J Pharm20124251–21822248666
- AttwoodDFlorenceATFASTtrack: Physical Pharmacy2nd edPharmaceutical Press2008
- AntonNBenoitJPSaulnierPDesign and production of nanoparticles formulated from nanoemulsion templates-a reviewJ Control Release2008128318519918374443
- AlvaradoVWangXMoradiMStability proxies for water-in-oil emulsions and implications in aqueous-based enhanced oil recoveryEnergies2011410581086
- NwabanneJTKinetics and thermodynamics study of oil extraction from fluted pumpkin seedInternational Journal of Multidisciplinary Sciences and Engineering2012361115
- SchubertMAMüller-GoymannCCSolvent injection as a new approach for manufacturing lipid nanoparticles – evaluation of the method and process parametersEur J Pharm Biopharm200355112513112551713
- BilatiUAllémannEDoelkerEDevelopment of a nanoprecipitation method intended for the entrapment of hydrophilic drugs into nanoparticlesEur J Pharm Sci2005241677515626579
- WangWInstability, stabilization, and formulation of liquid protein pharmaceuticalsInt J Pharm1999185212918810460913
- ElsayedARemawiMAQinnaNFaroukABadwanAFormulation and characterization of an oily-based system for oral delivery of insulinEur J Pharm Biopharm200973226927919508890
- MurphyRBAnomalous stability of insulin at very high pressureExperientia1978342188189624346
- NguyenVSRouxelDHadjiRVincentBFortYEffect of ultrasonication and dispersion stability on the cluster size of alumina nanoscale particles in aqueous solutionsUltrason Sonochem201118138238820667760
- ReisCPRibeiroAJVeigaFNeufeldRJDamgéCPolyelectrolyte biomaterial interactions provide nanoparticulate carrier for oral insulin deliveryDrug Deliv200815212713918293199
- WoitiskiCBNeufeldRJRibeiroAJVeigaFColloidal carrier integrating biomaterials for oral insulin delivery: Influence of component formulation on physicochemical and biological parametersActa Biomater2009572475248419362890
- Pinto ReisCNeufeldRJRibeiroAJVeigaFNanoencapsulation I. Methods for preparation of drug-loaded polymeric nanoparticlesNanomedicine20062182117292111
- ChienYWHuman insulin: basic sciences to therapeutic usesDrug Dev Ind Pharm1996228753789
- DragetKISkjåk BrækGSmidsrødOAlginic acid gels: the effect of alginate chemical composition and molecular weightCarbohydr Polym19942513138
- SarmentoBFerreiraDCJorgensenLvan de WeertMProbing insulin’s secondary structure after entrapment into alginate/chitosan nanoparticlesEur J Pharm Biopharm2007651101717101268
- MagenheimBBenitaSNanoparticle characterization: a comprehensive physicochemical approachS.T.P. Pharma Sciences19911221241
- SakulchaicharoenNO’CarrollDMHerreraJEEnhanced stability and dechlorination activity of pre-synthesis stabilized nanoscale FePd particlesJ Contam Hydrol20101183–411712720934234
- AhmedMMEl-RasoulSAAudaSHIbrahimMAEmulsification/internal gelation as a method for preparation of diclofenac sodium-sodium alginate microparticlesSaudi Pharm J2013211616923960820
- SoniMLKumarMNamdeoKPSodium alginate microspheres for extending drug release: formulation and in vitro evaluationInternational Journal of Drug Delivery 220106468
- GeorgeMAbrahamTEPolyionic hydrocolloids for the intestinal delivery of protein drugs: alginate and chitosan – a reviewJ Control Release2006114111416828914
- MurugavelSVijayakumarSNagarajanSPonnuswamyACrystal structure and DFT studies of 4-(1-Benzyk-5-Methyl-1H-1,2,3-Triazol-4-YL)-6-(3-Methoxyphenyl)Pyrimidin-2-AmineJournal of the Chilean Chemical Society20145926402646
- SilvaCMRibeiroAJFerreiraDVeigaFInsulin encapsulation in reinforced alginate microspheres prepared by internal gelationEur J Pharm Sci200629214815916952452
- AscoliGAPergamiPLuuKXUse of CD and FT-IR to determine the secondary structure of purified proteins in the low-microgram rangeEnantiomer199834–53713819861703
- PockerYBiswasSBConformational dynamics of insulin in solution. Circular dichroic studiesBiochemistry19801922504350497006683
- LiXQiJXieYNanoemulsions coated with alginate/chitosan as oral insulin delivery systems: preparation, characterization, and hypoglycemic effect in ratsInt J Nanomedicine20138233223293517
- NielsenLFrokjaerSCarpenterJFBrangeJStudies of the structure of insulin fibrils by Fourier transform infrared (FTIR) spectroscopy and electron microscopyJ Pharm Sci2001901293711064376