
Abstract
In this study, multifunctional hybrid-polymeric nanoparticles were prepared for the treatment of cultured multicellular tumor spheroids (MCTS) of the PANC-1 and MIA PaCa-2 pancreatic carcinoma cell lines. To synthesize the hybrid-polymeric nanoparticles, the poly lactic-co-glycolic acid core of the particles was loaded with Rhodamine 6G dye and the chemotherapeutic agent, Paclitaxel, was incorporated into the outer phospholipid layer. The surface of the nanoparticles was coated with gadolinium chelates for magnetic resonance imaging applications. This engineered nanoparticle formulation was found to be suitable for use in guided imaging therapy. Specifically, we investigated the size-dependent therapeutic response and the uptake of nanoparticles that were 65 nm, 85 nm, and 110 nm in size in the MCTS of the two pancreatic cancer cell lines used. After 24 hours of treatment, the MCTS of both PANC-1 and MIA PaCa-2 cell lines showed an average increase in the uptake of 18.4% for both 65 nm and 85 nm nanoparticles and 24.8% for 110 nm nanoparticles. Furthermore, the studies on therapeutic effects showed that particle size had a slight influence on the overall effectiveness of the formulation. In the MCTS of the MIA PaCa-2 cell line, 65 nm nanoparticles were found to produce the greatest therapeutic effect, whereas 12.8% of cells were apoptotic of which 11.4% of cells were apoptotic for 85 nm nanoparticles and 9.79% for 110 nm nanoparticles. Finally, the study conducted in vivo revealed the importance of nanoparticle size selection for the effective delivery of drug formulations to the tumors. In agreement with our in vitro results, excellent uptake and retention were found in the tumors of MIA PaCa-2 tumor-bearing mice treated with 110 nm nanoparticles.
Introduction
Human cancers result in high mortality ratesCitation1 due to the challenges faced in early detectionCitation2,Citation3 and treatment.Citation4 Although the majority of cancers initially respond to drug therapy, disease recurrence and metastasis are the primary causes of mortality among cancer patients.Citation5 Current treatments for managing cancer recurrence or metastases rely on the nonselective delivery of chemotherapeutic agents to the tumor sites.Citation6 However, such approaches are ineffective in treating the disease due to their toxic effects in normal tissues. Therefore, the need to engineer customizable drug therapies for a more personalized treatment of cancer is urgent and would lead to more specific treatments, allowing the individualized delivery of anticancer drugs to tumors and maximizing the therapeutic effects of the drugs. Another challenge faced in the treatment of cancer is the evolving nature of cancer biology throughout the course of treatment.Citation7 Therefore, a successful evaluation of potential therapies relies upon the concomitant development of new imaging modalities that enable the tumor response to the treatment to be monitored in real time. With the aid of the multimodal imaging tools, the drug formulation therapy can be adjusted accordingly as the disease progresses to different states. However, the currently available advanced imaging modalities, such as magnetic resonance imaging (MRI), positron emission tomography, computed tomography, and optical imaging, all have various limitations, such as sensitivity, resolution, and depth profiling.Citation8,Citation9 A single imaging modality is therefore unlikely to provide conclusive information on a particular therapeutic response. In this regard, the development of multimodal imaging tools is important to enable the cross-validation of the therapeutic effect of the drug formulations administered.Citation10 Thus, the development of individualized drug delivery platforms that can be used in conjunction with multimodal imaging is crucial to successfully combat human cancers.
Polymer-based nanoparticles have been shown to have a high degree of customizability and are thus suitable candidates for use in the individualized treatment of cancer.Citation11 Such particles exhibit many adjustable characteristics, such as their size,Citation12 zeta potential,Citation13 morphology,Citation14 drug loading,Citation15 and surface functionality.Citation16 Many studies have shown that these characteristics play key roles in determining the outcome of cancer treatments.Citation17 For example, targeted delivery can be achieved by functionalizing the nanoparticle surface with ligands that exhibit specific binding efficiency to the tumor cells.Citation18,Citation19 In addition, the nanoparticle surface can be modified using contrast agents, such as organic dyesCitation20 or radioisotopes, for multimodal imaging.Citation21 More importantly, both hydrophobic and hydrophilic drugs can also be incorporated in these nanoparticles for the effective therapy of cancers. For instance, Bisht et alCitation22 showed that such polymeric nanoparticles provide an excellent drug delivery vehicle for hydrophobic reagents, such as curumin, and the formulation showed significant anticancer effects. Similarly, Kim et alCitation23 presented a polymeric nanomedicinal platform loaded with ferric oxide nanocrystals and doxorubicin for use in simultaneous cancer-targeted imaging and drug delivery. Yu et alCitation24 reported that a preparation of polymeric hybrid nanoparticles comprising an outer polymer coating and an inner superparamagnetic iron oxide core could be used for tumor targeting and therapy in vivo.
Recent studies have shown that customizable nanoparticles have a great potential for the delivery of drug therapy to cancers by exploiting their size-dependent uptake and their ability to target the tumor tissues.Citation12,Citation25,Citation26 In this study, we show that newly engineered multifunctional hybrid-polymer nanoparticles can be used for the delivery of therapeutic reagents and the imaging of cancer both in vitro and in vivo. The synthesized nanoparticles had cores made of poly lactic-co-glycolic acid (PLGA),Citation27,Citation28 which are widely used for drug delivery applications.Citation29,Citation30 It should be noted that PLGA tends to degrade hydrolytically into nontoxic byproducts within 50–60 days in the body.Citation31,Citation32 The PLGA core was encapsulated with a phospholipid outer shell made of methoxy-poly(ethylene glycol)-1,2-distearoyl-sn-glycero-3-phosphoethanolamine-N (mPEG-DSPE) molecules.Citation33–Citation35 Moreover, both PLGA and mPEG-DSPE have been approved as chemical materials for pharmaceutical use by the US Food and Drug Administration,Citation35,Citation36 giving such nanoparticles great potential for future clinical developments. The PLGA core designed here was loaded with hydrophilic Rhodamine 6G to allow the uptake and penetration of the different sizes of nanoparticles to be monitored using fluorescent imaging.Citation37,Citation38 The PLGA core was then encapsulated with a phospholipid micelle to promote the solubility of the nanoparticle in the biological buffers. This also increased the bioavailability of the particles, enabling them to evade capture by the reticuloendothelial system.Citation39 The outer shell of the micelle region was loaded with Paclitaxel, a potent hydrophobic anticancer drug, for cancer therapy purposes.Citation40 To achieve multimodal imaging, the micelle surface was further functionalized with gadolinium chelates for MRI. By changing the molar ratio of PLGA and mPEG-DSPE, different sizes of nanoparticles could be prepared, allowing the synthesis of the optimal nanoparticle size for specific in vitro or in vivo applications. Unlike traditional cell monolayers, the MCTS models displayed more tumor-like features, allowing a better prediction of the in vivo tumor responses to different drug treatments.Citation41 Nanoparticle uptake and penetration studies using the MCTS model revealed that each cell line had a specific affinity toward different sizes of nanoparticles. For instance, we found that the MIA PaCa-2 cell line displayed the strongest affinity for 110 nm nanoparticles compared with 65 nm and 85 nm nanoparticles. Further therapeutic studies using the nanoparticles suggested that particle size had a slight effect on the overall therapeutic effect of the formulation. In the MCTS of the MIA PaCa-2 cell line, 65 nm nanoparticles produced the greatest therapeutic effect, of which 12.8% of cells were apoptotic; 11.4% of cells were apoptotic using 85 nm nanoparticles and 9.79% using 110 nm nanoparticles after 24 hours of treatment. These studies highlight that 110 nm nanoparticles are suitable for use as multifunctional probes in in vivo imaging and therapy applications. As a proof of concept, in vivo studies were performed on MIA PaCa-2 tumor-bearing mice treated with 65 nm, 85 nm, and 110 nm hybrid-polymeric nanoparticles. When the mice were administered with 110 nm nanoparticles, the tumor exhibited high nanoparticle retention, which was consistent with the in vitro studies of the MCTS model. In addition, the drug molecules were gradually released into the tumor site, allowing an effective drug delivery therapy in vivo. MRI imaging of the ex vivo tumor tissues revealed that the nanoparticles had indeed accumulated in the tumor cells as shown by the T1-weighted imaging process. The strength of multimodal imaging was therefore clearly shown from these in vivo experiments, in which fluorescence and MRI techniques were used to verify the distribution of nanoparticles in the tumor. Our results highlight the potential of using customizable multifunctional nanoparticle formulations for the individualized treatment of cancer in the future. Such approaches could potentially revolutionize the treatment of cancer, allowing the maximization of therapeutic effects from the nanoformulation and concomitantly minimizing the side effects caused during drug therapies.
Materials and methods
Cell culture
Human prostate cancer cell line PC-3 and human pancreatic cancer cell lines PANC-1 and MIA PaCa-2 were purchased from the American Type Culture Collection (ATCC, Manassas, VA, USA). Penicillin-Streptomycin 100 μg/mL, and Ham’s F-12K (Kaighn’s) Medium were purchased from Gibco (Life Technologies, SG, Singapore). Dulbecco’s Modified Eagle’s Medium ([DMEM], Hyclone) and fetal bovine serum ([FBS], Hyclone) were purchased from Thermo Fisher Scientific. PANC-1 cells were maintained in a culture with DMEM, supplemented with 10% FBS, Penicillin-Streptomycin (100 μg/mL). MIA PaCa-2 cells were cultured in DMEM supplemented with 10% FBS, 2.5% horse serum (ATCC), 100 μg/mL penicillin, and streptomycin. PC-3 cells were cultured in F-12K with 10% FBS, Penicillin-Streptomycin (100 μg/mL). 2×10³ cells were resuspended in medium (5 mL per 70 mm dish). The cultures were maintained at 37°C in a humidified atmosphere with 5% CO2 inside an incubator.
Culturing of multicellular spheroid tumors
The preparation of the multicellular tumor spheroids (MCTS) was performed using the hanging droplet method.Citation42,Citation43 For each cell line, a single cell suspension was obtained from the cell cultures prepared in 2.1 after each culture had reached 90% confluence. Using a hemacytometer, the cell concentration within the cell suspension then adjusted by adding the appropriate medium until a concentration of 2×10⁴ cells/mL was reached. Next, with a pipette, 25 drops of 20 μL of the cell suspension were deposited onto the lid of a 70 mm Petri dish in a 5×5 matrix. Approximately 5 mL of phosphate buffered saline (PBS) was put into the base of the Petri dish, and the lid was then inverted and used to cap the Petri dish base. The hanging drop cultures were then maintained in a humidified incubator at 37°C with 5% CO2. After an incubation period of 4 days, cellular aggregation occurred and MCTS were formed. The mean tumor size used was 263,119±26,032 μm2.
Preparation of multifunctional hybrid-polymer nanoparticles
50:50 Poly(dl-lactide/glycolide) copolymer (PLGA), molecular weight (MW) 150,000 Da was purchased from Polysciences (Taipei, Taiwan), mPEG-DSPE MW 2,000 Da, mPEG-DSPE amine (mPEG-DSPE-NH2), methoxy-poly(ethylene-glycol)-thiol MW 2,000 Da and methoxy-poly(ethylene glycol)-succinimidyl succinate MW 2,000 Da were purchased from Laysan Bio, Inc. (Arab, AL, USA). Rhodamine 6G, gadolinium(III) chloride hexahydrate and chloroform were purchased from Sigma Aldrich (Singapore). Paclitaxel was obtained from TCI Chemicals (Tokyo, Japan). 1,4,7,10-Tetraazacyclododecane-1,4,7,10-tetraacetic acid mono (N-hydroxysuccinimide ester) (DOTA-NHS-ester) was purchased from Macrocyclics (Dallas, TX, USA). PLGA was dissolved in chloroform solvent to make up a concentration of 80 mg/mL together with an appropriate concentration of Paclitaxel and Rhodamine 6G, forming an organic solution. An aqueous phospholipid solution was then prepared with a 5:1 molar ratio of mPEG-DSPE and mPEG-DSPE-NH2 to 1 mg/mL concentration. The organic solution was then added dropwise to the aqueous solution under sonication with a tip sonicator (Sonic Dismembrator, ultrasonic Processor FB-505, Thermo Fisher Scientific). The addition of the organic solution stopped when the target ratio of PLGA/DSPE was reached. Six different PLGA/DSPE ratios were used such as 0.05, 0.1, 0.2, 0.4, 0.8, and 1.6. The PLGA/DSPE ratios were varied by adjusting the amount of PLGA, while keeping mPEG-DSPE constant at 1 mg/mL. The resulting nanoparticle mixture was then put into a vacuum desiccator at 28°C for 12 hours to evaporate the excess chloroform. After which, surface modification of the mPEG-DSPE-NH2 amine groups was achieved by adding DOTA-NHS-ester in excess (1 mg/mL) at pH 8.5 and incubating for 48 hours at 28°C. Next, gadolinium was added in excess (1 mg/mL) at pH 8.0 and incubated for 48 hours at 28°C. Finally, the nanoparticle mixture was purified for 72 hours, undergoing four cycles of dialysis against PBS pH 7.4 with molecular weight cutoff (MWCO) 12,000 Da dialysis tubing.
Particle size and zeta potential characterization
Mean particle size was measured using dynamic light scattering (DLS). DLS and zeta potential were determined using the NanoBrook 90Plus Particle Size Analyzer (Brookhaven Instruments, Holtsville, NY, USA). Each measurement was performed in triplicate, and a total of four different samples were measured for each data point. Both particle sizing and zeta potential measurements were performed at 10× dilution with deionized (DI) water.
Rhodamine 6G and Paclitaxel loading measurement
Ultraviolet visible (UV–Vis) spectroscopy was performed using quartz cuvettes to measure the absorption of the nanoparticle solutions with reference to DI water (UV-Vis Spectrometer UV-2450, Shimadzu Instruments). The degree of absorption was measured at 530 nm and 227 nm for Rhodamine 6G and Paclitaxel, respectively. The concentration of each component was then calculated using the Beer–Lambert Law.
Imaging nanoparticles with scanning electron microscopy and transmission electron microscopy
For scanning electron microscopy (SEM), the nanoparticle solutions to be examined were diluted four times and then 10 μL droplets were placed onto a silicon wafer. The droplets were then left to dry completely within a vacuum desiccator. After which, it was sputter coated with a thin layer of gold, and then the particles were imaged under an SEM (LEO 1550 Gemini). For transmission electron microscopy (TEM), the nanoparticle solutions were diluted two times and then 10 μL droplets were placed onto TEM copper grids and left to dry in a vacuum desiccator. The particles were then imaged under TEM (JEOL JEM 2010/F) at 100 kV accelerating potential and imaged with a GATAN Multiscan CCD camera.
Nuclear magnetic resonance T1 relaxation characterization
Nanoparticle solutions of four different sizes (100 nm, 90 nm, 80 nm, 75±2 nm) were prepared in four different dilutions of mPEG-DSPE (1 mg/mL, 0.5 mg/mL, 0.25 mg/mL, and 0.125 mg/mL), with DI water for characterization of their T1 relaxation time by using phantom imaging (Siemens Magnetron Trio, Siemens Healthcare, Erlangen, Germany). A spin-echo inversion recovery sequence was used with a field of view of 250×250 mm, matrix size of 128p ×128s, recovery time of 3,000 ms and inversion times of 100–3,200 ms. Images were acquired using a flex coil and at a magnetic field strength of 3 T.
In vitro fluorescence uptake studies of nanoparticles into spheroids
Three different sizes (65 nm, 85 nm, 110 nm) of nanoparticle formulations were prepared as mentioned in Section “Preparation of multifunctional hybrid-polymer nanoparticles” with equal concentrations of Rhodamine 6G (0.5 μg/mL). Five microliters of each of the prepared nanoparticle solutions were then administered to each of the 20 μL droplets, which contain one formed spheroid each. The spheroids were then maintained in a humidified incubator at 37°C with 5% CO2. The bright field and fluorescence images of spheroid cultures were obtained by using an inverted microscope (Nikon Eclipse Ti-U) at 10× magnification. This procedure was repeated for the three examined cell lines, PANC-1, MIA PaCa-2, and PC-3. The spheroids were imaged at 1 hour, 2 hours, 3 hours, 6 hours, and 24 hours after administration of the nanoparticle formulation. Fluorescence images were obtained using a filter set with excitation 525 nm and emission 555 nm (Chroma Technology Corp, Bellows Falls, VT, USA). Image analysis was performed with the microscope vendor software. Single factor analysis of variance at the 95% significance level was used to analyze the statistical significance of the results.
In vitro spheroid treatment studies
Nanoparticle formulations were prepared as mentioned in the section “Preparation of multifunctional hybrid-polymer nanoparticles” with approximately equal concentrations of Rhodamine 6G (0.5 μg/mL) and Paclitaxel (137.5±22.7 nM) to make nanoparticles of three different sizes (65 nm, 85 nm, and 110 nm). For the control studies, similar nanoparticle formulations (65 nm, 85 nm, and 110 nm) were prepared and tested. Five microliters of each of the prepared nanoparticle solutions were then administered to each of the 20 μL droplets, which contain one formed spheroid each. The spheroids were then maintained in a humidified incubator at 37°C with 5% CO2. After 24 hours of incubation, the spheroids were harvested by washing with PBS off the lids of the Petri dishes. The spheroids were then centrifuged at 4,000 rpm for 4 minutes to concentrate the cells. Propidium iodide (PI) in DMSO (2 μL/mL) was then added to the spheroids, and a pipette was used to homogenize the cell suspension solution and create a single cell suspension. The mixture was then left to incubate for 30 minutes without exposure to light and then PI and DMSO were removed through centrifugation, and the cells were resuspended in PBS. Flow cytometry was then performed with an excitation and emission filter set of 540 nm and 620 nm, respectively, for PI as the marker. Optical compensation was performed with single-stained compensation control samples, where the cells were stained with only Rhodamine 6G and another with only PI.
In vitro release studies
In vitro release profiles of Paclitaxel from the fabricated nanoparticles were investigated in an aqueous medium containing PBS. Three sized 65 nm, 85 nm, and 110 nm nanoparticles, with equal concentrations of 1 mg/mL DSPE and 137.5±22.7 nM Paclitaxel were investigated. One milliliter (1 mg/mL concentration) of each nanoparticle solution was sealed into a dialysis membrane bag (MWCO 12,000 Da). Each dialysis bag was then placed into a 20 mL glass bottle containing 19 mL of PBS solution under slight agitation. At preset time intervals, 1 mL of the PBS solution was withdrawn for UV-Vis spectroscopy in quartz cuvettes to measure the absorption of the nanoparticle solutions with reference to PBS solution (UV-Vis Spectrometer UV-2450, Shimadzu Instruments). The absorption spectra were measured and monitored for Paclitaxel at 227 nm and for Rhodamine 6G at 530 nm. The concentrations of Paclitaxel and Rhodamine 6G can be estimated using the Beer–Lambert Law. After each measurement, the PBS within the samples was replaced with 19 mL of fresh PBS solution. This procedure was repeated at 4°C to determine the release of Paclitaxel and Rhodamine 6G during storage. For the release studies using FBS, 1 mg of nanoparticles were incubated in 20 mL of 10% FBS solution. At predetermined time intervals, 1 mL of solution was withdrawn, and the nanoparticles were then pelleted using ultra-centrifugation at 15,000 rpm. The pellet was then purified by removing the supernatant and washed twice with DI water and resuspended into a solution for analysis to determine the amount of Paclitaxel and Rhodamine 6G released.
In vivo studies of nanoparticle retention
Athymic nude mice (BALB/cASlac-nu, female) of 5–6 weeks of age were obtained from Shanghai Slac Laboratory Animal, Chinese Academy of Sciences (Licensing number: SCXK-2007-0005). Human cell line experiments were approved by the Nanyang Technological University Biological Safety Committee (BPN-0001-2012-EEE) and the Office of Health and Safety (RA_EEE_5528). Animal research was carried out in compliance with the National Standard of Animal Care and Use Procedures (20080820). The mice were kept in an isolated biosafety facility for specific pathogen free (SPF) animals with bedding, food, and water. Tumor growth was monitored every 24–48 hours until these tumors exceeded 100–150 mm3 in volume (~10–15 days posttransplantation of cells). After which, the mice were administered with subcutaneous injections near the site of the tumors with 100 μL of nanoparticle solution (1 mg/mL). Three mice were used, and each mouse was injected with a nanoparticle solution containing particles of different sizes such as 65 nm, 85 nm, and 110 nm. After injection, mice were anesthetized with 50 μL pelltobarbitalum natricum (10 mg/mL) per injection. Then the mice were imaged using the IVIS Lumina II in vivo optical imaging system (Perkin Elmer, Waltham, MA, USA; excitation: 480 nm, emission: 555 nm) at specific time points (1 hour, 3 hours, and 48 hours after injection), to monitor biodistribution of the nanoparticles. After 48 hours of observation, the mice were anesthetized, and the tumors were removed for MRI under a magnetic field of 3 T using a flex coil (Siemens Magnetron Trio, Siemens Healthcare, Erlangen, Germany). A total of four sequences were used: T1-weighted spin-echo, T1-weighted spin-echo fat-saturation, T2-weighted turbo spin-echo, and T2-weighted turbo spin-echo fat-saturation. For T1-weighted measurements, an echo time of 10 ms, recovery time of 414 ms, field of view of 200×200 mm, and matrix size of 192p ×250s were used. For T2-weighted measurements, an echo time of 87 ms, recovery time of 3,381 ms, field of view of 200×200 mm, and matrix size of 336p ×448s were used.
Results and discussion
Synthesis and characterization of hybrid-polymeric nanoparticles
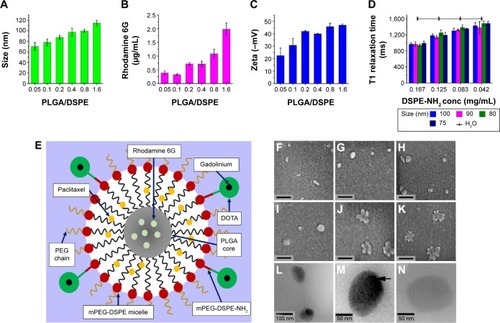
The hybrid-polymeric nanoparticles comprised of an inner core of PLGA, which encapsulated Rhodamine 6G dye. This core was surrounded by an outer micelle shell into which the drug Paclitaxel was incorporated. The nanoparticles were prepared by a single-step sonication method modified from Fang et al.Citation44 The micelle shell was made up of a mixture of mPEG-DSPE and mPEG-DSPE-NH2 phospholipids. Using the NH2 functional group, surface functionalization of the particle was carried out using DOTA-NHS ester. DOTA then functioned as a chelating agent to bind gadolinium MRI contrast agent to the surface of the nanoparticle. A schematic representation of this is given in . The size of the nanoparticles could be tailored by manipulating the ratio of PLGA and DSPE that was added to the reaction mixture. shows the hydrodynamic diameter of the nanoparticles prepared (). We found that the nanoparticle size increased as the molar ratio of PLGA/DSPE increased. The smallest nanoparticle with the size of 70±7.44 nm was obtained with a low PLGA/DSPE ratio of 0.05, and largest size of 114±5.11 nm was obtained using a PLGA/DSPE ratio of 1.6. The morphology of the fabricated nanoparticles was examined using SEM (). The particles prepared using lower PLGA/DSPE ratios () appeared to be rod shaped and have an average width and length of 35 nm and 110 nm, respectively. When the PLGA/DSPE ratio was increased, larger and more spherical particles were formed, as shown in . The morphology of the nanoparticles underwent another distinct change when the size approached 200 nm. As observed in , an irregular shape was observed and most of the particles appeared to have a rough boundary surface. TEM was also used to examine the internal structure of the fabricated nanoparticles. As seen in , a relatively dense region was observed in the center region of the particles. Conversely, when no PLGA was added, no dense region was observed (), indicating that the PLGA core was encapsulated within the mPEG-DSPE micelle. The loading efficiency of Rhodamine 6G within the nanoparticles was determined by using UV-Vis spectroscopy. The increment of Rhodamine 6G concentration within the nanoparticles was nonlinear, with higher concentrations of Rhodamine 6G being entrapped in the particle as the PLGA/DSPE ratio increased. The same characterization method was performed for Paclitaxel encapsulated in the nanoparticles. The concentration of Paclitaxel remained relatively constant at 137.5±22.7 nM, regardless of the PLGA/DSPE ratio used in the synthesis process, which was to be expected because the mPEG-DSPE concentration was kept constant at 1 mg/mL. As reported by Ip et al,Citation45 such a synthesis process would first create multilayered lipid layers embedded with the hydrophobic drugs. PLGA, when added to this system, would be encapsulated by the micelles, forming a single-layered micelle system. These processes would explain why the Paclitaxel concentration remained constant within a nanoparticle system at a constant concentration of mPEG-DSPE. The zeta potential is an important factor in maintaining the colloidal stability of particle dispersion.Citation46 In our study, the larger nanoparticles had zeta potential values ranging from −40.0 mV to −46.9 mV and smaller nanoparticles had values ranging from −22.5 mV to −30.7 mV. The surface of the nanoparticles was then further functionalized with gadolinium chelates, thereby allowing the particles to exhibit contrast enhancement for MRI. A T1 relaxometry study revealed no significant differences in T1 relaxation time between nanoparticles of different sizes. It should be noted that gadolinium chelates are directly associated with the DSPE-NH2 molecule, and thus, the major factor that would determine relaxation time would be the total amount of DSPE-NH2 available within a nanoparticle. As shown in , nanoparticles prepared with a higher concentration of DSPE-NH2 (0.167 mg/mL) exhibited a mean relaxation time of 967.3 ms. In contrast, a lower concentration (0.04 mg/mL) of DSPE-NH2 resulted in a mean relaxation time of 1,442.5 ms, suggesting that an effective concentration of at least 0.04 mg/mL DSPE-NH2 is required to obtain good contrast enhancement for MRI. Finally, it has been suggested that fluorescence dyes loaded in a bare PLGA core may migrate to the cellular membranes upon contact.Citation47 In our study, the PLGA core was encapsulated in an outer phospholipid shell, which prevented loaded core reagents from diffusing outward.Citation48 In addition, the outer shell contained outward facing PEG chains (), preventing direct contact between the lipid layers of the nanoparticles and the outer membrane of a cell and blocking the adsorption of the dye into the cells.Citation49 Other studies performed with similar nanoparticle structures have shown a strong association of the loaded dyes with the nanoparticles.Citation50
Figure 1 Characterization of the synthesized multifunctional nanoparticles.
Notes: (A) Size dependence of nanoparticles synthesized with different ratios of PLGA and mPEG-DSPE (PLGA/DSPE). (B) Loading efficiency of Rhodamine 6G in the nanoparticles prepared by with PLGA/DSPE ratios. (C) Zeta potential of nanoparticles synthesized with different PLGA/DSPE ratios. (D) T1 relaxation time for four different sizes of nanoparticles at different concentrations. (E) Schematic diagram of the nanoparticle structure. (F–K) Scanning electron microscopy images of nanoparticles, the scale bars represent 200 nm. (L) TEM image showing the structure of the nanoparticles. (M) High magnification of the TEM image showing the nanoparticles with a denser PLGA inner core. (N) High magnification of the TEM image showing an empty nanoparticle fabricated without the addition of PLGA. (Error bars indicate the standard deviation and the number of samples used in each measurement, n=4).
Abbreviations: DSPE, distearoyl-sn-glycero-3-phosphoethanolamine-N; PLGA, poly lactic-co-glycolic acid; TEM, transmission electron microscopy; MCTS, multicellular tumor spheroids; h, hours.
In vitro study of uptake and penetration of nanoparticles
The cellular uptake and penetration of nanoparticle treatments are important parameters to be considered when designing the physicochemical property of the nanoparticle because they will determine the overall therapeutic action on the tumor cells. In this study, multifunctional nanoparticles of different sizes, 65 nm (σ =4.85), 85 nm (σ =6.57), and 110 nm (σ =9.94), were tested in the MCTS () of different cell lines. Additional information on the size distribution of the prepared nanoparticle formulations is provided in the supporting information (). Fluorescence imaging analysis was then performed for each MCTS models at different time intervals. To date, it has been shown that the penetration and uptake of nanoparticles in tumor tissue can be due to several factors. In our study, the uptake and penetration of nanoparticles into the tumor spheroids were probably a result of the interstitial flow of nanoparticles into the tumor matrix.Citation25 Basically, a relatively high density of nanoparticles was surrounded by the tumor interfaces. Thereafter, the receptor-mediated endocytosis pathway may have helped the nanoparticles to migrate into the tumor spheroid tissues.Citation51 These pathways may be mediated by proteins, such as clathrin and dynamin,Citation52 which may be absorbed onto the nanoparticle surface, thereby allowing them to be taken up by the tumor spheroids through the endocytosis process. Our data suggested that indeed each MCTS cell line displayed size-selective uptake and penetration for different sizes of nanoparticles.
Figure 2 Uptake of different sizes of nanoparticles (65 nm, 85 nm, and 110 nm) in the MCTS of the PANC-1, MIA PaCa-2, or PC-3 cell lines.
Notes: (A) Normalized relative fluorescence intensity of the MCTS of the PANC-1 cell line at different time intervals. (B) Normalized relative fluorescence intensity of the MCTS of the MIA PaCa-2 cell line at different time intervals. (C) Normalized relative fluorescence intensity of the MCTS of the PC-3 cell line at different time intervals. For the MCTS of the PANC-1 cell line treated with 65 nm, 85 nm, and 110 nm nanoparticles at 1 hour, 6 hours, and 24 hours: (D–F) bright field images, (G–I) fluorescence images with the white arrow highlighting the uneven distribution of the nanoparticles, and (J–L) intensity maps showing the relative fluorescent intensity of different regions of the MCTS of PANC-1. For the MCTS of the MIA PaCa-2 cell line treated with 65 nm, 85 nm, and 110 nm nanoparticles at 1 hour, 6 hours, and 24 hours: (M–O) bright field images, (P–R) fluorescence images, and (S–U) intensity maps showing the relative fluorescent intensity of different regions of the MCTS of MIA PaCa-2. The scale bar represents 100 μm. Error bars indicate the standard deviation and the number of samples used in each measurement (n=4). *Indicates statistical difference (P<0.05) amongst the three mean fluorescent measurements at that time point, obtained from the testing of the three nanoparticle solutions based on the single variable analysis of variance test.
Abbreviations: MCTS, multicellular tumor spheroids; PLGA, poly lactic-co-glycolic acid; DSPE, distearoyl-sn-glycero-3-phosphoethanolamine-N; h, hours.
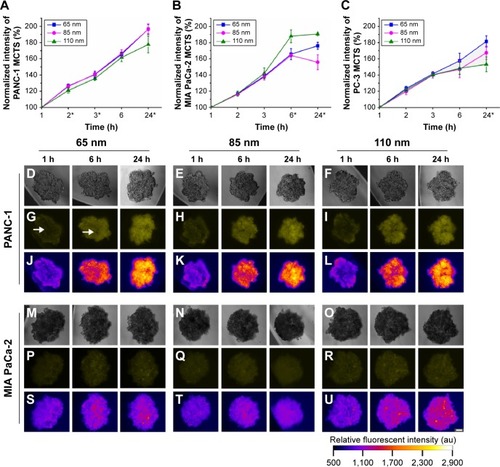
In the MCTS of the PANC-1 cell line, 85 nm nanoparticles had the most favorable uptake and penetration. In the in vitro penetration studies (), the MCTS of the PANC-1 cell line revealed a non-uniform nanoparticle distribution within the first 6 hours of treatment for all sizes of nanoparticle administered, which was particularly obvious in the PANC-1 sample treated with 65 nm nanoparticles, as indicated in . The inner core region had a lower fluorescent intensity compared with the peripheral regions, indicating less nanoparticle accumulation. Even after 24 hours of treatment, the MCTS of the PANC-1 cell line treated with 65 nm () and 110 nm () nanoparticles still showed a sizeable central region with low fluorescent intensity, indicating a low uptake of nanoparticles. For MCTS of the PANC-1 cell line treated with 85 nm nanoparticles (), a similar trend was also observed after the first 6 hours of treatment. However, after 24 hours, the central regions had a much higher fluorescent intensity compared to the peripheral regions, indicating that the nanoparticles had successfully penetrated the core of the MCTS. The MCTS of the PANC-1 cell line was incubated with free Rhodamine 6G to serve as a positive control, and the results are provided in the supplementary material (). The data from the uptake studies of the different sizes of nanoparticles in the MCTS of the PANC-1 cell line further suggest that 85 nm is the optimum size for the treatment of the PANC-1 cell line (). The 85 nm nanoparticles showed the highest uptake, on a par with the 65 nm nanoparticles and 18.8% higher than that of 110 nm nanoparticles. The 85 nm nanoparticles thus had both optimum uptake and penetration characteristics for MCTS models of the PANC-1 cell line.
In the MIA PaCa-2 cell line, the nanoparticle uptake and penetration studies on the MCTS model show that 110 nm nanoparticles had the optimum uptake and penetration. In the nanoparticle uptake studies, an increase in average uptake of 24.8% was observed for 110 nm nanoparticles compared to that of the 65 nm and 85 nm nanoparticles () after 24 hours of treatment. The penetration studies showed that MIA PaCa-2 MCTS exhibited a relatively uniform uptake throughout for all three particle sizes tested, as shown by the uniform fluorescent intensity of the images (). These results suggest that excellent uptake and penetration of nanoparticles in the tumor spheroids can be achieved using a particle size of 110 nm. This size-selective uptake behavior characteristic has also been observed in other cell lines, such as PC-3, which is of prostate cancer origin. A similar uptake preference was observed for 65 nm nanoparticles in PC-3 MCTS (). These results suggest that nanoparticles size plays a key role for targeted imaging as well as therapeutic applications.
Therapeutic effects of multifunctional nanoparticles in vitro
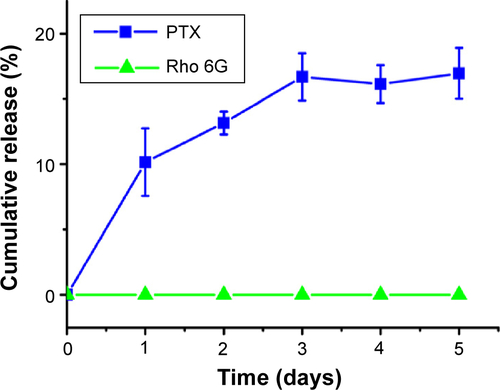
The therapeutic effects of the prepared multifunctional nanoparticles on the MCTS of PANC-1 and MIA PaCa-2 cell lines were evaluated. The nanoparticles were loaded with the same concentration of Paclitaxel (137.5±22.7 nM). From the in vitro release studies (), drug release from the nanoparticles showed an average gradual release of 30.4% of the total loaded drug over 24 hours for all three nanoparticle sizes dispersed in PBS. In addition, the in vitro release study was carried out in the presence of 10% FBS to examine its effects on the release of Paclitaxel and Rhodamine 6G from the nanoparticles. A more rapid release of Paclitaxel was observed, and more than 73% of the total loaded drug was found to be released over 24 hours for all three nanoparticle sizes. Rhodamine 6G was well protected within the PLGA inner core, and no release of the dye was observed over a 24-hour examination period. The release of Paclitaxel and Rhodamine 6G from the designed nanoparticles at 4°C was also examined and the results can be found in the supporting information ().
Figure 3 Flow cytometry was used to investigate the relationship between the size and therapeutic effect of the multifunctional nanoparticles in the MCTS of the MIA PaCa-2 cell line.
Notes: (A) The percentage of MIA PaCa-2 cells in apoptosis after 24 hours of treatment with nanoparticles of 65 nm, 85 nm, and 110 nm. (B) In vitro release studies of the anticancer drug Paclitaxel (PTX) and Rhodamine 6G (Rho 6G) from 65 nm, 85 nm, and 110 nm nanoparticle formulations. Dotted lines and solid lines indicate in vitro studies performed in PBS and FBS, respectively. Rhodamine 6G release was examined in both PBS and FBS, represented by the dashed lines. (C–F) Flow cytometry results showing the cell count (y-axis) and propidium iodide fluorescent intensity (x-axis) of cells from MIA PaCa-2. (Vertical lines indicate the standard deviation and the number of samples used in each measurement, n=4). *Indicates statistical difference (P<0.05) using single variable analysis of variance (ANOVA) between the three treated groups. #Indicates statistical difference (P<0.05) using single variable ANOVA between the Paclitaxel release from the different sizes of nanoparticles.
Abbreviations: MCTS, multicellular tumor spheroids; PBS, phosphate buffered saline; FBS, fetal bovine saline; PTX, Paclitaxel; h, hours; NP, nanoparticles.
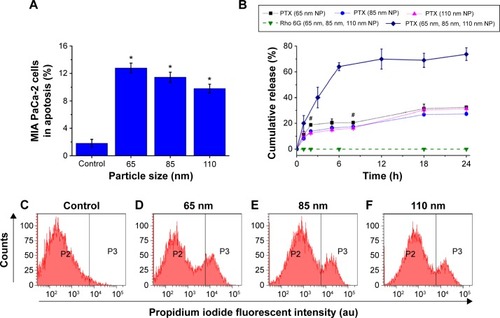
The MCTS of the MIA PaCa-2 cell line were treated with the nanoparticle formulations for 24 hours, and the percentage of cells in the apoptotic state was determined. The percentage of apoptotic cells was directly proportional to the therapeutic effect of the prepared nanoparticle formulations. Flow cytometry analysis revealed that the Paclitaxel-loaded nanoparticles had effective therapeutic effects on the MCTS of the MIA PaCa-2 cell line. As seen in , in the control group of MIA PaCa-2 cells treated with unloaded Paclitaxel nanoparticles, a lower percentage of apoptotic cells (1.66%) were observed. No significant differences in the percentage of cellular apoptosis was found in any of the control groups treated with 65 nm, 85 nm, and 110 nm unloaded nanoparticles, suggesting that the unloaded nanoparticles had relatively low cytotoxicity compared to loaded particles. Thus, the average 11.3% increase in the percentage of apoptotic cells resulted from the treatment with Paclitaxel-loaded nanoparticles. With regard to treatments with different nanoparticle sizes, the treated groups had 12.8% of apoptotic cells with 65 nm, 11.4% with 85 nm, and 9.79% with 110 nm nanoparticles compared with controls treated with nanoparticles without loaded Paclitaxel (). On average, a 2.18% increase in the percentage of apoptotic cells was observed for the MCTS of the MIA PaCa-2 cell line treated with the 65 nm nanoparticles compared to those treated with 85 nm and 110 nm nanoparticles. Analyzing the detailed flow cytometry results (), the higher percentage of apoptosis caused by the 65 nm nanoparticle formulation was due to the increased count of the cells from the 7×10³ to 8×10³ fluorescent intensity region compared to the 85 nm and 110 nm nanoparticles. These experiments showed the potential of such hybrid-polymeric nanoparticles for use in therapy and that the differences between the therapeutic effects of different sizes of nanoparticles were only slight.
Multifunctional nanoparticles for multimodal imaging of tumors in vivo
Our in vitro results showed that MIA PaCa-2 MCTS had a high preferential uptake of 110 nm nanoparticles. As a proof of concept, MIA PaCa-2 tumor-bearing nude mice were used to cross-check the trend observed in the in vitro models presented earlier. The 65 nm, 85 nm, or 110 nm nanoparticles loaded with Rhodamine 6G, Paclitaxel, and gadolinium chelates were injected subcutaneously into the tumor in vivo. Subsequently, fluorescence imaging and MRI were performed to evaluate the retention of the nanoparticles within the tumors. Fluorescence imaging () revealed that 65 nm and 85 nm nanoparticles were not detected in the tumor 1 hour after the injection, indicating the poor retention of these formulations by the tumors. In contrast, the 110 nm nanoparticles were retained in the tumor 1 hour after the injection and the fluorescence signals could still be detected after 48 hours of treatment. This florescence imaging result was consistent with the observations from the MIA PaCa-2 MCTS model. As reported by Cabral et al,Citation53 polymeric nanoparticle accumulation within tumors in vivo are highly dependent on nanoparticle size and on the tumors formed by different cancer cell lines due to their individual morphology and vasculature characteristics.
Figure 4 In vivo fluorescence and magnetic resonance imaging using the prepared multifunctional nanoparticles.
Notes: Fluorescence images taken for tumor-bearing mice treated with (A) 65 nm, 85 nm, and 110 nm nanoparticles after 1 hour, (B) 65 nm, 85 nm, and 110 nm nanoparticles after 3 hours, and (C) with 110 nm nanoparticles after 48 hours. (D) T1-weighted spin-echo images of extracted tumors. (E) T1-weighted fat saturation spin-echo images of extracted tumors. (F) T2-weighted turbo spin-echo images of extracted tumors. (G) T2-weighted fat saturation turbo spin-echo images of extracted tumors. Control samples comprised of 1 mg/mL nanoparticle solutions. Radiant efficiency was measured using arbitrary units. Scale bar represents 150 μm for (B) and 400 mm for (D–G).
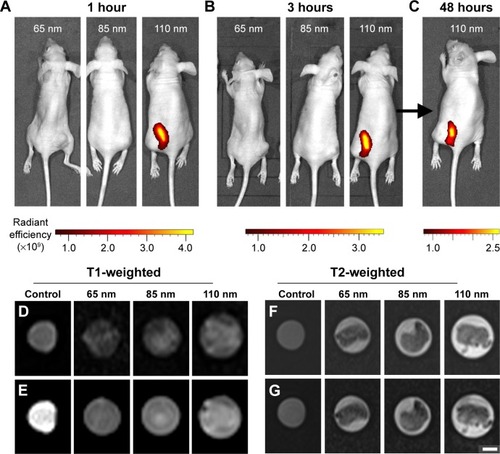
For the MRI experiments, the tumors from the mice were harvested for T1- and T2-weighted sequences analysis. The T2-weighted images in show the rough morphology of the tumor samples represented by the dark areas at the center of the imaging tube. In contrast, the MRI of control solutions in remained dark, which is an important observation because the nanoparticle solutions had some fat content due to phospholipid molecules. Since fatty tumors appear to be hypointense during T2 fat-saturated imaging,Citation54 and the signal was too weak to be detected by the T2 imaging, any changes in the T2 fat-saturated images must have been caused by the presence of fat in the tissues. Fat-saturated T2-weighted images () show no significant changes from the T2-weighted images (), indicating that the tumors consisted largely of dense and low-fat tissues. From the T1-weighted images in , the control solution sample comprising 1 mg/mL nanoparticles can be seen to exhibit a high contrast signal. Because the tumors lacked fatty tissues, as seen from the T2 fat-saturated images, the observed contrast from the tumors in the T1-weighted imaging resulted from the signal enhancement of the nanoparticles, indicating that the MRI contrast agent, gadolinium chelates, were successfully functionalized to the nanoparticles surface. In our MRI experiments, a minimal uptake of 65 nm and 85 nm nanoparticles in the tumors was observed. However, high contrast signals were obtained from tumors tissue harvested from mice treated with 110 nm nanoparticles, clearly suggesting that the 110 nm nanoparticles possessed a higher retention rate than that of the 65 nm and 85 nm nanoparticles and gave rise to the higher MRI contrast signals.
Our in vivo study showed consistency with the in vitro studies, demonstrating that the simultaneous imaging and therapeutic properties of multifunctional nanoparticles can be used to develop treatments for chronic diseases, such as cancer. Moreover, our studies also highlighted that hybrid-polymeric nanoparticles are an excellent platform for drug delivery and the multimodal imaging of tumors. These nanoparticles can be uniquely tailored for a wide range of applications from targeted drug therapy to monitoring the progression of the tumor in vivo. Using their loading properties, they can be loaded with other smaller nanoparticles, such as magnetic ferric oxide nanocrystals, to leverage on their functionalities to perform MRI simultaneously with magnetically induced heat generation and drug delivery.Citation55 Furthermore, the surface of the multifunctional nanoparticles presented here can be extensively modified for the potential treatment of other chronic illnesses, such as Alzheimer’s disease, where the micelle surfaces functionalized with Pluronic block copolymers have been shown to enhance drug uptake in primary cultured bovine brain microvessel endothelial cell monolayers.Citation56 We envision that these hybrid polymeric nanoparticles will be useful for clinical applications in the near future. As previously discussed, our designed nanoparticles were derived from US Food and Drug Administration approved materials and were able to degrade into biologically inert byproducts. Through the incorporation of different contrast agents (eg, fluorescence and magnetic resonance) into the nanoparticles designed here, multimodal imaging can be carried out in real time to evaluate the biodistribution of nanoparticles in the body and thereby understand the effectiveness of the drug’s efficacy in vivo.
Conclusion
In summary, hybrid-polymeric nanoparticles were fabricated for multimodal imaging and therapy of pancreatic cancer in vitro and in vivo. The synthesized nanoparticles comprised of a core made of PLGA, into which Rhodamine 6G fluorescent dye is loaded. This PLGA core is encapsulated by a phospholipid micelle, into which Paclitaxel, which is a potent anticancer drug for common cancer therapy use, was introduced. The micelle surface was functionalized with gadolinium chelates as an MRI contrast agent. Nanoparticle uptake and penetration studies showed that the two pancreatic cancer cell lines each had a preferential uptake of different sizes of nanoparticles. Specifically, the MIA PaCa-2 cell line showed the greatest preference for the uptake of 110 nm nanoparticles. Our therapeutic study showed that the developed nanoparticles could be used effectively to deliver therapeutic drugs and successfully cause the apoptosis of tumor cells. The tumors exhibited a high degree of retention with the 110 nm nanoparticle formulation, which was consistent with the in vitro study. Magnetic resonance imaging of the ex vivo tumor tissue confirmed the presence of nanoparticles in the tumor cells.
Acknowledgments
The presented study was supported by the the Nanyang Technological University–National Healthcare Group Collaboration Grant (M4061202.040), partially by the Singapore Ministry of Education under Tier 2 Research Grant MOE2010-T2-2-010 (M4020020.040 ARC2/11) and partially by the Shenzhen Basic Research Project Grant (JCYJ20140418182819164). We would also like to extend special thanks to Ms Evelyn Quah Shi Shi and Ms Shirleen Eng for providing their expertise in the Magnetic Resonance Imaging of the tumor samples.
Supplementary materials
Nanoparticle test solution size distributions
Generally, a standard deviation of below 5% is considered to be a monodispersed formulationCitation1 and standard deviations of 5%–10% are considered to be narrowly dispersed.Citation2 Although the nanoparticle solutions used in this study were not completely monodispersed, it is important to note that the goal of the study was not the characterization of the size-dependent uptake behavior of the MCTS of different cell lines. The aim was to show that using the size-dependent behavior of these MCTS, uptake, and penetration into tumors can be optimized. The size distributions of each nanoparticle solutions were specifically chosen as they had minimal overlap with each other in order to illustrate this concept ().
Positive controls: uptake and penetration studies
As a positive control, MCTS models of PANC-1 and MIA PaCa-2 cell lines were incubated with free Rhodamine 6G fluorescent dye at a concentration of 0.5 μg/mL, which was the same concentration as loaded in the multifunctional nanoparticles. Their relative intensities over a 24-hour period as well as the bright field, fluorescent and intensity mapping images are presented in . Uniform distribution of the nanoparticles was observed in the MCTS models of both cell lines after 24 hours of incubation ().
Paclitaxel and Rhodamine 6G Release at 4°C
To investigate the long-term stability of the nanoparticles under storage condition, the nanoparticles were dialyzed against PBS solution at 4°C in PBS solution. An initial, gradual release of 17.0% of Paclitaxel was observed in the first 3 days and, subsequently, no additional Paclitaxel was released on day 4 and 5. No Rhodamine 6G release was detected ().
Figure S1 Size distribution histograms of the nanoparticle test solutions used.
Notes: (A) Histogram for 65 nm sized nanoparticle solution. (B) Histogram for 85 nm sized nanoparticle solution. (C) Histogram for 110 nm sized nanoparticle solution. µ represents the mean and σ represents the standard deviation.
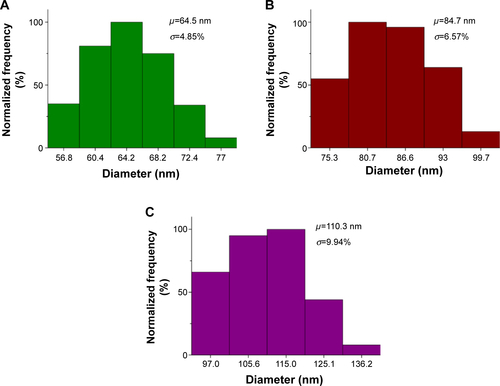
Figure S2 Positive control illustrating the uptake of free Rhodamine 6G (0.5 μg/mL) in the MCTS of the PANC-1 and MIA PaCa-2 cell lines.
Notes: (A) Normalized fluorescence intensity of the MCTS of the PANC-1 and MIA PaCa-2 cell lines at different time intervals. For MCTS models of PANC-1 cell line incubated with free Rhodamine 6G at 1 hour, 6 hours, and 24 hours, (B) bright field images, (C) fluorescence images, and (D) intensity maps showing the relative fluorescent intensity of different regions of the MCTS of PANC-1. For the MCTS of the MIA PaCa-2 cell line incubated with free Rhodamine 6G at 1 hour, 6 hours, and 24 hours, (E) bright field images, (F) fluorescence images, and (G) intensity maps showing the relative fluorescent intensity of different regions of the MCTS of MIA PaCa-2. The scale bar represents 100 μm. Error bars indicate the standard deviation and the number of samples used in each measurement (n=8). *Indicates statistical difference (P<0.05) between the fluorescent measurements at that time point of each cell line, based on the single variable analysis of variance test. No statistically significant difference was found between the fluorescent values of each cell line.
Abbreviations: MCTS, multicellular tumor spheroids; h, hours.
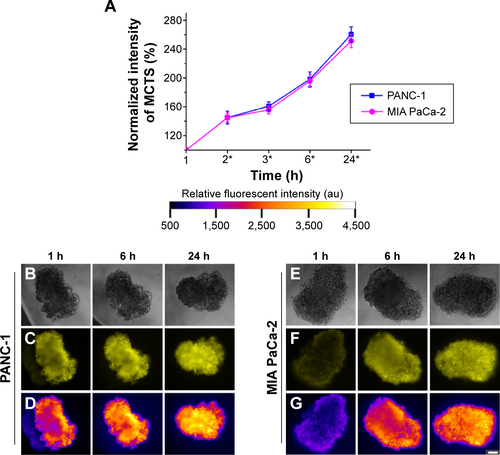
Figure S3 Paclitaxel (PTX) and Rhodamine 6G (Rho 6G) release at 4°C for all the three particle sizes (65 nm, 85 nm, and 110 nm) in PBS.
Abbreviation: PBS, phosphate buffered saline.
References
- SunSMurrayCWellerDFolksLMoserAMonodisperse FePt nanoparticles and ferromagnetic FePt nanocrystal superlatticesScience200028754601989199210720318
- ParkJJooJKwonSGJangYHyeonTSynthesis of monodisperse spherical nanocrystalsAngewandte Chemie Int Ed2007462546304660
Disclosure
The authors report no conflicts of interest in this work.
References
- WardJFPagliaroLCPistersLLSalvage therapy for radiorecurrent prostate cancerCurr Probl Cancer200832624227119064119
- JacobsIJMenonUProgress and challenges in screening for early detection of ovarian cancerMol Cell Proteomics20043435536614764655
- EtzioniRUrbanNRamseySThe case for early detectionNat Rev Cancer20033424325212671663
- ShannonAMBouchier-HayesDJCondronCMToomeyDTumour hypoxia, chemotherapeutic resistance and hypoxia-related therapiesCancer Treat Rev200329429730712927570
- FreedlandSJHumphreysEBMangoldLARisk of prostate cancer-specific mortality following biochemical recurrence after radical prostatectomyJAMA2005294443343916046649
- Brannon-PeppasLBlanchetteJONanoparticle and targeted systems for cancer therapyAdv Drug Deliv Rev201264suppl 0206212
- GottesmanMMFojoTBatesSEMultidrug resistance in cancer: role of ATP-dependent transportersNat Rev Cancer200221485811902585
- HoffmanJMGambhirSSMolecular imaging: the vision and opportunity for radiology in the future 1Radiology20072441394717507723
- PrasadPNIntroduction to BiophotonicsNew YorkJohn Wiley & Sons2004
- KimJPiaoYHyeonTMultifunctional nanostructured materials for multimodal imaging, and simultaneous imaging and therapyChem Soc Rev200938237239019169455
- FerrariMCancer nanotechnology: opportunities and challengesNat Rev Cancer20055316117115738981
- HuangKMaHLiuJSize-dependent localization and penetration of ultrasmall gold nanoparticles in cancer cells, multicellular spheroids, and tumors in vivoACS Nano2012654483449322540892
- PatilSSandbergAHeckertESelfWSealSProtein adsorption and cellular uptake of cerium oxide nanoparticles as a function of zeta potentialBiomaterials200728314600460717675227
- ChithraniBDGhazaniAAChanWCDetermining the size and shape dependence of gold nanoparticle uptake into mammalian cellsNano Lett20066466266816608261
- MalamYLoizidouMSeifalianAMLiposomes and nanoparticles: nanosized vehicles for drug delivery in cancerTrends Pharmacol Sci2009301159259919837467
- MoutRMoyanoDFRanaSRotelloVMSurface functionalization of nanoparticles for nanomedicineChem Soc Rev20124172539254422310807
- ChoKWangXNieSChenZShinDMTherapeutic nanoparticles for drug delivery in cancerClin Cancer Res20081451310131618316549
- FarokhzadOCJonSKhademhosseiniATranT-NTLaVanDALangerRNanoparticle-aptamer bioconjugates: a new approach for targeting prostate cancer cellsCancer Res200464217668767215520166
- FarokhzadOCChengJTeplyBATargeted nanoparticle-aptamer bioconjugates for cancer chemotherapy in vivoProc Natl Acad Sci U S A2006103166315632016606824
- HuS-LNiuK-YSunJYangJZhaoN-QDuX-WOne-step synthesis of fluorescent carbon nanoparticles by laser irradiationJ Mater Chem2009194484488
- RatzingerGAgrawalPKörnerWSurface modification of PLGA nanospheres with Gd-DTPA and Gd-DOTA for high-relaxivity MRI contrast agentsBiomaterials201031338716872320797782
- BishtSFeldmannGSoniSPolymeric nanoparticle-encapsulated curcumin (“nanocurcumin”): a novel strategy for human cancer therapyJ Nanobiotechnology20075311817295922
- KimJLeeJELeeSHDesigned fabrication of a multifunctional polymer nanomedical platform for simultaneous cancer – targeted imaging and magnetically guided drug deliveryAdv Mater Deerfield2008203478483
- YuMKJeongYYParkJDrug – loaded superparamagnetic iron oxide nanoparticles for combined cancer imaging and therapy in vivoAngew Chem Int Ed2008472953625365
- AlbaneseALamAKSykesEARocheleauJVChanWCTumour-on-a-chip provides an optical window into nanoparticle tissue transportNat Comm201342718
- GoodmanTTOlivePLPunSHIncreased nanoparticle penetration in collagenase-treated multicellular spheroidsInt J Nanomedicine20072226517722554
- JeongJHByunYParkTGSynthesis and characterization of poly(L-lysine)-g-poly(D,L-lactic-co-glycolic acid) biodegradable micellesJ Biomater Sci Polymer Ed2003141111
- GaumetMGurnyRDelieFFluorescent biodegradable PLGA particles with narrow size distributions: preparation by means of selective centrifugationInt J Pharm20073421–222223017574353
- CuiFShiKZhangLTaoAKawashimaYBiodegradable nanoparticles loaded with insulin-phospholipid complex for oral delivery: preparation, in vitro characterization and in vivo evaluationJ Control Release2006114224225016859800
- PanyamJLabhasetwarVBiodegradable nanoparticles for drug and gene delivery to cells and tissueAdv Drug Deliv Rev200355332934712628320
- AndersonJMShiveMSBiodegradation and biocompatibility of PLA and PLGA microspheresAdv Drug Deliv Rev201264suppl 07282
- BalaIHariharanSKumarMRPLGA nanoparticles in drug delivery: the state of the artCrit Rev Ther Drug Carrier Syst200421538742215719481
- ZalipskySPolyethylene glycol-lipid conjugatesStealth LiposomesLasicDDMartinFJBoca Raton, FLCRC Press199593102
- CheJOkekeCHuZXuJDSPE-PEG: a distinctive component in drug delivery systemCurr Pharm Des201521121598160525594410
- WangRXiaoRZengZXuLWangJApplication of poly(ethylene glycol)–distearoylphosphatidylethanolamine (PEG-DSPE) block copolymers and their derivatives as nanomaterials in drug deliveryInt J Nanomedicine201274185419822904628
- MakadiaHKSiegelSJPoly lactic-co-glycolic acid (PLGA) as biodegradable controlled drug delivery carrierPolymers2011331377139722577513
- MagutPKSDasSFernandVETunable cytotoxicity of rhodamine 6G via anion variationsJ Am Chem Soc201313542158731587924059469
- FearonKCHPlumbJABurnsHJGCalmanKCReduction of the growth rate of the walker 256 tumor in rats by Rhodamine 6G together with hypoglycemiaCancer Res19874714368436873594433
- AlexisFPridgenEMolnarLKFarokhzadOCFactors affecting the clearance and biodistribution of polymeric nanoparticlesMol Pharm20085450551518672949
- SkwarczynskiMHayashiYKisoYPaclitaxel prodrugs: toward smarter delivery of anticancer agentsJ Med Chem200649257253726917149855
- Kunz-SchughartLAKreutzMKnuechelRMulticellular spheroids: a three-dimensional in vitro culture system to study tumour biologyInt J Exp Pathol19987911239614346
- KellerGMIn vitro differentiation of embryonic stem cellsCurr Opin Cell Biol1995768628698608017
- KelmJMTimminsNEBrownCJFusseneggerMNielsenLKMethod for generation of homogeneous multicellular tumor spheroids applicable to a wide variety of cell typesBiotechnol Bioeng200383217318012768623
- FangRHAryalSHuC-MJZhangLQuick synthesis of lipid−polymer hybrid nanoparticles with low polydispersity using a single-step sonication methodLangmuir20102622169581696220961057
- IpSMacLaughlinCMGunariNWalkerGCPhospholipid membrane encapsulation of nanoparticles for surface-enhanced raman scatteringLangmuir201127117024703321528851
- FreitasCMüllerRHEffect of light and temperature on zeta potential and physical stability in solid lipid nanoparticle (SLN™) dispersionsInt J Pharm19981682221229
- XuPGullottiETongLIntracellular drug delivery by poly(lactic-co-glycolic acid) nanoparticles, revisitedMol Pharm20096119020119035785
- ZhangLChanJMGuFXSelf-assembled lipid−polymer hybrid nanoparticles: a robust drug delivery platformACS Nano2008281696170219206374
- PetersenSFahrABunjesHFlow cytometry as a new approach to investigate drug transfer between lipid particlesMol Pharm20107235036320063898
- AravindAJeyamohanPNairRAS1411 aptamer tagged PLGA-lecithin-PEG nanoparticles for tumor cell targeting and drug deliveryBiotechnol Bioeng2012109112920293122615073
- ZhangSLiJLykotrafitisGBaoGSureshSSize-dependent endocytosis of nanoparticlesAdv Mater Deerfield2009214419424
- TakeiKHauckeVSlepnevVGeneration of coated intermediates of clathrin-mediated endocytosis on protein-free liposomesCell19989411311419674434
- CabralHMatsumotoYMizunoKAccumulation of sub-100 nm polymeric micelles in poorly permeable tumours depends on sizeNat Nano2011612815823
- BasaranCKarcaaltincabaMAkataDFat-containing lesions of the liver: cross-sectional imaging findings with emphasis on MRIAm J Roentgenol200518441103111015788580
- YooDLeeJ-HShinT-HCheonJTheranostic magnetic nanoparticlesAcc Chem Res2011441086387421823593
- KabanovAVBatrakovaEVMillerDWPluronic® block copolymers as modulators of drug efflux transporter activity in the blood–brain barrierAdv Drug Deliv Rev200355115116412535579