
Abstract
In this study, we report a potential noninvasive technique for the detection of vulnerable plaques using scatter analyses with flow cytometry (FCM) method combined with the diffusion reflection (DR) method. The atherosclerotic plaques are commonly divided into two major categories: stable and vulnerable. The vulnerable plaques are rich with inflammatory cells, mostly macrophages (MΦ), which release enzymes that break down collagen in the cap. The detection method is based on uptake of gold nanorods (GNR) by MΦ. The GNR have unique optical properties that enable their detection using the FCM method, based on their scattering properties, and using the DR method, based on their unique absorption properties. This work demonstrates that after GNR labeling of MΦ, 1) the FCM scatter values increased up to 3.7-fold with arbitrary intensity values increasing from 1,110 to 4,100 and 2) the DR slope changed from an average slope of 0.196 (MΦ only) to an average slope of 0.827 (MΦ labeled with GNR) (P<0.001 for both cases). The combination of FCM and DR measurements provides a potential novel, highly sensitive, and noninvasive method for the identification of atherosclerotic vulnerable plaques, aimed to develop a potential tool for in vivo tracking.
Background
Despite recent therapeutic advances, atherosclerosis (AS) and its major vascular complications – myocardial infarction and ischemic cerebrovascular accident – remain a leading cause of premature morbidity and mortality.Citation1,Citation2 The disease may take root early in life, but it does not become clinically overt until AS plaques reach a critical stage. Particularly, due to increasing childhood obesity, the age risk is decreasing.Citation3 Present diagnosis is often done after symptoms become evident and are often cost-intensive and invasive rendering a risk to the patient. Therefore, the development of novel minimal or noninvasive and cost-effective detection techniques that enable the early, presymptomatic, detection of AS is essential.
Recently,Citation2 we dealt with invasive techniques like coronary angiography that have been widely employed to visualize the lumen of blood vessels and organs of the body. An injected iodinated contrast agent is visualized through X-ray fluoroscopic examination, but the density of the AS plaque cannot be quantified unequivocally by this method and therefore often leads to underestimation of plaque burden. Whereas, intravascular ultrasound, a catheter-based technique, provides real-time cross-sectional images of blood vessels at a high resolution,Citation4 enabling detection, localization, and estimation of plaque burden.Citation2 On the molecular level, a specific molecular or cellular target is required that is specifically expressed between stable and vulnerable plaques.Citation5 Many noninvasive techniques are commonly used for molecular detection purposes. This includes targeted molecular imaging using magnetic resonance imaging,Citation6 positron emission tomography for detection of inflammatory leukocytes in atherosclerotic plaque,Citation7 single-photon emission computed tomography,Citation8 and many other imaging methods.Citation9 These techniques show some shortcomings, eg, they are highly expensive and complicated to use and some of them also use ionizing radiation. In this paper, we suggest a novel, highly sensitive, simple, inexpensive, and noninvasive method, which at the end of the way will lead to plaque detection and distinction of plaque types. The suggested method is based on the presence of macrophages (MΦ) in the vulnerable plaques and the ability of these cells to take up gold nanoparticles (GNP).Citation10
In this paper, we suggest combining the diffusion reflection (DR) detection method with the in vitro detection of AS using light scatter analysis by flow cytometry (FCM) method. In our previous work, we suggested the noninvasive detection of injured carotid arteries with DR measurements of gold nanorods (GNR).Citation11 DR is one of the simplest and safest imaging techniques for studying the physiological condition of biological tissues. On the basis of this technique, a pair of source and detector fiber is placed along the tissue surface, separated by distance origins from few millimeters to few centimeters. Injected photons undergo multiple elastic scattering and absorption events, and subsequently, the unabsorbed photons are collected by a detector placed on the tissue’s surface, carrying quantitative information about the tissue structure. In order to achieve higher signal-to-noise ratios from DR measurements, we use GNR, which enhance the absorption and scattering properties of the irradiated tissue. The new DR–GNP method was already proved to be highly sensitive for cancerCitation12–Citation15 and AS detection.Citation11 In this work, we extend our previous findings and incubate MΦ with GNR to be analyzed with FCM. The results proved that the presence of GNR changed the cells’ scattering behavior, enabling the detection of the inflammatory cells in the blood cytoplasm. We also show the noninvasive detection of MΦ cells in tissue-like conditions, 24 hours post their incubation with GNR, using DR measurements of phantoms containing MΦ and GNR.
Methods
Fabrication of GNP
Two types of GNP were utilized in this study: GNR and gold nanospheres (GNS). The GNR were synthesized using the seed-mediated growth method.Citation16 The GNR present the strongest absorption and scattering properties in the red-near-infrared range (commonly used in DR measurements due to a better penetration of light into the tissueCitation17), rather than GNS or gold nanoshells.Citation18
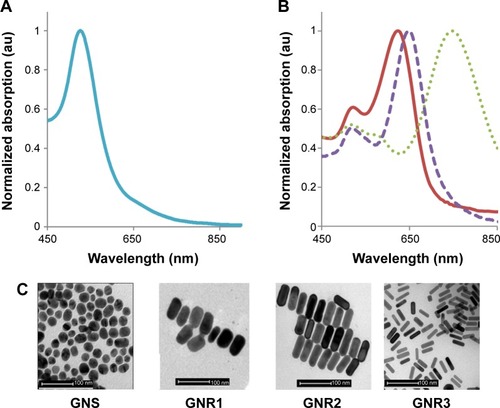
GNS were prepared using sodium citrate, according to Enüstun and Turkevich.Citation19 The GNP extinction coefficient spectra were determined using a spectrophotometer (Shimadzu Corporation, Tokyo, Japan), and the resultant extinction peaks are shown in . The GNS had an absorption peak at 520 nm (, left panel) and an average diameter of 18.5±3.7 nm (). Three types of GNR were synthesized as follows: with absorption peaks at 630 nm (GNR1), 650 nm (GNR2), and 760 nm (GNR3). GNR1 were used for FCM analyses, while GNR2 and GNR3 were used for the tissue-like experiments as well as for the hyperspectral microscopy measurements. The particles size, shape, and uniformity were characterized using transmission electron microscopy. The resultant average shapes of the GNR () were 40×18 nm (GNR1), 65×25 nm (GNR2), and 52×13 nm (GNR3), with a maximal size distribution of 10% (for GNR1). Aspect ratios (ARs) of the different types of GNR were 2.2, 2.6, and 4, respectively. Zeta potential of bare GNR was −32.2±0.9 mV and coated GNR was −49.1±0.8 mV. A significant difference that was obtained (by zeta potential and UV–vis spectroscopy) following coating demonstrates the efficiency of the chemical coating.
Figure 1 Absorption spectra (A and B) and TEM images (C) of different GNP.
Notes: (A) GNS absorption peak is at 520 nm (left) and GNR absorption peaks (B) are at 630 nm (GNR1, solid red line), 650 nm (GNR2, dashed violet line), and 760 nm (GNR3, dotted green line). The scattering spectra of the GNP are the same as the absorption spectra (data not shown, see Jain et alCitation18). (C) TEM images of GNS and GNR types 1–3. The average size was determined by measuring at least n=10 GNP.
Abbreviations: TEM, transmission electron microscopy; GNR, gold nanorods; GNP, gold nanoparticles; GNS, gold nanospheres.
Preparation of MΦ and GNP loading
The preparation of monocyte and MΦ was previously described.Citation2,Citation11 After MΦ differentiation, the cells were loaded with GNP. The MΦ were incubated with the GNS or GNR at 37°C (95% humidity) for 24 hours in Roswell Park Memorial Institute medium. Supernatant GNP were removed by washing with phosphate-buffered saline, and cells were detached from the surface with trypsin (Biological Industries Ltd., Kibbutz Beit-Haemek, Israel) and then solidified within the phantoms or used in suspension for FCM analyses.
FCM analyses of GNS and GNR loading
The GNP uptake by MΦ was analyzed by FCM scatter measurements (FACSAria III cell sorter; BD Biosciences, San Jose, CA, USA), measuring two different concentrations of GNS and GNR1: 0.02 mg/mL and 0.2 mg/mL. FCM data were analyzed with the FACSDiva software (version 4.0; BD Biosciences). Side scatter (SSC) and forward scatter (FSC) were determined simultaneously with the 488 nm blue laser. MΦ were identified by direct immunostaining with FITC-conjugated anti-human antibody directed against CD11b/Mac-1 (BioLegend Inc., San Diego, CA, USA). As isotype control, IgG-FITC (BioLegend Inc.) was used.
The laser setup of the FCM included filters/mirrors as follows: SSC/FSC measurements were performed using a 488 nm laser with 488/10 nm filter and 655 nm and 502 nm low-pass (LP) mirrors. The GNS measurements were performed using a 561 nm laser with 582/15 nm filter and with 735 nm, 685 nm, and 630 nm LP mirrors. The GNR1 were irradiated with a 633 nm laser with 660/20 nm filter and 735 nm LP mirror.
DR measurements
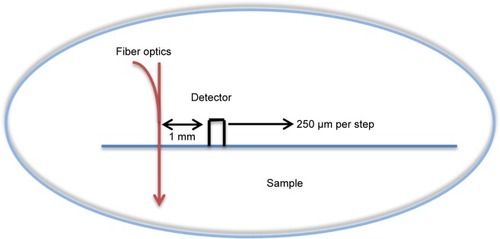
A noninvasive optical technique was designed and built (Negoh-Op Technologies Ltd., Yehud, Israel) for DR measurements, as detailed in Ankri et al.Citation20 The setup included a laser diode with wavelengths of 650 nm and 780 nm as an excitation source. Irradiation was carried out using a 125 µm diameter optical fiber (Linear Photonics LLC, Trenton, NJ, USA) to achieve a pencil beam illumination. We used a portable photodiode as a photo detector. The photodiode was kept in close contact with the tissue surface to prevent ambient light from entering the detection system and to avoid potential light loss through specimen edges. The distance between the light source and the photodiode is ρ, and the initial distance is ~1 mm. A consecutive reflected light intensity (Γ) measurement was enabled using a micrometer plate that was attached to the optical fiber. The micrometer plate was moved by incremental steps of 250 µm each. As a result, the reflected light intensity was collected from 20 source-detector distances with ρ varying from 1 mm to 5 mm (a graphical description of the system is presented in ). The reflected intensity Γ (ρ), presenting in units of volt per millimeter, was collected using a digital scope (Mso7034a; Agilent Technologies, Santa Clara, CA, USA), and data were processed using the LabView (National Instruments, Austin, TX, USA) program.
Figure 2 A schematic description of the experimental setup for linear reflected light intensity measurements.
Notes: The laser diode wavelengths were 650 nm and 780 nm and the sample is simultaneously irradiated (described as an arrow) on a single point on its surface. The photodiode was in close contact with the phantom’s surface. The micrometer plate moved 16 steps of 250 µm each, enabling continuous measurements of the spatial reflectance from 1 mm up to 5 mm from the laser diode position.
Tissue-like phantoms
Solid phantoms presenting specific absorption and scattering coefficients were used in order to simulate human tissues with different optical properties.Citation21 The phantoms were prepared using 0.1% India ink (Royal Talens, Apeldoorn, Holland), as an absorbing component, and intralipid (IL) 20% (Lipofundin MCT/LCT 20%; B Braun Melsungen AG, Melsungen, Germany), as a scattering component.Citation21 All phantoms had the same ink and IL concentrations. In all, 1% agarose powder (SeaKem LE Agarose; Lonza, Allendale, NJ, USA) was added in order to convert the solution into a gel. The solutions were heated and mixed at approximately 90°C while the agarose powder was slowly added. The phantoms were cooled in vacuum conditions to avoid bubbles. The phantoms’ solutions were stirred continuously (except for the period in which they were solidified in vacuum) in order to obtain high uniformity.
A solid phantom was prepared (within a 55 mm plate) containing ink and IL only, presenting a homogeneous phantom without MΦ or GNP. On the surface of this phantom, three smaller solid phantoms were deposited (). One small phantom served as a control measurement, containing MΦ only (2×10⁶ cells/mL). The other two small phantoms contained 2×10⁶ cells/mL of MΦ incubated with 0.2 mg/mL GNR2 or GNR3. The phantoms with the MΦ were prepared in 500 µL Eppendorf tubes, in order to keep a high concentration of MΦ within the phantom.
Figure 3 A schematic diagram of the measured phantoms.
Notes: (A) Three small phantoms containing macrophages (MΦ) without or with GNR2 or GNR3 were deposited on the surface of a baseline phantom, which contained IL and ink only. (B) As a second control, two additional phantoms, containing 0.2 mg/mL GNR2 or GNR3 only, were measured.
Abbreviations: GNR, gold nanorods; IL, intralipid.
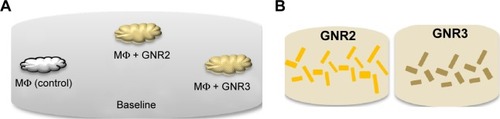
As additional control measurements, phantoms with GNR only (without MΦ, ) were also measured with our DR method. Two phantoms were prepared: one with 0.2 mg/mL of GNR2 and one with 0.2 mg/mL of GNR3. These phantoms served as control measurements to test whether the DR method enables the detection of the two kinds of GNR.
Hyperspectral microscopy
Brightfield images of MΦ with 0.02 mg/mL of GNS and without GNS were captured by hyperspectral imaging (Nuance; Cambridge Research & Instrumentation, Inc., Woburn, MA, USA). A xenon illumination (UN2-PSE100, Nikon Corporation, Tokyo, Japan), along with 40× objective (0.75 NA) and a 32-bit ultrasensitive CCD camera detector (N-MSI-EX), was used for imaging in RGB mode. Microscopy was then performed with a Nikon 80i Microscope (Nikon Instruments, Melville, NY, USA). Images were acquired using the Nuance software version 2.1 (Cambridge Research & Instrumentation, Inc.). The data analysis was done as described in Fixler et al.Citation22
Results
GNP uptake analyzed by FCM
FCM scatter analyses of MΦ incubated with GNR were performed in order to determine GNP uptake in vitro. Cells were excited with the 633 nm laser line to measure GNR1 uptake, according to their absorption and scattering spectra (). Results for changes in the scattering behavior of MΦ labeled with the GNR are shown in . Cells within the SSC/FSC scatter plot were positive for CD11b expression (data not shown).
Figure 4 FCM analysis of human blood macrophages without (control) and with GNP loading.
Notes: CD11b + MΦ loaded with two concentrations of GNR1 (top) and GNS (bottom): 0.02 mg/mL and 0.2 mg/mL. The Rel MSI (%) (right) at 633 nm (middle and right panels, upper) and 561 nm (middle and right panels, bottom) of unlabeled cells were compared to cells with GNR1 or GNS, respectively. Left panel: absorption spectra of GNR1 and GNS. The dotted lines indicate the absorption (and scattering) intensities of the GNP at different laser lines of the FCM. Reflection was measured at 488 nm, 561 nm, and 633 nm according to the scattering peaks of the GNS and GNR1, respectively. Loading of both GNP was detected, and the signal increased with the increasing GNP concentration.
Abbreviations: FCM, flow cytometry; GNP, gold nanoparticles; GNR, gold nanorods; GNS, gold nanospheres; Rel MSI, relative mean scatter intensity.
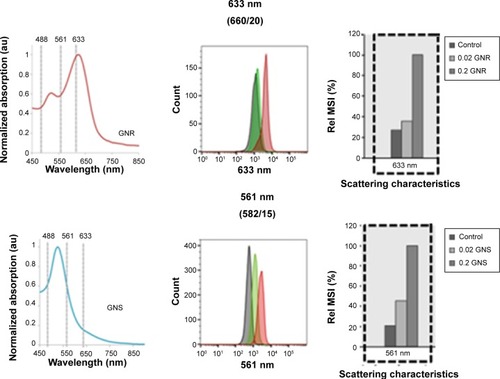
MΦ that were incubated with 0.02 mg/mL and 0.2 mg/mL of GNR1 caused a clear concentration-dependent increase in the 633 nm scattering characteristics: the 633 nm relative mean scatter intensity (Rel MSI, %) values were approximately 1,110 for control cells (MΦ without GNR) and increased 1.3- and 3.7-fold for addition of 0.02 mg/mL and 0.2 mg/mL of GNR1, respectively (, top). Similar results were obtained for MΦ incubated with GNS, measured with a 561 nm laser. The GNS uptake can be observed at 561 nm as the MSI from cells without GNS was approximately 550 intensity units, while the same intensities from cells incubated with 0.02 mg/mL and 0.2 mg/mL of GNS were 2.2- and 4.8-fold higher, respectively (, bottom). These results indicate a concentration dependency of the cells’ 561 nm scattering characteristics following GNS uptake.
DR measurements of MΦ within tissue-like phantoms
presents control measurements of phantoms without (baseline) and with 0.2 mg/mL of GNR2 and 0.2 mg/mL of GNR3 (without MΦ). The resulting average slopes show that the phantoms with GNR of both types present higher average slopes than the baseline phantoms: for 650 nm illumination, the baseline phantom presented an average slope of 0.196, while the GNR2 phantom presented an average slope of 0.827 (P<0.001). Similarly, for 650 nm illumination, the baseline phantom presented an average slope of 0.127, while the GNR2 phantom presented an average slope of 1.713 (P<0.001). Thus, the DR system enabled discrimination detection of both GNR types incubated with the MΦ.
Figure 5 Diffusion reflection measurements of tissue-like phantoms.
Notes: (A) Average DR slopes of phantoms with 0.2 mg/mL GNR2 and GNR3 compared to a baseline phantom. Each GNR phantom was illuminated with wavelengths, 650 nm and 780 nm, simultaneously, and the results show significant higher slopes for phantoms containing GNR (P<0.001 for both types of GNR). (B) Three types of phantoms were measured as follows: one control phantom with macrophages only and two phantoms with macrophages loaded with 0.2 mg/mL of GNR2 or GNR3. The figure presents averaged slopes resulting from the DR measurement curves of the abovementioned phantoms. Each type of phantom was measured with two wavelengths (650 nm and 780 nm; the bars show mean of at least five repeats ±1 STD), simultaneously. *P<0.05; ***P<0.001.
Abbreviations: DR, diffusion reflection; GNR, gold nanorods; STD, standard deviation.
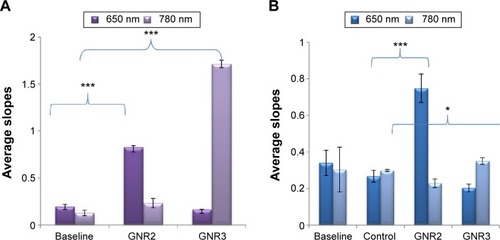
Three additional types of solid phantoms were measured at 650 nm and 780 nm illuminations according to the absorption peaks of the GNR (, GNR1 and GNR2). We measured phantoms with MΦ incubated with 0.2 mg/mL of GNR1 and GNR2 and a control phantom with MΦ only. The slope of each reflectance spectrum was extracted (the procedure for the slope extraction is detailed in Ankri et alCitation12), and the average slopes are presented in . Regarding illumination with 650 nm, it is evident that the phantoms containing MΦ incubated with GNR2 present higher slopes than the control phantoms (average slopes of 0.748 and 0.266 for the GNR2 and control phantoms, respectively, P<0.001). Yet, regarding illumination with 780 nm, the phantoms containing MΦ incubated with GNR3 did not present much higher DR slopes than the control phantoms (average slopes of 0.35 and 0.29 for the GNR3 and control phantoms, respectively, P<0.05). This result might indicate that the MΦ uptake of GNR3 is in a lower amount compared to their uptake of GNR2, suggesting that the GNP uptake by the MΦ was selective, with dependence on the GNR AR. Additional hyperspectral microscopy analyses were performed in order to test this assumption, as shown hereinafter.
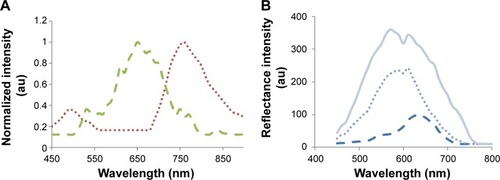
Hyperspectral microscopy of GNR uptake by MΦ
The hyperspectral microscopy served to further test GNR2 and GNR3 (0.2 mg/mL) uptake by the MΦ. First, the spectra of pure GNR2 and GNR3 were captured by transmission light microscopy, in order to confirm that their spectra can be well observed by the microscope (). The resulting spectra are very similar to the transmission spectra presented in , suggesting major peaks at 650 nm and 760 nm for GNR2 and GNR3, respectively. Then, after the MΦ were incubated with the GNR, the cell images were captured by hyperspectral imaging. presents the reflectance spectra of the cells before (solid line) and after incubation with GNR (dotted line GNR3, dashed line GNR2). The reflectance spectra from the MΦ that were not incubated with GNR and the MΦ loaded with GNR3 presented similar curve progressions, as both presenting peaks appear at 560 nm. The fact that no peak appears at 760 nm, as should be if the MΦ are loaded with GNR3, indicates that these GNR have not been taken up well by the MΦ. The lowered reflectance intensity (1.5-fold) of MΦ with GNR3, compared to the control, indicates a low loading efficiency of this GNR type, similar to the results achieved by the DR measurements. In contrast, the reflectance from the MΦ labeled with GNR2 is different, presenting two peaks, at 540 nm and 650 nm, very similar to the absorption spectrum of the GNR2 (). Moreover, the reflectance intensity of the MΦ that were incubated with the GNR2 is reduced 3.7-fold in comparison to the MΦ without GNR and 2.4-fold compared to the MΦ with GNR3. The lower reflectance intensity is due to the absorption properties of the GNR, which cause a reduction in the intensity of light that is transmitted through the cells. Overall, a preferred uptake of GNR2 over GNR3 (lower AR), similar to the results achieved by the DR measurements, is presented, suggesting that the GNR uptake depends on their AR.
Figure 6 Hyperspectral microscopy measurements.
Notes: (A) Transmission measurements of bare GNR2 (dashed green line) and GNR3 (dotted red line) on slide. (B) GNR uptake by macrophages captured by the hyperspectral microscopy. Reflectance intensity from macrophages before (solid line) and 24 h post their incubation with 0.2 mg/mL of GNR2 (dashed line) and GNR3 (dotted line). The spectra of the macrophages that were not incubated with the GNR and of the macrophages that were incubated with GNR3 are very similar, presenting an intensity peak at approximately 580 nm, indicating a low GNR3 uptake. In contrast, macrophages that were incubated with GNR2 present a spectrum very much similar to the absorption peak of the GNR2, as was measured by the spectrophotometer.
Abbreviations: GNR, gold nanorods; h, hours.
Discussion
The AS plaques are commonly divided into two categories: plaques with a high risk of rupture, the so-called vulnerable plaques, and plaques with a low risk of rupture, denoted as stable plaques.Citation8 Vulnerable plaques possess a thin fibrous cap over a large fatty core and inflammatory cells (eg, MΦ) within the plaque that release enzymes (such as collagenasesCitation23) at the same time, breaking down collagen in the cap. The result is a weak fibrous cap that is highly susceptible to rupture.Citation8,Citation24 Thus, a real need to develop a noninvasive molecular imaging tool for early differentiation of stable and vulnerable atherosclerotic plaques is evident.
Over the last few decades, noninvasive methods have been developed in order to detect atherosclerotic disease before it becomes symptomatic. These have included anatomical imaging techniques such as coronary calcium scoring by computed tomography,Citation25 carotid intimal media thickness measurement by ultrasound,Citation26 and magnetic resonance imaging.Citation27 Despite the rapid progression in imaging techniques, the identification of inflamed active lesions within the coronary circulation remains elusive due to small plaque size, cardiac and respiratory motion, and the lack of suitable markers specific for the unstable plaque. Furthermore, anatomic detection methods are generally more expensive, and the physiologic methods do not quantify the current state of the disease accurately enough to track its progression.Citation28 Despite the analysis of intermediate monocytes in the peripheral blood to predict the risk for cardiovascular diseases, so far no satisfactory noninvasive diagnostic technique for AS detection exists.Citation29
Atherosclerotic vulnerable plaques are more symptomatic than stable ones as they are more likely to rapture. Major efforts are being made in order to find an appropriate technique for the specific detection of the vulnerable plaques. One of the most common ways for this purpose is the biomolecular detection of MΦ, which are a major component in the vulnerable plaque, while in the stable plaque, they present lower levels.Citation30 In this paper, we suggest to use the presence of MΦ in the vulnerable plaques and the fact that they can take GNP up for the specific detection of those plaques.
We present experiments of tissue-like phantoms with MΦ to mimic in vivo detection of AS. In addition, in vitro detection of MΦ, following their 24 hours incubation with GNP, was performed using FCM measurements. The combination of DR with ex vivo FCM scatter intensity quantitation of nanoparticle uptake by MΦ is useful for the development and characterization of MΦ subset-specific GNP. This optimization and verification of different loading capacities is needed before reintroduction of labeled cells into the patient and serves additionally as a quality control of the DR measurements.
GNP have long been used in the detection and imaging of biological processes and diseases.Citation31 The broad range of applications for GNP is based on their unique chemical and physical properties and, in particular, on their optical properties from the visible to the infrared region, depending on the particle size, shape, and structure.Citation32 Moreover, GNP can be easily targeted toward abnormal tissues as they can be simply bioconjugated to specific receptors.Citation13 Thus, once the GNP accumulate in the tissue, the DR profile changes according to the optical properties of the GNP.
Our cell preparation method was aimed to purify circulating monocytes and differentiate them to MΦ in vitro. Cells were stained with antibody directed against CD11b/Mac-1, which is known to immunostain MΦCitation33 as well as granulocytes and natural killer cells. For a precise measurement of monocyte subpopulations, a combination of several markers might be necessary, as shown elsewhere.Citation34 Nevertheless, for the current approach, the CD11b staining showed to be sufficient, as also showed by others.Citation35 Once the presence of MΦ was proven, the cells were incubated with GNP for 24 hours and the GNP uptake was detected using FCM scatter analyses (). Clearly, the 561 nm and 633 nm scattering intensity from the cells was consistently higher following incubation with GNS and GNR, respectively. Moreover, the 561 nm or 633 nm scattering intensity depended on the GNS or GNR1 concentration, as the scattering shift of the cells that were incubated with 0.2 mg/mL was much higher than for cells with a lower concentration of 0.02 mg/mL of these GNP, respectively. This is of high importance since a detection method that gives an indication to the concentration of MΦ can indicate the AS severity. Additional experiments are required in order to achieve a clear dependence between the MΦ concentration, GNP uptake, and the scattering intensity measured by FCM. It is well known that GNP are taken up by MΦ and are already applied for FCM analysis. The FCM measurements were already successfully proved to detect different nanoparticlesCitation36 as well as nanoparticle uptake by cells.Citation37 Still, in this paper, we suggest to use the scatter properties of the GNP for FCM analyses, without any labeling or fluorescent staining, to study the uptake of the GNP into the MΦ cells.
Ideally, GNP loading of monocytes/MΦ in unseparated autologous whole blood samples or buffy coats and reintroduction into the patient is the least invasive and straightforward way of labeling. Testing if and how this labeling will work and how cell type-specific staining can be achieved will be the next steps of investigation. This approach will require the detailed analysis of uptake by the various subsets of monocytes presented in the peripheral blood and MΦ in the tissue.Citation38 Further research is needed to distinguish between cells from healthy tissues derived from embryonic MΦ precursors and inflammation and AS MΦ derived from recruited monocytes. presents DR results of phantoms containing MΦ 24 hours post their incubation with GNR of two ARs: 2.6 and 4 (for GNR2 and GNR3, respectively). The DR results suggest that the GNR uptake by the MΦ was selective; while the MΦ that were incubated with GNR2 showed a major increase in the average DR slope, compared with the average DR slopes of the control phantom, the DR average slope of the phantom containing MΦ that were incubated with GNR3 presented an almost identical value compared to the control phantoms. This result was confirmed using the hyperspectral microscopy, which ensured that GNR3 have been taken up less by MΦ compared to the MΦ uptake of the GNR2. The fact that GNP uptake by MΦ differs between GNS and GNR was already shown, eg, by Chithrani and ChanCitation39 and Arnida et al.Citation40 In addition, related work was done on HeLa cells, indicating that higher the GNR’s AR, the lower their uptake by the cells,Citation41 similar to our results. Yet, this is the first time that different kinds of GNR suggest a different uptake by MΦ. Further investigation is required in order to understand the dependence between the GNP’s shape and size and their uptake by different kinds of MΦ.
This work presents an innovative approach to detect atherosclerotic plaques by a combination of GNP labeling of MΦ, FCM scatter analyses quantification of uptake, the potential of reintroduction into the subject (presented by phantom measurements as a model), and DR analysis. We suggest that the DR measurements should be performed following FCM scatter-based optimization and quality control analyses of GNP uptake in peripheral blood mononuclear cells. Once the FCM scatter analyses indicate irregular scattering properties, due to the uptake of nanoparticles, the DR method can noninvasively detect the atherosclerotic area in the patient. More specific FCM analyses to identify different M subtypes following their incubation with different GNP should be performed. We expect different scattering shifts following different regions of plaques, thus enabling more specific and faster detection of AS. Additional questions that arise from this work are as follows: are these effects only particle concentration dependent or do they also depend on MΦ density? Can the shift in scatter be correlated to MΦ frequencies or plaque type? Does GNP uptake influence scatter behavior as well? Further investigations will be needed to answer these questions. Meanwhile, the first step toward a fast, highly sensitive, noninvasive, and inexpensive technique was established in this work. This paper paves the way toward a novel clinical method for the in vitro and, in the following, in vivo detection of AS.
Acknowledgments
The authors are thankful to the ESF (European Science Foundation) for its short visit support, grant #7076. Further, the authors thank the German Federal Ministry of Education and Research’s Translational Center for Regenerative Medicine TRM Leipzig (BMBF, PtJ-Bio, 315883) and MaDaKos (BMBF, 16N10872, 990101-088) for grant support.
Disclosure
The authors report no conflicts of interest in this work.
References
- RoifmanIBeckPLAndersonTJEisenbergMJGenestJChronic inflammatory diseases and cardiovascular risk: a systematic reviewCan J Cardiol201127217418221459266
- MelzerSAnkriRFixlerDTarnokANanoparticle uptake by macrophages in vulnerable plaques a tool for atherosclerosis diagnosisJ Biophotonics201510115
- BurgnerDPSabinMAMagnussenCGEarly childhood hospitalisation with infection and subclinical atherosclerosis in adulthood: the cardiovascular risk in Young Finns StudyAtherosclerosis2015239249650225721701
- LipinskiMJFriasJCAmirbekianVMacrophage-specific lipid-based nanoparticles improve cardiac magnetic resonance detection and characterization of human atherosclerosisJACC Cardiovasc Imaging20092563764719442953
- WeintraubHSIdentifying the vulnerable patient with rupture-prone plaqueAm J Cardiol200810112S3S10
- KanwarRKChaudharyRTsuzukiTKanwarJREmerging engineered magnetic nanoparticulate probes for targeted MRI of atherosclerotic plaque macrophagesNanomedicine20127573574922630154
- MajmudarMDYooJKeliherEJPolymeric nanoparticle PET/MR imaging allows macrophage detection in atherosclerotic plaquesCirc Res2013112575576123300273
- WinkelLCGroenHCvan ThielBSFolate receptor–targeted single-photon emission computed tomography/computed tomography to detect activated macrophages in atherosclerosis: can it distinguish vulnerable from stable atherosclerotic plaquesMol Imaging20131215
- KaragkiozakiVNanomedicine highlights in atherosclerosisJ Nanopart Res2013154117
- LarsonTAJoshiPPSokolovKPreventing protein adsorption and macrophage uptake of gold nanoparticles via a hydrophobic shieldACS Nano20126109182919023009596
- AnkriRLeshem-LevDFixlerDGold nanorods as absorption contrast agents for the noninvasive detection of arterial vascular disorders based on diffusion reflection measurementsNano Lett20141452681268724697682
- AnkriRDuadiHMotieiMFixlerDIn-vivo Tumor detection using diffusion reflection measurements of targeted gold nanorods–a quantitative studyJ Biophotonics20125326327322234916
- AnkriRPeretzVMotieiMPopovtzerRFixlerDA new method for cancer detection based on diffusion reflection measurements of targeted gold nanorodsInt J Nanomedicine2012744945522334777
- AnkriRMeiriALauSIMotieiMPopovtzerRFixlerDIntercoupling surface plasmon resonance and diffusion reflection measurements for real-time cancer detectionJ Biophotonics20136218819622461296
- FixlerDAnkriRSubcutaneous gold nanorods detection with diffusion reflection measurementJ Biomed Opt2013186061226061226
- NikoobakhtBEl-SayedMAPreparation and growth mechanism of gold nanorods (NRs) using seed-mediated growth methodChem Mater20031519571962
- Nguyen Do TrongNErkinbaevCTsutaMDe BaerdemaekerJNicolaïBSaeysWSpatially resolved diffuse reflectance in the visible and near-infrared wavelength range for non-destructive quality assessment of ‘Braeburn’ applesPostharvest Biol Technol2014913948
- JainPKLeeKSEl-SayedIHEl-SayedMACalculated absorption and scattering properties of gold nanoparticles of different size, shape, and composition: applications in biological imaging and biomedicineJ Phys Chem B2006110147238724816599493
- EnüstunBVTurkevichJCoagulation of colloidal goldJ Am Chem Soc1963852133173328
- AnkriRTaitelbaumHFixlerDReflected light intensity profile of two-layer tissues: phantom experimentsJ Biomed Opt20111683605694
- CubedduRPifferiATaroniPTorricelliAValentiniGA solid tissue phantom for photon migration studiesPhys Med Biol199742197119799364593
- FixlerDYitzhakiSAxelrodAZinmanTShainbergACorrelation of magnetic AC field on cardiac myocyte Ca2+ transients at different magnetic DC levelsBioelectromagnetics201233863464022532275
- MadsenDHLeonardDMasedunskasAM2-like macrophages are responsible for collagen degradation through a mannose receptor-mediated pathwayJ Cell Biol2013202695196624019537
- PelisekJWellGReepsCNeovascularization and angiogenic factors in advanced human carotid artery stenosisCirc J20117651274128222447000
- HalpernEJAssessment of cardiac risk: coronary calcium scoring & CT angiographyDepartment of Family & Community Medicine Lectures, Presentations, Workshops. Paper 282014 Available from: http://jdc.jefferson.edu/fmlectures/28Accessed July 3, 2015
- PolakJFPencinaMJPencinaKMO’DonnellCJWolfPAD’AgostinoRBSrCarotid-wall intima–media thickness and cardiovascular eventsN Engl J Med2011365321322121774709
- SchwitterJWackerCMWilkeNMR-IMPACT InvestigatorsMR-IMPACT II magnetic resonance imaging for myocardial perfusion assessment in coronary artery disease trial: perfusion-cardiac magnetic resonance vs single-photon emission computed tomography for the detection of coronary artery disease: a comparative multicentre, multivendor trialEur Heart J201234ehs022
- LerakisSSynetosAToutouzasKVavuranakisMTsiamisEStefanadisCImaging of the vulnerable plaque: noninvasive and invasive techniquesAm J Med Sci2008336434234818854678
- HristovMHeineGHMonocyte subsets in atherosclerosisHamostaseologie201435110511225396218
- TomeyMINarulaJKovacicJCAdvances in the understanding of plaque composition and treatment options: year in reviewJ Am Coll Cardiol201463161604161624583311
- FixlerDZalevskyZIn vivo tumor detection using polarization and wavelength reflection Characteristics of gold nanorodsNano Lett201313126292629624261467
- EustisSEl-SayedMAWhy gold nanoparticles are more precious than pretty gold: noble metal surface plasmon resonance and its enhancement of the radiative and nonradiative properties of nanocrystals of different shapesChem Soc Rev20063520921716505915
- MichéeSBrignole-BaudouinFRianchoLRosteneWBaudouinCLabbéAEffects of benzalkonium chloride on THP-1 differentiated macrophages in vitroPLoS One201388e7245923991114
- BocsiJMelzerSDähnertITárnokAOMIP-023: 10-Color, 13 antibody panel for in-depth phenotyping of human peripheral blood leukocytesCytometry A201485978178425132115
- MicheeSBrignole-BaudouinFRianchoLRosteneWBaudouinCLabbeAEffects of benzalkonium chloride on THP-1 differentiated macrophages in vitroPLoS One201388
- ZuckerRDanielKMassaroEKarafasSDegnLBoyesWDetection of silver nanoparticles in cells by flow cytometry using light scatter and far-red fluorescenceCytometry A2013831096297223943267
- ChoiSYYangNJeonSKYoonTHSemi-quantitative estimation of cellular SiO2 nanoparticles using flow cytometry combined with X-ray fluorescence measurementsCytometry A201485977178024980896
- HeimbeckIHoferTPEderCStandardized single-platform assay for human monocyte subpopulations: lower CD14+CD16++ monocytes in femalesCytometry A201077982383020662093
- ChithraniBDChanWCWElucidating the mechanism of cellular uptake and removal of protein-coated gold nanoparticles of different sizes and shapesNano Lett2007761542155017465586
- ArnidaJanát-AmsburyMMRayAPetersonCMGhandehariHGeometry and surface characteristics of gold nanoparticles influence their biodistribution and uptake by macrophagesEur J Pharm Biopharm201177341742321093587
- ChithraniBDGhazaniAAChanWCDetermining the size and shape dependence of gold nanoparticle uptake into mammalian cellsNano Lett20066466266816608261