
Abstract
Real-time imaging of small tumors is still one of the challenges in cancer diagnosis, prognosis, and monitoring of clinical outcome. Targeting novel biomarkers that are selectively expressed on a large variety of different tumors but not normal cells has the potential to improve the imaging capacity of existing methods such as computed tomography. Herein, we present a novel technique using cmHsp70.1 monoclonal antibody-conjugated spherical gold nanoparticles for quantification of the targeted uptake of gold nanoparticles into membrane Hsp70-positive tumor cells. Upon binding, cmHsp70.1-conjugated gold nanoparticles but not nanoparticles coupled to an isotype-matched IgG1 antibody or empty nanoparticles are rapidly taken up by highly malignant Hsp70 membrane-positive mouse tumor cells. After 24 hours, the cmHsp70.1-conjugated gold nanoparticles are found to be enriched in the perinuclear region. Specificity for membrane Hsp70 was shown by using an Hsp70 knockout tumor cell system. Toxic side effects of the cmHsp70.1-conjugated nanoparticles are not observed at a concentration of 1–10 µg/mL. Experiments are ongoing to evaluate whether cmHsp70.1 antibody-conjugated gold nanoparticles are suitable for the detection of membrane-Hsp70-positive tumors in vivo.
Introduction
Knowledge on the exact localization of malignant tumor cells in the body of a patient is a prerequisite for a successful treatment with radiotherapy. The use of positron emission tomography (PET) in combination with computed tomography (CT) is commonly used to image tumors in a size range of 0.5–1 cm3. 18F-Glucose is often used as a PET tracer. Major disadvantages of PET/CT imaging are the relatively low resolution,Citation1 false-positive and false-negative signals, and the fact that only metabolically active, but not resting cells can be visualized. However, with improved settings, spatial resolutions of 2 mm are technically feasible, as demonstrated in patients with prostate cancer.Citation2
CT imaging either alone or in combination with PET could be further improved by using metal-based nanoparticles.Citation3 For application in humans, it is essential that the material of the nanoparticles is nontoxic, transportable in the blood and lymph system, biodegradable, and has a short half-life. Small nanosized gold particles in low mM ranges fulfill most of these criteria, and therefore, are in clinical use.Citation4,Citation5 Due to the relatively high costs of gold, alternative materials, such as iodine, platinum, ytterbium, bismuth, and tantalum, are presently investigated in preclinical studies,Citation6 and iodine has been tested as a contrast agent in lung cancer patients.Citation7 For radiation therapy and for surgical removal of tumors in the brain, it is key to know the exact localization and size of a tumor. Tumor imaging with nanoparticles can be improved by coupling them to antibodies directed against tumor-specific biomarkers. For a good signal-to-background ratio and high tumor specificity, these markers should be selectively expressed on a large variety of tumor cells, but not on the surrounding healthy tissue. Membrane Hsp70 has been found to provide an ideal tumor biomarker that fulfills these criteria,Citation8,Citation9 and standard treatment regimens such as radiotherapy or chemotherapy can increase the membrane expression density of Hsp70 selectively on tumor cells.Citation10 Furthermore, a high Hsp70 membrane density could be detected on relapse tumors, metastases, and highly aggressive tumors.Citation8 Therefore, herein, we aim to target membrane-bound Hsp70 on tumor cells with gold nanoparticles that are coupled to cmHsp70.1-specific antibody.Citation9
Materials and methods
Coupling of nanoparticles
The mouse monoclonal membrane Hsp70-specific antibody cmHsp70.1Citation9 or an isotype-matched IgG1 control antibody (Sigma Aldrich, St Louis, MO, USA) was coupled to round-shaped gold nanoparticles (Nanopartz, Loveland, CO, USA). Briefly, the binding sites on polyethylene glycol (PEG)-amine-coated gold nanoparticles with a diameter of 30 nm (Nanopartz) were maleimide activated using commercially available succinimidyl-([N-maleimidopropionamido] ethyleneglycol) ester (NH2-(PEG)8-malmeimide, SM(PEG8)) (Pierce, Thermo Fischer Scientific, Waltham, MA, USA) containing PEG spacer of eight units. Following sulfhydryl activation of the antibodies’ N-termini by N-succinimidyl S-acetylthioacetate (SATA), both components were incubated together at neutral pH (pH 6.5–7.5), leading to covalently linked gold nanoparticle (Au-NP)–antibody conjugates. Vacant binding sites on the gold nanoparticles were saturated by bovine serum albumin (BSA) (Sigma Aldrich). Antibody-conjugated gold nanoparticles or only BSA-blocked negative control Au-NPs were used for experiments directly after coupling within 24 hours. After each preparation, gold nanoparticles were analyzed for their size to prove that no aggregation has occurred. For characterization of the nanoparticles and checking for aggregation, particles were analyzed for their size by dynamic light scattering (Zetasizer NanoS; Malvern Instruments, Malvern, UK).
Cell culture
The mouse colon carcinoma cell line CT26 (CT26.WT; American type culture collection (ATCC) #CRL-2638) and the mouse mammary carcinoma cell line 4T1 (ATCC #CRL-2539) were cultured in Roswell Park Memorial Institute 1640 medium containing 10% (v/v) heat-inactivated fetal calf serum, 2 mM L-glutamine, 1 mM sodium pyruvate, antibiotics (100 IU/mL penicillin and 100 µg/mL streptomycin) at 37°C in 95% humidity and 5% (v/v) CO2. Both cell lines are positive for membrane expressed Hsp70, as determined by flow cytometry.Citation9 Single-cell suspensions were derived by short-term (>1 minute) treatment with 0.25% (w/v) Trypsin-0.53 mM ethylenediaminetetraacetic acid (EDTA).
Tumor spheroids
Tumor spheroids were generated by seeding 2,000 tumor cells per well into an ultra-low round-bottomed 96-well attachment plate (No 7007; Corning Incorporated, Corning, NY, USA) and they were left to form spheroids for 3–4 days.
Hsp70 knockout – CRISPR/Cas9 knockout of the genes Hspa1a and Hspa1b
Knockout of closely homologous Hsp70 genes Hspa1a (ENS-MUSG00000091971) and Hspa1b (ENSMUSG00000090877) in 4T1 tumor cells was achieved by double nicking of closely adjacent sites with CRISPR/Cas9. The DNA damage leads to DNA repair of the NHEJ type and generates small insertions or deletions that often result in frame shifts within the coding sequence, and therefore, knockout of gene expression.Citation11 To target both genes, we selected two guide sequences using the CRISPR design toolCitation12 (guide-1 GATGCCGATCGCCGTGTTCT; guide-2 GCACGGCGATCGGCATCGACC) that target the 5′ region of the coding sequences of both genes and cloned those into the vector pX462. The 4T1 cells were transfected with a mixture of both vectors using 250 ng per well of Lipofectamine 2000 (Thermo Fisher Scientific, Waltham, MA, USA) in a 24-well plate and the transfected cells cultured in the presence of puromycin (2.5 mg/mL) for 2 days. Single-cells clones were generated by limiting dilution assays and tested for knockout of Hspa1a and Hspa1b expression by Western blot analysis.
SDS-PAGE and Western blot analysis
Cytosolic proteins were obtained as described previously.Citation13 Briefly, 2×10⁶ cells were lysed in 10 mM Tris-buffered saline (pH 7.5) containing 1% Nonidet P-40 (NP-40; Sigma Aldrich) in ice for 45 minutes. Nonsoluble material was pelleted by centrifugation at 10,000× g and discarded. Protein concentration was determined with the bicinchoninic acid method (BCA Protein Assay Kit; Pierce, Thermo Fisher Scientific). Equal protein amounts (20 µg) were electrophoresed on 10% sodium dodecyl sulfate-polyacrylamide gel electrophoresis (SDS-PAGE) according to a standard protocol.Citation14 A total of 25 ng of recombinant Hsp70Citation15 was loaded as a positive control. After SDS-PAGE, the proteins were transferred to nitrocellulose membranes (EMD Millipore, Billerica, MA, USA) following a standard protocol.Citation16 Nonspecific binding of the membranes was blocked with 5% skim milk in phosphate buffered saline (PBS) supplemented with 1% Tween-20. Blots were incubated with the Hsp70 primary antibody (cmHsp70.1; multimmune GmbH, Munich, Germany) and β-actin antibody (Abcam, Cambridge, UK) at 4°C for 14 hours. After washing away nonbound antibodies, membranes were incubated with a secondary antibody (goat anti-mouse IgG peroxidase conjugated; Promega Corporation, Fitchburg, WI, USA) at room temperature for 1 hour. All antibodies were diluted in 1% skim milk in PBS supplemented with 1% Tween-20. Immune complexes were detected using the enhanced chemiluminescent (ECL) detection system (Pierce; Thermo Fisher Scientific).
Microscopy
For microscopy, cells were grown in 8-well chamber slides (NUNC-Nalgene; Thermo Fisher Scientific) at a concentration of 10,000 per well. Upon adherence (~24 hours), cells were incubated with gold nanoparticles in concentrations from 0.1 µg/mL up to 10 µg/mL for up to 72 hours. The nontoxic concentration of 1 µg/mL turned out to be optimal for the uptake, and therefore, this concentration was used for all experiments. Slides were analyzed with a Zeiss Observer. Z1 (Carl Zeiss Meditec AG, Jena, Germany) equipped with long-distance objectives. Cells were imaged with Axiovision software (Carl Zeiss Meditec AG).
Image analysis and quantification
For further analysis, images were analyzed with ImageJ software.Citation17 Quantification was measured with the ImageJ plugin “Plot Profile,” and data sets were analyzed numerically with SigmaPlot statistical software package (Systat, San José, CA, USA). Analysis was performed on different cells and different images for accurate determination of intraexperimental errors.
Results
Covalent crosslinking of antibodies to gold nanoparticles
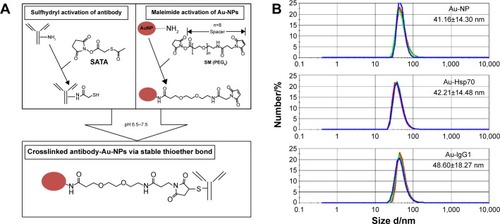
For the coupling of antibodies to gold nanoparticles, the N-terminus of either cmHsp70.1 or mouse IgG1 control antibody was sulfhydryl activated by using SATA (, left top panel). Predicted binding sites of gold nanoparticles (Au-NPs) were activated with maleimide and coupled to a PEG spacer to ensure steric flexibility of the antibodies (, right top panel). A covalent crosslink was achieved by coincubation of sulfhydryl-activated antibodies and maleimide-activated gold nanoparticles at pH 6.5–7.5 (, bottom panel). Size determination of the nonconjugated gold nanoparticles (Au-NPs) reveals a mean hydrodynamic diameter of 41.16±14.30 nm (, top). After conjugation, the determined size was 42.21±14.48 nm for cmHsp70.1 antibody (Au-Hsp70) (, middle) and 48.60±18.27 nm for IgG1 isotype-matched control antibody-conjugated gold nanoparticles (Au-IgG) (, bottom). No self-aggregation was observed with the conjugated and unconjugated gold nanoparticles in buffer solution at 20°C during 24 hours (); however, a strong self-aggregation was observed after 4 weeks ().
Figure 1 Antibody binding to gold nanoparticles and characterization.
Notes: (A) Gold nanoparticles are maleimide activated. Monoclonal antibodies are sulfhydryl activated at the N-terminus by SATA. Under buffered conditions and at neutral pH, a covalent binding of the antibodies with the gold nanoparticles takes place. (B) After coating with the Hsp70-specific antibody cmHsp70.1 (Au-Hsp70) or an irrelevant control antibody of the same isotype mouse IgG1 (Au-IgG) the size of the particles was measured by dynamic light scattering compared to uncoated particles (Au-NP). The hydrodynamic diameter is shown. Each time three measurements were performed. Mean values of a typical experiment are shown representing the hydrodynamic diameter. Data are presented as mean ± standard deviation.
Abbreviations: SATA, N-succinimidyl S-acetylthioacetate; Au-NPs, gold nanoparticles.
Specific uptake of cmHsp70.1-conjugated gold nanoparticles into CT26 tumor cells
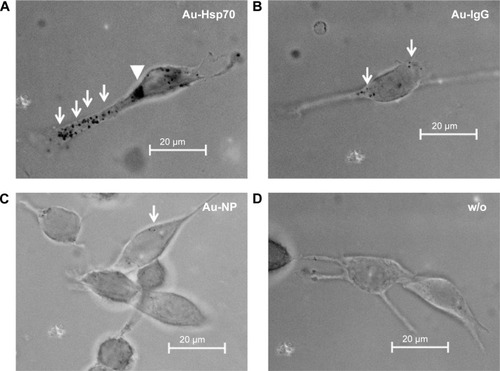
Hsp70 membrane-positive CT26 mouse tumor cells were incubated either with cmHsp70.1 (Au-Hsp70) or with isotype-matched control IgG1 antibody (Au-IgG)-conjugated or -unconjugated (Au-NP) gold nanoparticles. After incubation of the cells at 37°C for 24 hours, nonbound nanoparticles were removed by extensive washing and analyzed for uptake of the gold nanoparticles by brightfield microscopy. The strongest uptake was observed in CT26 cells that were incubated with cmHsp70.1-conjugated gold nanoparticles (Au-Hsp70) (). Clusters of these nanoparticles were observed in the cytosol (arrows) and in the perinuclear region (arrow head). In contrast, the uptake of nanoparticles conjugated with an isotope-matched control antibody IgG1 (Au-IgG) (, arrows) and unconjugated gold nanoparticles (Au-NP) (, arrow) was much less pronounced. A brightfield microscopic view of CT26 that had not been incubated with nanoparticles (w/o) is shown as a control ().
Figure 2 Vehicle specificity of antibody-coated gold nanoparticle uptake.
Notes: CT26 mouse colon carcinoma cells were incubated with antibody-coated or uncoated gold nanoparticles at a concentration of 1 µg/mL for 24 hours at 37°C. (A) cmHsp70.1-coated gold nanoparticles (Au-Hsp70) were internalized into cells and are visible in the cytoplasm (arrows) and in perinuclear areas (arrowhead). (B) Gold nanoparticles coated with an isotype matched irrelevant control antibody (Au-IgG) were internalized to a much lower extent (arrows), and (C) uncoated gold nanoparticles (Au-NP) were not internalized or internalized randomly with low frequency (as indicated with an arrow). (D) Black dots representing nanoparticles are not detectable in unstained cells (bright field, objective 63×, scale bar 20 µm).
Abbreviation: w/o, without.
Hsp70 target specificity of cmHsp70.1 antibody-conjugated gold nanoparticles
For verifying the Hsp70 specificity of the uptake of cmHsp70.1-conjugated nanoparticles, 4T1 wild type (4T1 wt) and 4T1 Hsp70 knockout (4T1 Hsp70−/−) cells that differ in their Hsp70 expressionCitation18 were used as target cells. 4T1 wt cells with a high Hsp70 membrane expression showed a strong uptake of cmHsp70.1-conjugated nanoparticles (Au-Hsp70) (). By a detailed inspection of 100 single monolayer cells, we could determine that 100% of the 4T1 wt cells showed an uptake of gold nanoparticles, which could be visualized by light microscopy (data not shown). In contrast, 4T1 Hsp70−/− cells that lack an Hsp70 expression exhibited no microscopic visible uptake of cmHsp70.1-conjugated nanoparticles (). If monolayer cells were inspected, we could determine that 100% of the tumor cells bearing Hsp70 on their membrane showed an uptake of Au-Hsp70 nanoparticles, which was visualized by microscopy (). As shown in and , we could demonstrate that a concentration of 1 µg/mL of the gold nanoparticles did not have any short-term (Annexin V staining after 24 hours) or long-term (colony formation after 48 hours and 72 hours) cytotoxic effects.
Figure 3 Target specificity of antibody-coated gold nanoparticle (Au-Hsp70) uptake.
Notes: 4T1 mouse mammary carcinoma cells were incubated with antibody-coated nanoparticles (1 µg/mL) for 24 hours at 37°C. (A) In 100% of the 4T1 cells with a wild-type expression of Hsp70, cmHsp70.1-coated nanoparticles could be detected as black dots (arrows). (B) In transfected cells, 4T1 Hsp70−/− cells with knocked down Hsp70, no uptake of nanoparticles could be detected. (C) The successful knock down of Hsp70 in 4T1 Hsp70−/− cells was verified by Western blotting compared with the expression of Hsp70 in the cytosol of 4T1 wt cells. Images are representative for at least three independent experiments. (A and B bright field, objective 40×, scale bar 20 µm.)
Abbreviation: wt, wild-type.
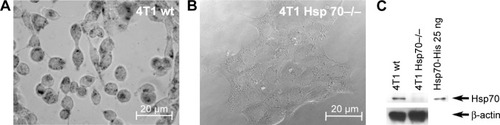
The absence of Hsp70 in 4T1 Hsp70−/− cells was verified by Western blot analysis. Cell lysates (20 µg) of 4T1 wt and Hsp70−/− cells were administered to SDS-PAGE, blotted onto nitrocellulose membranes, and stained with an antibody directed against Hsp70. In 4T1 wild type (; 4T1 wt), but not in 4T1 Hsp70 knockout (, 4T1 Hsp70−/−) cells, a strong 70kDa band is detectable. A β-actin staining was performed to demonstrate that equal protein amounts were administered to the SDS-PAGE; His-tagged, recombinant human Hsp70 protein (25 ng) was used as a molecular weight marker (, right).
Intracellular distribution of cmHsp70.1-conjugated gold nanoparticles
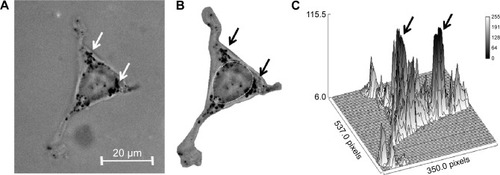
After demonstrating the Hsp70-target specificity, the intracellular distribution of the gold nanoparticles was analyzed in more detail. After a 24-hour incubation period of CT26 tumor cells with cmHsp70.1-conjugated gold nanoparticles (Au-Hsp70), clusters of nanoparticles, which are visible as black dots, are found in vesicles in the cytosol (, inset 1) and in the perinuclear region (, inset 2). The intracellular localization of the gold nanoparticles was demonstrated by scanning of CT26 tumor cells from the top to the bottom (). Higher magnifications of the nanoparticle clusters in cytosol and in the perinuclear region are shown in , respectively. The average diameter of the clusters in the perinuclear region was ~1 µm (, inset 2 and C). Time kinetics revealed that 2 hours and 4 hours after incubation of CT26 tumor cells with Au-Hsp70 nanoparticles, the clusters are predominantly found in the cytosol, but not in the perinuclear region (data not shown). A total of 48 hours after specific uptake of Au-Hsp70 gold nanoparticles into CT26 tumor cells, gold clusters are predominantly found in the perinuclear region (, arrows). For a further characterization of the distribution of the nanoparticles, single cells were defined as a region of interest, as exemplified in . This information was visualized in three-dimensional diagrams, where x- and y-axis represent the dimension of the cells in two-dimensional slices and the z-axis represents the gray values in the region of interest (, arrows). This semiquantitative analysis of at least 20 cells confirmed that the gold nanoparticles are accumulating in close proximity to the nucleus over time (24–48 hours). The image analysis allows the qualitative analysis on a single cell level.
Figure 4 Intracellular distribution of uptaken gold nanoparticles (Au-Hsp70) in CT26 cells.
Notes: Upon internalization after 24 hours (A) cmHsp70.1-coated gold nanoparticles are visible in vesicle-like structures in the cytoplasm (B) finally aggregating in lysosome-like structures near the nucleus (C). (B) and (C) are higher magnification images derived from insets [1] and [2] in (A). (scale bar 20 µm in [A] and 5 µm in [B] and [C]).
![Figure 4 Intracellular distribution of uptaken gold nanoparticles (Au-Hsp70) in CT26 cells.Notes: Upon internalization after 24 hours (A) cmHsp70.1-coated gold nanoparticles are visible in vesicle-like structures in the cytoplasm (B) finally aggregating in lysosome-like structures near the nucleus (C). (B) and (C) are higher magnification images derived from insets [1] and [2] in (A). (scale bar 20 µm in [A] and 5 µm in [B] and [C]).](/cms/asset/39d301e4-aac4-447e-9a76-db8502b927c9/dijn_a_87174_f0004_c.jpg)
Figure 5 Accumulation of antibody-coated gold nanoparticles (Au-Hsp70) in perinuclear areas of CT26 cells.
Notes: (A) A total of 48-hours postincubation gold nanoparticles are visible in aggregates in perinuclear areas (arrows). (B) Defining the areas of interest from (A). (C) Identification of black areas in bright field images by measuring the gray values in gray scale images. X- and Y-axis are defining the area of the cell. Z-axis defines the gray values. (A–C) Arrows correspond to each other.
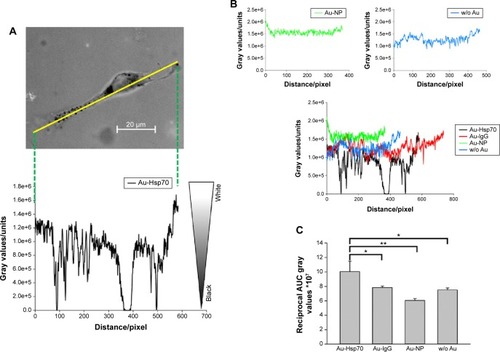
Comparison of the uptake of gold nanoparticles conjugated to cmHsp70.1 (Au-Hsp70), isotype-matched control (Au-IgG) antibody or unconjugated (Au-NP) nanoparticles in CT26 cells
For a comparative analysis, the amount of gold nanoparticle clusters inside CT26 cells was quantified 24 hours after incubation with nanoparticles conjugated either with cmHsp70.1 (Au-Hsp70), an isotype-matched control (Au-IgG) antibody, or with unconjugated (Au-NP) nanoparticles or cells that remained untreated (w/o Au). For that, a marker line was set along the longest axis of a cell (representative graph is shown in ). The gray values were counted by measuring the area under the curve (AUC) by plotting the profile of the set marker lines (). For quantification, values for black pixels were adjusted to the highest value. For this purpose, the values were converted to reciprocal values. CT26 cells incubated with cmHsp70.1 antibody-conjugated gold nanoparticles (Au-Hsp70) showed AUC values of 10×10−7±1.4×10⁻⁷, whereas cells incubated with isotype-matched mouse IgG1-conjugated nanoparticles (Au-IgG) showed AUC values of 7.8×10⁻⁷±2.0×10⁻⁸. Cells that were incubated with nanoparticles that were not conjugated to antibodies (Au-NP) or remained untreated (w/o Au) showed AUC values of 6.0×10⁻⁷±2.7×10⁻⁸ and 7.5×10⁻⁷±2.7×10⁻⁸, respectively (). Measurements were performed in at least ten different cells. The quantification revealed a significantly higher uptake of the cmHsp70.1 antibody-conjugated nanoparticles (Au-Hsp70) into Hsp70 membrane-positive CT26 cells compared to unconjugated nanoparticles (Au-NP) or nanoparticles conjugated with an isotype-matched (Au-IgG) irrelevant control antibody.
Figure 6 Quantification of gold nanoparticles uptake in single CT26 cells.
Notes: (A) After imaging cells with uptaken gold nanoparticles, a measurement line is set in 2-D images representing one slice of a cell. Measurement of the gray values along this line where low values (0) is defined as black, high values as white. A representative image with cmHsp70.1-coated nanoparticles is shown. (B) Analogously, lines were set in cells incubated with other particles. Shown are typical example curves of uncoated (blue), BSA coated (green) or isotype antibody coated (red) compared with the line of cmHsp70.1-coated particles (black). (C) Summing up the reciprocal gray values indicating a significant higher uptake of cmHsp70.1-coated Au particles in Hsp70-membrane-positive CT26 cells compared to uncoated- or isotype-coated particles (*P<0.05, **P<0.01).
Abbreviations: 2-D, two dimensional; BSA, bovine serum albumin; w/o, without.
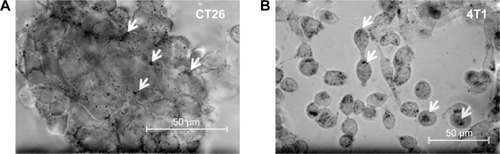
Uptake of cmHsp70.1-conjugated gold nanoparticles (Au-Hsp70) in tumor cell spheroids
To better mimic the in vivo situation in mice, spheroids of colon CT26 and mammary 4T1 tumor cells were incubated with Au-Hsp70 gold nanoparticles in chamber slides at a concentration of 1 µg/mL for 24 hours at 37°C. After extensive washing in PBS to remove nanoparticles that were not taken up into the cells, spheroids were analyzed on a microscope equipped with long-distance objectives (). Clustered gold nanoparticles (marked with arrows) that were taken up by tumor spheroids are visible as black dots inside CT26 colon carcinoma cells () and 4T1 mammary carcinoma cells (). The uptake of the Au-Hsp70 nanoparticles could be continuously increased in a concentration range up to 1 µg/mL.
Figure 7 Uptake of antibody-coated gold nanoparticles by clustered mouse carcinoma cells.
Notes: cmHsp70.1 antibody-coated gold nanoparticles (Au-Hsp70) can be visualized in mouse carcinoma cells lines after incubation at 37°C for 16 hours. The particles are visible as black agglomerates inside the cells (arrows). In clusters of CT26 cells (A) similar amounts of particles can be detected as in 4T1 single cells (B) (bright field, objective 40×, scale bar 50 µm).
Discussion
The discovery of substances and molecules for the detection, visualization, and therapy of tumors is one of the most important fields in clinical research. A common method not solely in oncology is CT in combination with PET. Very often PET/CT is combined with magnetic resonance tomography,Citation19 which then results in an improved detection of tumors and better treatment planning for radiation therapy.Citation20 Nevertheless, a number of parameters still exist that limit the quality of tumor visualization. First, the imaging methods are highly dependent on the velocity of the tumor cell metabolism that has to be much higher than that of the surrounding normal cells. Second, the visualization is dependent on the fluorescent signal, which in the case of tumors inside the human body could be very low and have a low resolution due to scattering and absorption effects.Citation21 Overcoming the limiting effects of PET/CT is one of the approaches of spectral CT.Citation5,Citation22 The enhanced imaging is mainly based on the k-edge, which allows identification of special molecules inside the body.Citation7 Based on the k-edge, which is specific for the used substance, the contrast can be increased. Multimodal imaging is possible when several k-edge substances are used.Citation5 Still the main problem of tumor imaging is the discovery of markers that are specific for tumor cells with an enhanced metabolism.Citation23,Citation24 One further limitation is the detection limit of small primary tumors or metastasis due to the low resolution inside the human body. Therefore, the discovery of novel tumor-specific markers is essential. The use of gold nanoparticles for CT imaging in vivo is a promising strategy, which is still in a developmental stage. First, studies are started that use gold nanoparticles and that are coupled to EGFR-targeting tools for the application in head and neck squamous cell carcinoma.Citation25 Herein, the major stress-inducible member of the HSP70 family Hsp70 (HspA1A) was used as a potential target for a tumor-specific uptake of gold nanoparticles in different tumor entities because a broad variety of different tumor entities show a tumor-specific Hsp70 membrane expression, whereas normal cells lack an Hsp70 membrane expression.Citation9 Furthermore, Hsp70 was found to serve as a soluble biomarker for many different highly aggressive tumors.Citation26,Citation27
Dynamic light scattering is widely used to determine the hydrodynamic diameter of objects in the nm–µm range.Citation28 By using this method, we could show successful coupling of the different antibodies to gold nanoparticles.
The uptake of ligand-coupled nanoparticles is dependent on different factors such as the absolute amount of receptors, which are expressed on the target cells, the distribution of the receptors throughout the cells,Citation29 affinity of the ligand on the nanoparticle to the receptor, speed of internalization, and speed of intracellular transport pathways inside the targeted cell.Citation9,Citation30 All these components can vary between different cells types and within individual cells as shown, for example, in glioma cells.Citation31 In the present study, we aim to analyze the role of membrane-bound Hsp70 on tumor cells as a target for the uptake of gold nanoparticles that are conjugated to cmHsp70.1 antibody. We could demonstrate that fluorescent-labeled cmHsp70.1 antibodyCitation9,Citation32 and tumor penetrating peptide (TPP), which both interact with membrane-Hsp70 on tumor cells, are rapidly taken up following binding.Citation18,Citation33
Since the 8-mer epitope (NNLLGRFE) of cmHsp70.1 antibody was identical in mouse and human tumor cells,Citation9 murine colon and mammary tumor cell lines were used in the present study.
A comparison of the uptake of gold nanoparticles that were conjugated to cmHsp70.1 antibody versus an irrelevant, isotype-matched control antibody or unconjugated nanoparticles revealed that uptake of cmHsp70.1-conjugated gold nanoparticles was superior to that of other nanoparticle types. At a concentration of 1 µg/mL, 100% of the tumor cells revealed an uptake of cmHsp70.1-conjugated nanoparticles. The Hsp70 specificity of the cmHsp70.1 antibody-conjugated nanoparticles was confirmed in a CRISPR/Cas9 Hsp70 knockout cell system. As previously shown, the genetic knockout of Hsp70 resulted in a complete loss of Hsp70 in the cytosol and on the cell surface of tumor cells,Citation33 and therefore, Hsp70 knockout tumor cells could neither bind nor internalize cmHsp70.1-conjugated gold nanoparticles.
A vesicular staining after incubation of A549 or MCF-7 breast cancer cells with cetuximab-conjugated gold nanoparticles could be detected after 2 hours.Citation28 We could show previously that fluorescent-labeled TPP specifically binds to Hsp70 on the surface of tumor cells in a similar manner, like cmHsp70.1 antibody.Citation18 Following rapid uptake within 15–20 minutes that reflects a high turn-over rate of membrane-bound Hsp70, TPP as well as the cmHsp70.1 antibody is found in intracellular vesicles that stain positively for the endosomal markers Rab4 and Rab5. Data from other groups show that the uptake of nanoparticles can occur via caveolin-Citation34 or clathrin-mediated endocytosis.Citation35 These data are in line with the vesicular distribution pattern of the gold nanoparticles after internalization.
At later time points, TPP is localized in LAMP1- and LAMP2-positive lysosomal vesicles that are frequently found in close proximity to the nucleus.Citation18,Citation33 In line with these findings, the cmHsp70.1-conjugated gold nanoparticles were also found to accumulate in the perinuclear region after 24–48 hours. These findings provide a first hint that the cmHsp70.1-conjugated gold nanoparticles in the perinuclear region might also reside in lysosomes. In line with these findings, clusters of nanorods in the perinuclear region were also found to be localized in lysosomes in human mammary carcinoma cell lines.Citation36
Finally, the quantification of gold nanoparticles that are taken up specifically by tumor cells or tumor cell clusters is important to estimate the amount of nanoparticles that is necessary to improve noninvasive in vivo imaging of tumors in mice and humans. In our setup, we could detect aggregates in perinuclear areas of around 1–2 µm in diameter. Assuming a 50% loading efficiency and a gold-specific volumetric mass density of 19.3 g/cm3, we roughly estimate an uptake of the gold nanoparticles in the pg range (data not shown). Other groups that used more sophisticated methods such as the laser ablation inductively coupled plasma-mass spectrometry report on an uptake of gold nanoparticles in the fg range.Citation37 In another approach, a relative but not absolute quantification of gold nanoparticles within cells was obtained by scanning transmission ion microscopy.Citation38
In order to estimate toxic side effects, gold nanoparticles were injected intravenously into the tail vein of mice. No negative side effects such as loss in body weight or organic dysfunctions were observed in these experiments up to a concentration of 500 µg/mL.Citation39 In our in vitro experimental settings, no toxicity was observed up to a concentration of 10 µg/mL.
On the basis of the specific and quantitative uptake of cmHsp70.1-conjugated gold nanoparticles in Hsp70-positive tumor cells and its imaging properties, the use in radiation therapy is also of importance. Numerous studies have already shown that gold nanoparticles delivered to tumor tissue can selectively enhance radiation therapy efficacy leading to differentially increased tumor cell killing and can be a promising strategy to increase the efficiency of radiotherapy in the future.Citation40,Citation41 The first study using gold nanoparticles was done in mice with subcutaneous EMT-6 mammary carcinoma. In this study, tumors treated with radiation and gold nanoparticles were compared to tumors treated with radiation alone.Citation42 The results showed an 86% 1-year survival for the combination with NPs compared to only 20% for X-rays alone. Probable mechanisms involved in radiosensitization are cell cycle changes and elevated reactive oxygen species production. Gold nanoparticles enhance the radiation damage by increasing locally the production of secondary electrons in and nearby tumor cells.Citation41 The mechanism is that high-Z gold atoms absorb more radiation and release photoelectrons and generate auger electrons.Citation43 These secondary electrons have only a very short range and deposit their energy in or next to cells containing gold NPs. Therefore, higher values of energy are deposited in the tumors that are loaded with NPs and more free radicals are produced, which could be the main reason for the radiosensitization of gold NPs in radiation treatment. Theoretical dose enhancement achieved by gold radiosensitization as predicted by Monte Carlo studies is significant (up to 200%).Citation44 Experiments are ongoing to use cmHsp70.1-conjugated nanoparticles as imaging as well as therapeutic tool for the treatment of Hsp70-positive cancer cells with radiotherapy.
Conclusion
Herein, we could show that a visualization of tumor cells with gold nanoparticles by addressing membrane Hsp70 is feasible. We present data showing a superior uptake of cmHsp70.1 antibody-conjugated gold nanoparticles into Hsp70 membrane-positive tumor cells. Inside the tumor cells, these particles accumulated in the perinuclear region within 24 hours. The Hsp70 specificity was shown since unconjugated nanoparticles and nanoparticles conjugated with an irrelevant control antibody were not taken up into Hsp70 membrane-positive tumor cells. Furthermore, Hsp70 knockout tumor cells that do not express Hsp70 in the cytosol and on the plasma membrane showed no uptake of the cmHsp70.1-conjugated nanoparticles. Quantification of the internalized cmHsp70.1-conjugated gold nanoparticles reveals a high sensitivity for the detection of single cells. Experiments are ongoing to evaluate whether cmHsp70.1 antibody-conjugated gold nanoparticles are suitable for the detection of Hsp70 membrane-positive tumor lesions in mice and whether these nanoparticles can be used for therapeutic approaches. In the future, these antibody-conjugated gold nanoparticles may be useful for real-time spectral computed tomography of tumors for diagnostic purposes and therapeutic interventions.
Author contributions
All authors contributed toward data analysis, drafting and critically revising the paper and agree to be accountable for all aspects of the work.
Acknowledgments
This work was supported by the Wilhelm Sander-Stiftung (2012.078.1), EU-CELLEUROPE (315963); BMBF (Strahlenkompetenz, 02NUK007E; 02NUK031B; Innovative Therapies, 01GU0823; NSCLC, 16GW0030; m4 – Leading Edge Cluster, 16EX1021C) and the DFG Cluster of Excellence: Munich Centre for Advanced Photonics. The research leading to these results has received funding from the Deutsche Forschungsgemeinschaft (DFG) under Grant Agreement No. SFB 824/2; INST 95/980-1 FUGG; INST 411/37-1 FUGG irradiation devices and the Helmholtz Zentrum München (HMGU), CCG – Innate Immunity in Tumor Biology. The BMBF (Federal Ministry of Education and Research, Germany) cutting edge cluster m4 (Individualized Medicine) (MAK, PBN, EJR) are acknowledged for funding (BMBF M4 PM8 801EX1021D).
Supplementary materials
Materials and methods
Aggregation
For coupling round shaped gold nanoparticles with a diameter of 30 nm were used (Nanopartz, Loveland, CO, USA). After washing away nonbound antibodies, vacant binding sites on the gold nanoparticles were saturated by bovine serum albumin (Sigma-Aldrich, St Louis, MO, USA). Antibody-conjugated gold nanoparticles or only bovine serum albumin-blocked negative control Au-NPs were used for experiments directly after coupling. For characterization of the nanoparticles and checking for aggregation, particles were analyzed for their size by dynamic light scattering (Zetasizer NanoS; Malvern Instruments, Malvern, UK). Only nanoparticles with a single peak around 40 nm were used for experiments.
Toxicity assays
Short- and long-term toxicity of gold nanoparticles was measured by Annexin-V staining and colony forming assays to determine apoptosis and clonogenic cell survival. Briefly, cells were seeded in 12-well plates and grown overnight. After adherence, cells were incubated with gold nanoparticles for 24 hours, 48 hours, or 72 hours. For measuring short-term toxicity Annexin V staining assays were performed 24 hours after incubation of the cells with gold nanoparticles. After 24 hours, cells were trypsinized, washed with Annexin binding buffer (140 mM sodium chloride, 10 mM 2-(4-(2-hydroxyethyl)-1-piperazinyl)-ethansulfonacid (HEPES) buffer, 2.5 mM CaCl), stained with Annexin-V–FLUOS (Hoffman-La Roche Ltd., Basel, Switzerland). Annexin V binding was measured on a FACS Calibur (BD Biosciences, San Jose, CA, USA). For measuring long-term toxicity, colony forming assays were performed. Cells were incubated with gold nanoparticles at a concentration of 1 µg/mL for 24 hours, 48 hours, or 72 hours. After removing the cell culture medium, cells were washed with phosphate buffered saline, fixed with methanol (−20°C) for 5 minutes, and stained with crystal violet. Following intensive washing with water, colonies were counted on a Bioreader 3000 (Biosys, Karben, Germany).
Figure S1 Aggregation assay.
Notes: The size and the aggregation of gold nanoparticles were measured by dynamic light scattering assays. Data from freshly prepared gold nanoparticles conjugated with cmHsp70.1 antibody are shown in red. Upon storage for 4 weeks at 4°C peaks are visible with a size above 100 nm (green). These data show an increased aggregation of the nanoparticles during storage. For all cell-based experiments only freshly prepared nanoparticles with a single peak in the hydrodynamic diameter of ~40 nm were used. The graph shows a representative measurement of cmHsp70.1-coated gold nanoparticles either freshly prepared (red) or after 4 weeks of storage at 4°C (green).
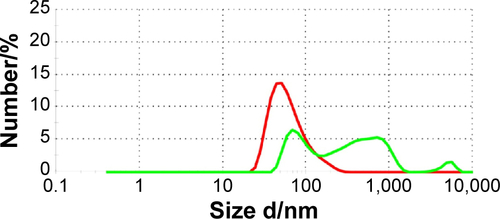
Figure S2 Annexin V assay.
Notes: Tumor cells were seeded in 12-well chamber slides and grown overnight. After an incubation of the cells with gold nanoparticles (concentration of 1 µg/mL) for 24 hours, cells were trypsinized and incubated with Annexin-V-FLUOS. Cells were analyzed on a FACS Calibur instrument. Annexin-V-positively stained cells were considered as apoptotic. As a positive control for apoptosis, cells were incubated with campthotecin (1 µg/mL, 24 hours) (CAM). No difference in cell viability was observed in cells incubated with the different gold nanoparticles either unconjugated (Au-NP) or conjugated (Au-IgG, Au-Hsp70), or cells that were not incubated with nanoparticles (w/o); (A) CT26, (B) 4T1 wt, (C) 4T1 Hsp70−/− (n=3). Although basal apoptosis was slightly higher in 4T1 wt and 4T1 Hsp70−/− cells compared to CT26 cells, the incubation with gold nanoparticles did not further increase apoptosis.
Abbreviations: w/o, without; FACS, fluorescent activated cell sorting.
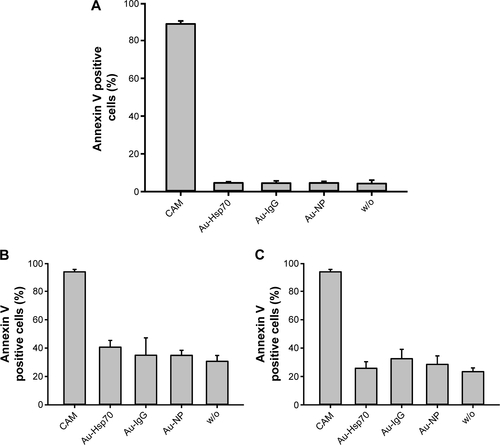
Figure S3 Cell viability assay.
Notes: Cells were seeded in 12-well chamber slides, incubated for 24 hours, 48 hours, or 72 hours with gold nanoparticles (Au-NP, Au-IgG, Au-Hsp70) or left untreated (w/o). Adherent cell colonies were counted 24 hours, 48 hours, and 72 hours after incubation with the gold nanoparticles and then stained with crystal violet. Colonies were counted automatically, and colony counts after 24 hours were set to 1. Shown are mean values of three independent experiments obtained with CT26 cells. For each plate, at least 30 colonies were counted in triplicates.
Abbreviation: w/o, without.
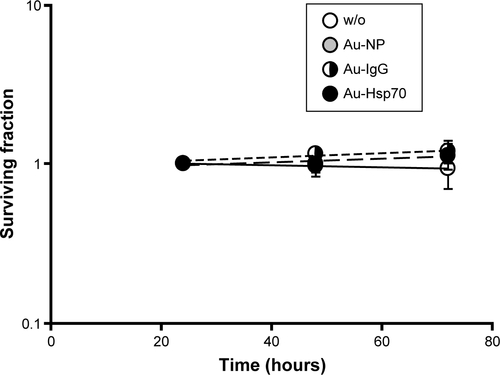
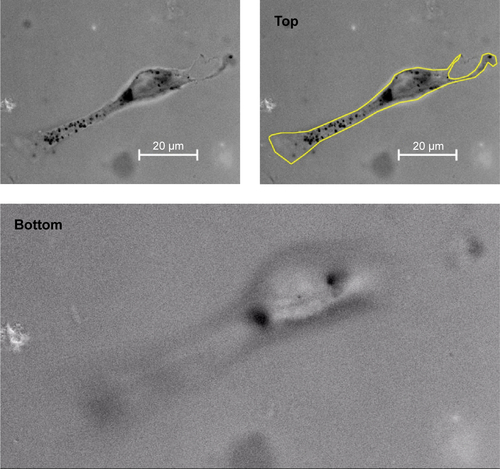
Figure S4 Representative view of a Z-stack light microscopic analysis of a CT26 tumor cell after incubation with Au-Hsp70 gold nanoparticles for 24 hours to demonstrate intracellular localization of the Au-Hsp70.
Notes: Magnification of 100×/1.3 oil using an EC plan-Neofluar objective, 15 ms; 22 slices were taken of the cells from the top to the bottom. The size of a single black dot was <500 nm, the size of the aggregates of black dots was ~2–3 µm. The scale bar indicates 20 µm. The yellow line depicts the outer plasma membrane of the cell at top position.
Abbreviation: ms, millisecond.
Disclosure
The authors declare no conflict of interest in this work.
References
- VanderstraetenBDuthoyWDe GersemWDe NeveWThierensH[18F]fluoro-deoxy-glucose positron emission tomography ([18F] FDG-PET) voxel intensity-based intensity-modulated radiation therapy (IMRT) for head and neck cancerRadiother Oncol200679324925816564588
- BalHGuerinLCaseyMEImproving PET spatial resolution and detectability for prostate cancer imagingPhys Med Biol201459154411442625049221
- CormodeDPNahaPCFayadZANanoparticle contrast agents for computed tomography: a focus on micellesContrast Media Mol Imaging201491375224470293
- ChenWHChenJXChengHA new anti-cancer strategy of damaging mitochondria by pro-apoptotic peptide functionalized gold nanoparticlesChem Commun2013495764036405
- CormodeDPRoesslEThranAAtherosclerotic plaque composition: analysis with multicolor CT and targeted gold nanoparticlesRadiology2010256377478220668118
- De La VegaJCHafeliUOUtilization of nanoparticles as X-ray contrast agents for diagnostic imaging applicationsContrast Media Mol Imaging2014102819525044541
- AshtonJRClarkDPModingEJDual-energy micro-CT functional imaging of primary lung cancer in mice using gold and iodine nanoparticle contrast agents: a validation studyPLoS One201492e8812924520351
- ShermanMMulthoffGHeat shock proteins in cancerAnn N Y Acad Sci2007111319220117978282
- StanglSGehrmannMRieggerJTargeting membrane heat-shock protein 70 (Hsp70) on tumors by cmHsp70.1 antibodyProc Natl Acad Sci U S A2011108273373821187371
- GehrmannMRadonsJMollsMMulthoffGThe therapeutic implications of clinically applied modifiers of heat shock protein 70 (Hsp70) expression by tumor cellsCell Stress Chaperones200813111018347936
- RanFAHsuPDLinCYDouble nicking by RNA-guided CRISPR Cas9 for enhanced genome editing specificityCell201315461380138923992846
- HsuPDScottDAWeinsteinJADNA targeting specificity of RNA-guided Cas9 nucleasesNat Biotechnol201331982783223873081
- BotzlerCEllwartJGuntherWEissnerGMulthoffGSynergistic effects of heat and ET-18-OCH3 on membrane expression of hsp70 and lysis of leukemic K562 cellsExp Hematol199927347047810089909
- LaemmliUKCleavage of structural proteins during the assembly of the head of bacteriophage T4Nature19702272596806855432063
- SchillingDGehrmannMSteinemCBinding of heat shock protein 70 to extracellular phosphatidylserine promotes killing of normoxic and hypoxic tumor cellsFASEB J20092382467247719289606
- TowbinHStaehelinTGordonJElectrophoretic transfer of proteins from polyacrylamide gels to nitrocellulose sheets: procedure and some applicationsProc Natl Acad Sci U S A197976943504354388439
- SchneiderCARasbandWSEliceiriKWNIH Image to ImageJ: 25 years of image analysisNat Methods20129767167522930834
- GehrmannMStanglSFouldsGATumor imaging and targeting potential of an Hsp70-derived 14-mer peptidePLoS One201498e10534425165986
- GarofalakisADuboisAThezeBCzarnyBTavitianBDucongeFFusion of [(18)F]FDG PET with fluorescence diffuse optical tomography to improve validation of probes and tumor imagingMol Imaging Biol201315331632522927057
- ApisarnthanaraxSChaoKSCurrent imaging paradigms in radiation oncologyRadiat Res2005163112515606303
- GaertnerFCFurstSSchwaigerMPET/MR: a paradigm shiftCancer Imaging201313365223446110
- SchlomkaJPRoesslEDorscheidRExperimental feasibility of multi-energy photon-counting K-edge imaging in pre-clinical computed tomographyPhys Med Biol200853154031404718612175
- AlmuftiRWilbauxMOzaAA critical review of the analytical approaches for circulating tumor biomarker kinetics during treatmentAnn Oncol2014251415624356619
- ElfSEChenJTargeting glucose metabolism in patients with cancerCancer2014120677478024374503
- ReuveniTMotieiMRommanZPopovtzerAPopovtzerRTargeted gold nanoparticles enable molecular CT imaging of cancer: an in vivo studyInt J Nanomedicine201162859286422131831
- BayerCLiebhardtMESchmidTEValidation of heat shock protein 70 as a tumor-specific biomarker for monitoring the outcome of radiation therapy in tumor mouse modelsInt J Radiat Oncol Biol Phys201488369470024521683
- GehrmannMSpechtHMBayerCHsp70 – a biomarker for tumor detection and monitoring of outcome of radiation therapy in patients with squamous cell carcinoma of the head and neckRadiat Oncol2014913124912482
- KaoHWLinYYChenCCBiological characterization of cetuximab-conjugated gold nanoparticles in a tumor animal modelNanotechnology2014252929510224990295
- SchubertovaVMartinez-VeracoecheaFJVachaRInfluence of ligand distribution on uptake efficiencySoft Matter201511142726273025683904
- LammersTKiesslingFHenninkWEStormGDrug targeting to tumors: principles, pitfalls and (pre-) clinical progressJ Control Release2012161217518721945285
- GaoHYangZZhangSLigand modified nanoparticles increases cell uptake, alters endocytosis and elevates glioma distribution and internalizationSci Rep20133253423982586
- StanglSGehrmannMDresselRIn vivo imaging of CT26 mouse tumours by using cmHsp70.1 monoclonal antibodyJ Cell Mol Med201115487488720406322
- StanglSVargaJFreysoldtBSelective in vivo imaging of syngeneic, spontaneous, and xenograft tumors using a novel tumor cell-specific hsp70 Peptide-based probeCancer Res201474236903691225300920
- Rothen-RutishauserBKuhnDAAliZQuantification of gold nanoparticle cell uptake under controlled biological conditions and adequate resolutionNanomedicine20149560762123738633
- NgCTTangFMLiJJOngCYungLLBayBHClathrin-Mediated Endocytosis of Gold Nanoparticles In VitroAnat Rec20142982418427
- ZhangWJiYWuXXuHTrafficking of gold nanorods in breast cancer cells: uptake, lysosome maturation, and eliminationACS Appl Mater Interfaces20135199856986524033123
- WangMZhengLNWangBQuantitative analysis of gold nanoparticles in single cells by laser ablation inductively coupled plasma-mass spectrometryAnal Chem20148620102521025625225851
- ChenXChenCBUdalagamaCNHigh-resolution 3D imaging and quantification of gold nanoparticles in a whole cell using scanning transmission ion microscopyBiophys J201310471419142523561518
- ZhangXDWuHYWuDToxicologic effects of gold nanoparticles in vivo by different administration routesInt J Nanomedicine2010577178121042423
- DorseyJFSunLJohDYGold nanoparticles in radiation research: potential applications for imaging and radiosensitizationTransl Cancer Res20132428029125429358
- MuddinetiOSGhoshBBiswasSCurrent trends in using polymer coated gold nanoparticles for cancer therapyInt J Pharm20154841–225226725701627
- HainfeldJFDilmanianFAZhongZSlatkinDNKalef-EzraJASmilowitzHMGold nanoparticles enhance the radiation therapy of a murine squamous cell carcinomaPhys Med Biol201055113045305920463371
- MesbahiAA review on gold nanoparticles radiosensitization effect in radiation therapy of cancerRep Pract Oncol Radiother201015617618024376946
- ChoSHEstimation of tumour dose enhancement due to gold nanoparticles during typical radiation treatments: a preliminary Monte Carlo studyPhys Med Biol20055015N163N17316030374