Abstract
Poly(lactic-co-glycolic) acid (PLGA) has been widely used as a biomaterial in regenerative medicine because of its biocompatibility and biodegradability properties. Previous studies have shown that cells (such as bladder smooth muscle cells, chondrocytes, and osteoblasts) respond differently to nanostructured PLGA surfaces compared with nanosmooth surfaces. The purpose of the present in vitro research was to prepare PLGA films with various nanometer surface features and determine whether lung cancer epithelial cells respond differently to such topographies. To create nanosurface features on PLGA, different sized (190 nm, 300 nm, 400 nm, and 530 nm diameter) polystyrene beads were used to cast polydimethylsiloxane (PDMS) molds which were used as templates to create nanofeatured PLGA films. Atomic force microscopy (AFM) images and root mean square roughness (RMS) values indicated that the intended spherical surface nanotopographies on PLGA with RMS values of 2.23, 5.03, 5.42, and 36.90 nm were formed by employing 190, 300, 400, and 530 nm beads. A solution evaporation method was also utilized to modify PLGA surface features by using 8 wt% (to obtain an AFM RMS value of 0.62 nm) and 4 wt% (to obtain an AFM RMS value of 2.23 nm) PLGA in chloroform solutions. Most importantly, lung cancer epithelial cells adhered less on the PLGA surfaces with RMS values of 0.62, 2.23, and 5.42 nm after four hours of culture compared with any other PLGA surface created here. After three days, PLGA surfaces with an RMS value of 0.62 nm had much lower cell density than any other sample. In this manner, PLGA with specific nanometer surface features may inhibit lung cancer cell density which may provide an important biomaterial for the treatment of lung cancer (from drug delivery to regenerative medicine).
Introduction
The interaction between cells and extracellular matrix (ECM) proteins is complicated, drawing much attention for biomaterial interfacial research because understanding this interaction will significantly contribute to the design of better implants. Different implant material properties, including surface chemistry, surface texture, and surface energy, have been investigated to date to create better implantable materials. Specifically, recent research has demonstrated that implant nanometer surface features promote cell (such as bladder smooth muscle cells, chondrocytes, osteoblasts, vascular smooth muscle cells, stem cells, and neurons) attachment, proliferation, and differentiation.Citation1 However, the underlying mechanism of cell responses to micro- and nanometer patterns is still poorly understood, although it is likely that local force and geometric sensing regulate cell functions on micro- and nanometer-featured patterns.Citation2
Various micro- and nanostructured patterns on substrate surfaces have been created by chemical and physical methods to investigate cellular responses. Such geometries include posts,Citation3–Citation6 islands,Citation7,Citation8 grooves,Citation9,Citation10 and pits.Citation11,Citation12 Specifically, Arnold et al created nanometer Au nanodot arrays of various distances (such as 28, 58, 73, and 85 nm) and found that a separation of 73 nm or more inhibits MC3T3-osteoblast spreading, affording a good cue to create nanostructured patterns to decrease osteoblast functions.Citation13 Sharp nanotip surface topographies with needle- or blade-like tips of less than 10 nm have also been shown to inhibit human foreskin fibroblast functions.Citation14 Micropost patterns with diameters of 1000 nm also influenced 3T3 and SaI/N fibroblastic cell migration speed and orientation.Citation15 Microgrooves or ridges with anisotropic surface features also directed cell polarization and alignment.Citation6,Citation15
However, most of these research examples have been limited to microscale surface features due, in part, to the lack of efficient preparation methods for nanoscale patterns. More simple, consistent, and efficient methods for creating nanoscale surface morphologies are needed to create uniform and well-controlled nanostructured surfaces for the study of cellular functions. Along this line, some chemical methods (such as polymer demixingCitation16 and copolymer self-assemblyCitation17) have been developed to create nanoscale surfaces. However, these methods are only available for selected materials and therefore do not provide general processes useful for a wide range of chemistries. In this study, a simple technique was used to create uniform nanospherical 3D surfaces on polymers which could be replicated by many other polymeric biomaterials.
Moreover, while studies have emerged to investigate cell functions on nanostructured surfaces for tissue engineering applications,Citation18 little attention has been paid to determine cancer cell responses to nanopatterned surfaces. For example, nanopillars and nanolines have been shown to strongly modify the dynamics of cancerous (SaI/N) fibroblastic cell spreading,Citation19 suggesting that nanofeatured surfaces may regulate cancer cell function. In this study, uniform nanospherical surfaces were created on poly(lactic-co-glycolic) acid (PLGA) by using a polystyrene (PS) bead self-assembled process with different diameters to evaluate lung carcinoma epithelial cell responses on such surfaces. Lung cancer cells were chosen because lung cancer is responsible for about 1.3 million deaths worldwide annually, making it a current leading cause of cancer death.Citation20 As a start towards understanding cancer cell responses on nanostructured PLGA, lung epithelial cancerous cell attachment and short-term cell density assays were determined here.
Materials and methods
Fabrication of nanometer surface PLGA films
PLGA films with nanometer spherical surface features were created using a method previously described by Carpenter et al.Citation21 Briefly, 18 mm diameter borosilicate glass coverslips (Fisher Scientific, Agawam, MA) were cleaned and degreased by soaking in acetone for 10 minutes, sonicating in acetone for 10 minutes, washing several times with dH2O (distilled water), soaking in 70% ethanol for 10 minutes, sonicating in 70% ethanol for 10 minutes, and washing several times with dH2O; 300 μL of a 10 wt% suspension of PS beads in water either 190 nm, 300 nm, 400 nm, or 530 nm in diameter (Bangs Labs, Fishers, IN) were then dispersed onto the coverslips and allowed to evaporate in ambient air.
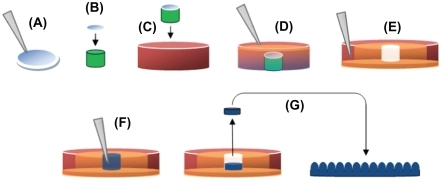
PS monolayers were secured onto a 1 cm high × 18 mm diameter glass rod using a commercially available glass adhesive (Superglue; The Original, Rancho Cucamonga, CA), which was in turn fixed to the bottom of a borosilicate Petri dish (100 mm diameter × 15 mm height, Fisher Scientific, Agawam, MA) using that same adhesive. These constructs were then used as templates to create inverse PDMS molds, as depicted in .Citation21
Figure 1 Production of PDMS molds and casting of nanostructured PLGA films: (A) 190 nm, 300 nm, 400 nm, and 530 nm PS beads were dispersion deposited on glass coverslips; (B) Coverslip fixed to equal diameter glass rod (green); (C) Coverslip/glass rod fixed to Petri dish; (D) PDMS (orange) poured to fill Petri dish; (E) PDMS from the previous step removed from the Petri dish, inverted, and placed in a larger Petri dish (red), with additional PDMS (orange), leaving a well in PDMS (white) with a nanotextured bottom; (F) PLGA in chloroform (blue) poured into well then allowed to evaporate; and (G) Dried PLGA removed from the well and inverted, leaving PLGA surfaces with spherical nanometer surface features. Copyright © 2008 obtained with permission from Carpenter J, Khang D, Webster TJ. Nanometer polymer surface features: The influence on surface energy, protein adsorption and endothelial cell adhesion. Nanotechnology. 2008;19(50):505103.
Abbreviations: PDMS, polydimethylsiloxane; PLGA, poly-lactic-co-glycolic acid; PS, polystyrene.
PDMS (Sylgard 184 silicone elastomer, Dow Corning, Midland, MI) was then mixed according to the manufacturer’s directions (curing agent:base, 1:10 vol%) and then exposed to a vacuum (25 in Hg for 20 minutes) to remove bubbles created during the mixing process. The resulting mixture was then poured over the PS bead/glass constructs described above, filling the Petri dishes, and was then allowed to cure for 48 hours at room temperature. PDMS molds were then peeled away from their respective substrates, inverted, and placed in the cover of the borosilicate Petri dish. Additional PDMS was poured around the edge to fix the molds onto the Petri dishes, preventing deformation by organic solvents, specifically chloroform. All molds were then rinsed several times with chloroform to remove any residual PS beads. This process created a series of 18 mm diameter × 1 cm deep PDMS wells with highly ordered, inverse casts of nanoscale PS beads, which could then be used to create PLGA surfaces with spherical nanoscale surface features.
For this, PLGA (50:50 wt:wt%, molecular weight, 12–16 × 103 g; Polysciences, Warrington, PA) was dissolved by sonicating a 4% PLGA chloroform solution for approximately 10 minutes, or until fully dissolved. The resultant solution was poured over the PDMS molds described above, then allowed to evaporate for 48 hours at room temperature. PLGA films were then peeled back from their molds, and cut into 12 mm diameter discs. Different PLGA surface features were also created by preparing 8% and 4% PLGA solutions in chloroform, then depositing 200 μL of each solution onto 12 mm diameter borosilicate glass coverslips (Fisher Scientific) that were cleaned and degreased using the procedure previously described. Once again, chloroform was allowed to evaporate for 48 hours. All surfaces were then stored under vacuum (20 in Hg) until use. Prior to cell culture experiments, all of the resulting PLGA films were sterilized under ultraviolet light for 24 hours.
The 12 mm diameter glass coverslips were used as a reference substrate for cell density experiments. Coverslips were cleaned and degreased as described above, then etched in 1 M NaOH for one hour. The coverslips were then washed in dH2O and sterilized under ultraviolet light for 24 hours.
Surface characterization
AFM surface topography images of all the PLGA films created were obtained in ambient air using a PSIA XE150 AFM with PPP-NCHR probe. The AFM operated in non-contact mode at a frequency of roughly 300 kHz, a scan rate of 0.8 Hz, and 256 lines/scan. The scan area was 2 μm × 2 μm for all images. An XEI image processing program (version 1.7.1; Park Systems) was used to analyze the resulting images and obtain the root-mean-squared (RMS) roughness which is the standard deviation of the height value in the selected line. RMS surface roughness (nm) in four random fields per sample were obtained and averaged.
Electron spectroscopy for chemical analysis (ESCA) was performed on all samples using a Perkin Elmer 5500 multitechnique surface analyzer. An aluminum Kα1,2 monochromatized X-ray source was used to stimulate photoemission of the inner shell electrons of the samples. The energy of the electrons was then recorded and analyzed to identify the surface elements.
Contact angles on PLGA were measured for each PLGA film using a drop shape analysis system (DSA-10; Kruss) with analysis software (DSA1 version 1.80). A 3 μL drop of dH2O was placed onto the PLGA films to obtain static contact angles. Three different substrate fields were measured per sample and three separate samples were measured for each surface.
Cell culture and density experiments
A lung carcinoma cell line A549 was purchased from ATCC and used without further characterization. Cells were cultured in ATCC-formulated F-12K medium with 10% fetal bovine serum and were incubated in a sterile, humidified environment of 95% and 5% CO2, at 37°C. Cells at population numbers between four and seven were washed with PBS twice, then trypsinized (to remove for tissue culture), centrifuged, and diluted into a suitable concentration with F-12K medium. Cells were counted using a hemocytometer, then seeded onto the various surfaces at a density of either 7000 cells/cm2 or 3500 cells/cm2. After cell adhesion for four hours in an incubator, samples were washed with PBS twice, fixed for 10 minutes in 10% formalin buffer and nuclei stained with DAPI. A Zeiss Axiovert 200M fluorescence microscope was used to view and count the stained cells. Five random areas were chosen to count cells and an average for each sample was obtained.
A549 cells were also seeded at a density of 50,000 cells/cm2 and cultured for three days onto the various samples in F-12K medium with 10% fetal bovine serum, and incubated in a sterile, humidified environment of 95% air and 5% CO2, at 37°C. The cell culture medium was replaced every other day. After three days, the substrates were washed with PBS twice, and trypsinized with trypsin/EDTA (ethylenediamine tetraacetic acid). The samples were examined under microscopy after trypsinization to determine that all cells lifted. Lifted cells were then counted using a hemocytometer.
Statistics
All experiments were run in duplicate and repeated at least three times. Results were analyzed for statistical significance using Student t-tests in Excel, and data were expressed as the mean ± standard deviation of the mean. There different significance levels (P < 0.01, P < 0.05, and P < 0.1) were noted.
Results
Surface characterization
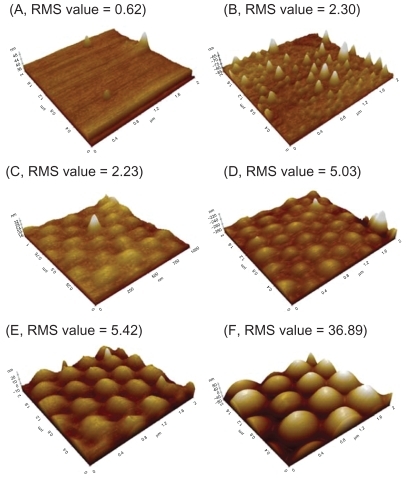
AFM images of the various PLGA surfaces demonstrated different nanometer roughness, which provided evidence of the intended spherical surface topography on the PLGA surfaces using the methods described above (). Specifically, PLGA surfaces with RMS values of 2.23, 5.03, 5.42, and 36.89 nm were obtained by using PS beads with diameters of 190 nm, 300 nm, 400 nm, and 530 nm, respectively. Additional results of this study showed that the two different concentrations of PLGA used created surfaces of different roughness. Specifically, PLGA surfaces with RMS values of 0.62 and 2.30 nm were obtained when using concentrations of 8% and 4% in chloroform, respectively.
Figure 2 AFM images and RMS values: (A–B) AFM images of PLGA surfaces created by solution evaporation with (A) 0.5 g PLGA:8 mL chloroform, (B) 0.5 g PLGA:4 mL chloroform. (C–F) AFM images of PLGA surfaces created by using templates of PS nanobeads with a diameter of (C) 190 nm, (D) 300 nm, (E) 400 nm and (F) 530 nm.
Abbreviations: AFM, atomic force microscopy; RMS, root mean square roughness; PLGA, poly-lactic-co-glycolic acid; PS, polystyrene.
ESCA results showed the same chemistry between all PLGA surfaces created by the two different methods (that is, using different concentrations of PLGA in chloroform or using PS beads). Each result indicated that there was no silicon contamination on the PLGA cast surfaces through the use of the PDMS mold process.
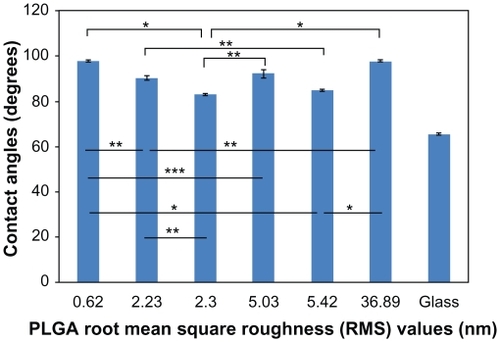
The contact angles on PLGA were 97.8°, 90.4°, 83.3°, 92.2°, 85.0°, and 97.7°, corresponding to the surfaces with RMS values of 0.62, 2.23, 2.30, 5.03, 5.42, and 36.90 nm, respectively. Results of this study further showed that PLGA surfaces with a RMS value of 2.30 nm had the lowest contact angle (about 85°), corresponding to the most hydrophilic surfaces, while PLGA surfaces with an RMS value of 0.62 nm had the highest contact angle (about 98°), corresponding to the most hydrophobic surfaces ().
Figure 3 dH2O static contact angles on PLGA samples. Static contact angles were obtained immediately after the deposition of a 3 μL drop of dH2O under ambient conditions.
Notes: Values are mean ± SEM, n = 3. *P < 0.01, **P < 0.05 and ***P < 0.1.
Abbreviations: dH2O, distilled water; PLGA, poly(lactic-co-glycolic) acid; SEM, standard error of the mean.
Lung carcinoma cell adhesion
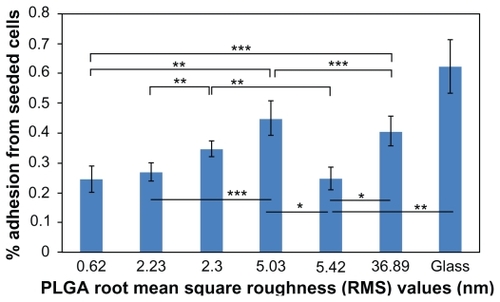
After four hours of cell adhesion, 24.54%, 26.78%, 34.53%, 44.83%, 24.67%, and 40.74% cells from the seeded densities adhered to the PLGA surfaces with RMS values of 0.62, 2.23, 2.30, 5.03, 5.42, and 36.90 nm, respectively (). Most importantly, results of this study showed the least number of lung carcinoma epithelial cells adherent to the PLGA surfaces with RMS values of 0.62, 2.23, and 5.42 nm. The results of this study indicated that compared with the PLGA surfaces with an RMS value of 2.23 nm, 2.11% fewer lung carcinoma cells adhered to PLGA surfaces with an RMS value of 5.42 nm. However, the two numbers were not significantly different. Compared with the surfaces with an RMS value of 2.30 nm, 7.75% and 9.86% fewer cells adhered to the surfaces, with RMS values of 2.23 and 5.42 nm, respectively (P < 0.05). There was no significant difference in cancer cell attachment between PLGA surfaces with RMS values of 2.30 nm and 5.03 or 36.89 nm. Compared with the PLGA surfaces having an RMS value of 0.62 nm, 20.29% and 16.20% more cancer cells adhered to the surfaces with RMS values of 5.03 (P < 0.05) and 36.89 nm, respectively (P < 0.05). However, no significant difference existed between lung cancer cell adhesion on PLGA surfaces with an RMS value of 0.62 nm and 2.23 nm or 5.42 nm. For surfaces with RMS values of 2.23, 5.03, 5.42, and 36.89 nm, fewer cancer cells adhered to the surfaces with RMS values of 2.23 and 5.42 nm than surfaces with RMS values of 5.03 and 36.89 nm. No significant differences existed between surfaces with an RMS value of 2.23 nm and surfaces with an RMS value of 5.42 nm. Thus, such results indicated that PLGA surface nanoroughness had an extreme effect on the adhesion of lung carcinoma epithelial cells. By creating specific surface nanoroughness, lung cancer epithelial cell density can be minimized.
Figure 4 Lung cancer epithelial cell adhesion results on the various PLGA samples and borosilicate glass. Data expressed as mean ± standard deviation of the mean.
Notes: *P < 0.01, **P < 0.05 and **P < 0.1. Less lung carcinoma cells adhered to the PLGA surfaces with an RMS value of 5.42 nm, compared with the surfaces with an RMS value of 2.30 nm (P < 0.05). Comparing the PLGA surfaces with RMS values of 2.30, 2.23, and 5.42 nm, the least cells adhered to the surfaces with an RMS value of 5.42 nm. PLGA surfaces with RMS values of 5.42, 0.62, and 2.23 nm had the least cancer cell adhesion.
Abbreviations: PLGA, poly(lactic-co-glycolic) acid; RMS, root mean square roughness.
Lung carcinoma cell proliferation
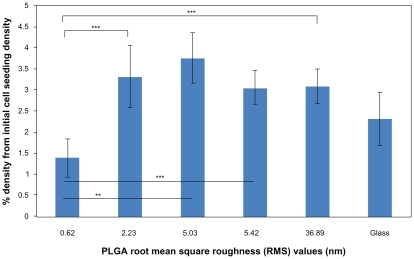
Three-day cell proliferation results on the different nanorough PLGA surfaces revealed similar trends as the adhesion results (). Specifically, less lung cancer epithelial cell density existed on the PLGA surfaces with an RMS value of 0.62 nm compared with the PLGA surfaces with RMS values of 2.23 (P < 0.1), 5.03 (P < 0.05), 5.42 (P < 0.1), and 36.89 (P < 0.1) nm. However, there was no significant difference among the nanostructured PLGA surfaces with RMS values of 2.23, 5.03, 5.42, and 36.89 nm. Specifically, cell densities on PLGA surfaces with RMS values of 2.23, 5.03, 5.42, and 36.89 nm were 239%, 270%, 220%, and 223% more than on PLGA surfaces with an RMS value of 0.62 nm, respectively, after three days. In summary, results of this study demonstrated significantly less lung cancer epithelial cell density on PLGA surfaces with an RMS value of 0.62 nm, which should be further explored to reduce cancer cell growth when developing lung replacements for lung cancer patients.
Figure 5 Lung cancer epithelial cell proliferation results on the various PLGA samples and borosilicate glass. Cell seeding density was 50,000 cells/cm2.
Notes: Data expressed as mean ± standard deviation of the mean. **P < 0.05 and ***P < 0.1. The PLGA surfaces with an RMS value of 0.62 nm had lower cancer cell densities after three days than any other nanorough PLGA surfaces.
Abbreviations: PLGA, poly(lactic-co-glycolic) acid; RMS, root mean square roughness.
Discussion
A large amount of research has indicated that micro- and nanorough surfaces could mediate cell responses.Citation1 However, most of this research has focused on noncancerous cells. For this reason, nanorough PLGA surfaces with different nanometer RMS values were used here to investigate lung cancer cell responses. Importantly, these surfaces had the same surface chemistry but different surface morphologies, suggesting that the differences in cell results resulted only from changes in surface nanometer roughness. Moreover, such nanorough surfaces could be replicated on many polymer surfaces (provided that the solvent used does not adversely affect the PDMS mold).Citation21 In this manner, many different polymeric materials can be created to have diverse nanorough features to investigate a wide range of cancerous cell responses.
In this research, lung carcinoma cell attachment and density on PLGA surfaces with different RMS values were examined for four hours and three days. The results indicated that for the four-hour cell adhesion time point, PLGA surfaces with RMS values of 5.42, 0.62, and 2.23 nm inhibited cancer cell adhesion the most. The RMS 0.62 nm PLGA surfaces were created by the solution evaporation method at a lower concentration, while the 2.23 and 5.42 nm RMS value PLGA surfaces were created by the PS self-assembly nanoarrays. Importantly, the trend of decreasing cancerous cell density with decreased nanometer RMS values was not linear because PLGA surfaces with an RMS value of 5.42 showed nearly the same cell adhesion as PLGA surfaces with an RMS value of 0.62. Such results suggest that nanorough surfaces with specific RMS values may inhibit cancer cell functions by reducing their density. Choi et al also observed less cell density on sharp-tip nanopost structures;Citation14 a similar result was also observed on zinc oxide nanorod surfaces.Citation22 In the present research, the PLGA surfaces with an RMS value of 5.42 nm had nanospherical arrays with diameters of 400 nm and decreased cancer cell adhesion similar to those needle-like, high-aspect ratio surfaces.
For the three-day cell density assay, the trend was consistent with the four-hour cell adhesion result, however, PLGA surfaces with an RMS value of 0.62 nm emerged as the best PLGA surface to inhibit cancerous cell density. Among the nanorough PLGA surfaces, the surfaces with an RMS value of 5.42 nm showed lower cell density and higher cell density than the surfaces with an RMS value of 0.62.
Importantly, extensive research has been conducted to determine why tissue growth (such as bone, bladder, and neural tissue) is enhanced on nanostructured surfaces whether composed of polymers, metals, ceramics, or composites.Citation1 Such studies have focused on altered initial protein adsorption and bioactivity when adsorbing on nanostructured compared with microstructured or smooth surfaces. Although not explicitly studied, results from this study support the fact that the altered PLGA surface energetics may be responsible for changes in cancerous cell densities by mediating different protein adsorption events. Specifically, from the contact angle results, the RMS 0.62 nm PLGA surface was one of the most hydrophobic PLGA surfaces created in this study, which most likely caused altered initial protein interactions to decrease cancer cell attachment. Interestingly, the 5.42 nm PLGA surface was relatively hydrophilic but also had less cancerous cell adhesion compared with some of the other PLGA surfaces, thus, also suggesting different initial protein adsorption (albeit different from the 0.62 hydrophobic PLGA surfaces). Identification of altered initial protein adsorption events responsible for this trend needs to be the focus of future studies.
Conclusions
In this research, a simple method was used to create nanorough PLGA surfaces with highly ordered nanospherical structures. The results of lung epithelial cancerous cell density assays showed that PLGA surfaces with an RMS value of 0.62 nm (followed by PLGA surfaces with an RMS value of 5.42 nm) inhibited lung epithelial cancerous cell densities the most. Since contact angles also significantly changed (but surface chemistry remained the same) among the various PLGA nano-meter surfaces created, a surface energy-related mechanism may be responsible. In summary, this study demonstrated that specific PLGA nano-meter surface features should be further studied for lung replacement strategies that require decreased cancerous cell growth.
Acknowledgements
The authors would like to thank the Hermann Foundation for funding and the Northeastern Research Center for AFM use. The authors report no conflicts of interest in this work.
References
- LiuHWebsterTJNanomedicine for implants: A review of studies and necessary experimental toolsBiomaterials200728235436917049982
- VogelVSheetzMLocal force and geometry sensing regulate cell functionsNat Rev Mol Cell Biol20067426527516607289
- DalbyMJRiehleMOSutherlandDSAgheliHCurtisASGChanges in fibroblast morphology in response to nano-columns produced by colloidal lithographyBiomaterials200425235415542215130726
- NomuraSKojimaHOhyabuYKuwabaraKMiyauchiAUemuraTCell culture on nanopillar sheet: Study of HeLa cells on nanopillar sheetJ Artif Organs200692909616807811
- TurnerSKamLIsaacsonMCraigheadHGShainWTurnerJCell attachment on silicon nanostructuresJ Vac Sci Technol B199715628482854
- CharestJLGarciaAJKingWPMyoblast alignment and differentiation on cell culture substrates with microscale topography and model chemistriesBiomaterials200728132202221017267031
- WoodMAWilkinsonCDCurtisASThe effects of colloidal nanotopography on initial fibroblast adhesion and morphologyIEEE Trans Nanobioscience200651203116570870
- DalbyMJPasquiDAffrossmanSCell response to nano-islands produced by polymer demixing: A brief reviewIEE Proc Nanobiotechnol20041512536116475843
- YimEKReanoRMPangSWYeeAFChenCSLeongKWNanopattern- induced changes in morphology and motility of smooth muscle cellsBiomaterials200526265405541315814139
- ZhuBLuQYinJHuJWangZAlignment of osteoblast-like cells and cell-produced collagen matrix induced by nanogroovesTissue Eng20051156825834
- ColettiDTeodoriLAlbertiniMCStatic magnetic fields enhance skeletal muscle differentiation in vitro by improving myoblast alignmentCytometry A2007711084685617694560
- CharestJLGarciaAJKingWPMyoblast alignment and differentiation on cell culture substrates with microscale topography and model chemistriesBiomaterials200728132202221017267031
- ArnoldMCavalcanti-AdamEAGlassRActivation of integrin function by nanopatterned adhesive interfacesChemphyschem20045338338815067875
- ChoiCHHagvallSHWuBMDunnJCYBeyguiREKimCJCell interaction with three-dimensional sharp-tip nanotopographyBiomaterials20072891672167917174392
- Tzvetkova-ChevolleauTStephanouAFuardDOhayonJSchiavonePTracquiPThe motility of normal and cancer cells in response to the combined influence of the substrate rigidity and anisotropic microstructureBiomaterials200829101541155118191193
- BerryCCDalbyMJMcCloyDAffrossmanSThe fibroblast response to tubes exhibiting internal nanotopographyBiomaterials200526244985499215769534
- GeorgePADonoseBCCooper-WhiteJJSelf-assembling polystyrene-block-poly(ethylene oxide) copolymer surface coatings: Resistance to protein and cell adhesionBiomaterials200930132449245619201020
- LiuHWebsterTJNanomedicine for implants: A review of studies and necessary experimental toolsBiomaterials200628235436917049982
- Tzvetkova-ChevolleauTStephanouAFuardDOhayonJSchiavonePTracquiPThe motility of normal and cancer cells in response to the combined influence of the substrate rigidity and anisotropic microstructureBiomaterials29101541155118191193
- World Health OrganizationCancer2009 Accessed from http://www.who.int/mediacentre/factsheets/fs297/enAccessed on January 10, 2010
- CarpenterJKhangDWebsterTJNanometer polymer surface features: The influence on surface energy, protein adsorption and endothelial cell adhesionNanotechnology2008195050510319942760
- LeeJYKangBSHicksBThe control of cell adhesion and viability by zinc oxide nanorodsBiomaterials200829273743374918550161