
Abstract
Lead sulfide (PbS) quantum dots (QDs) have been applied in the biomedical area because they offer an excellent platform for theragnostic applications. In order to comprehensively evaluate the biocompatibility of PbS QDs in human cells, we analyzed the exosomes secreted from cells because exosomes are released during cellular stress to convey signals to other cells and serve as a reservoir of enriched biomarkers. PbS QDs were synthesized and coated with 3-mercaptopropionic acid (MPA) to allow the particles to disperse in water. Exosomes were isolated from HEK293 cells treated with PbS–MPA at concentrations of 0 µg/mL, 5 µg/mL, and 50 µg/mL, and the exosomal expression levels of miRNAs and proteins were analyzed. As a result, five miRNAs and two proteins were proposed as specific exosomal biomarkers for the exposure of HEK293 cells to PbS–MPA. Based on the pathway analysis, the molecular signature of the exosomes suggested that PbS–MPA QDs had carcinogenic activity. The comet assay and expression of molecular markers, such as p53, interleukin (IL)-8, and C-X-C motif chemokine 5, indicated that DNA damage occurred in HEK293 cells following PbS–MPA exposure, which supported the carcinogenic activity of the particles. In addition, there was obvious intensification of miRNA expression signals in the exosomes compared with that of the parent cells, which suggested that exosomal biomarkers could be detected more sensitively than those of whole cellular extracts.
Introduction
Owing to the increased interest in nanomaterial toxicity, studies have been performed to evaluate the pathological effects of nanomaterials on human body. Previous reports have revealed the toxic effects of nanomaterials, such as oxidative stress, inflammation, growth inhibition, and apoptosis. However, high-throughput screening of biomarkers also is required because new nanomaterials with unprecedented structures and functions are constantly being synthesized, resulting in unpredictable toxicological responses.
High-throughput screening approaches, including gene arrays, RNA sequencing, and proteome analysis by two-dimensional (2D) electrophoresis and subsequent matrix assisted laser desorption/ionization time of flight mass spectrometry (MALDI-TOF) analysis, have been applied to identify the biological pathways affected by nanomaterials.Citation1,Citation2 These are efficient tools to identify molecular changes in extracts of whole cells or tissue, but the results include numerous molecular changes and sometimes lead to false-positive or false-negative results.
In most mammalian cells, portions of the plasma membrane are regularly internalized as endosomes, which become exosomes when they merge with the cell membrane and subsequently, are released into the extracellular space. The secreted exosomes can be transferred from one cell to another via membrane vesicle trafficking and may function in cell-to-cell signaling to affect signal transduction in recipient cells.Citation3–Citation5 RNAs, proteins, lipids, and metabolites in exosomes reflect the physiological status of their cells of origin, suggesting that they can serve as reservoirs of enriched biomarkers to predict the progress of pathological conditions.Citation6–Citation9
Therefore, we propose that the analysis of exosomal content following exposure to nanomaterials can provide insight into their characteristic biological responses and allow us to focus on toxicologically potential molecules during biomarker screening. Because exosomes are present in the cell culture medium of primary cells and cell lines, as well as in various biological fluids such as blood and urine, exosome-based biomarker characterization could be applied to in vitro screening of nanomaterial toxicity.
Lead sulfide (PbS) has been used in recent years to study the quantum size effect by analysis of its structural, optical, and electrical properties.Citation10,Citation11 PbS quantum dots (QDs), with diameters <10 nm and emission wavelengths in the near-infrared region, have been proposed as materials that could be applied in biomedical detection approaches.Citation12 However, QDs can transfer energy to nearby oxygen molecules, which could induce reactive oxygen species generation, and thus lead to inflammation or carcinogenesis.Citation13 Therefore, biosafety concern is an important issue in approaches using ultra-small QDs instead of organic dyes for cancer imaging and intracellular diagnostics.Citation14 Reports have demonstrated that PbS QDs are toxic to fishesCitation15 and rat neurons;Citation12 however, the responses of human cells to PbS QDs have not been evaluated comprehensively.
In this study, PbS QDs modified by 3-mercaptopropionic acid (MPA) were synthesized, and their toxic effects on HEK293 cells were evaluated by utilizing an exosome-based screening approach. The exosomal miRNA and proteins significantly altered by PbS–MPA QDs were proposed as specific biomarkers, which were used to predict related biological processes that might have been affected by the treatment. The effects of PbS–MPA QDs on signaling in HEK293 cells were confirmed by cellular and molecular assays. In addition, the intensification of biomarker expression signals in exosomes in comparison with the parent cells was analyzed to verify the increased sensitivity of the exosome-based biomarker screening method.
Materials and methods
Preparation of PbS and PbS–MPA QDs
Moody et alCitation16 have previously reported this procedure. Briefly, a solution containing 0.45 g of PbO (2.016 mmol), 1.5 mL of oleic acid (4.75 mmol), 0.165 mL of oleyl amine (0.502 mmol), and 18 mL of 1-octadecene was degassed in a 100-mL three-neck flask at room temperature for 24 hours under vacuum. Then, the solution was heated to 120°C under an argon atmosphere and was maintained at this temperature for 5 minutes until the solution color became clear. Another solution containing 10 mL of 1-octadecene was degassed in a 100-mL three-neck flask at 80°C for 16 hours under vacuum. After the degassing process, 0.213 mL of bis(trimethylsilyl) sulfide was added to this solution, and the solution was cooled to ambient temperature. The two solutions were then mixed using a glass syringe, and the combined solution was cooled to ambient temperature. The product was purified with acetone via two rounds of centrifugation at 10,000× g for 10 minutes each and stored in toluene.
PbS–MPA QDs dispersed in water were prepared by the exchange of oleic acid with MPA, a conventional water dispersant for nanoparticles.Citation17 Briefly, 0.5 g of QD sample was washed and precipitated thrice with a solution of 50:50 methanol:acetone and dissolved in 12 mL of chloroform containing 0.25 g of MPA. This solution was stirred under nitrogen for 24 hours. The solution was then centrifuged to separate the hydrophilic nanoparticles and washed thrice in hexane. Excess organic solvent was removed from the dry product using vacuum and, subsequently, dispersed in phosphate-buffered saline (PBS).
Property analysis of synthesized PbS QDs and PbS–MPA QDs
The morphology of the synthesized particles was analyzed using transmission electron microscopy ([TEM]; HF-3300, Hitachi, Tokyo, Japan) at an acceleration voltage of 300 kV. For TEM analysis, samples were dispersed in toluene, and a drop of this suspension was deposited on an amorphous carbon film copper grid at ambient air. The average particle size was determined by image analysis. The elemental analysis of the synthesized particles was performed by powder X-ray diffraction (XRD; Empyrean, PANalytical, Almelo, the Netherlands) using Cu K-alpha radiation at a generator voltage of 40 kV and a tube current of 30 mA.
After MPA treatment, the particles were reanalyzed using TEM, and the mean diameter of the MPA-coated particles dispersed in PBS was determined by dynamic light scattering ([DLS]; ZetaSizer NanoZS, Malvern Instrument, Malvern, UK). Fourier transform infrared (FT-IR) spectra were obtained using Nicolet iS10 (Thermo Fisher Scientific, Waltham, MA, USA). All spectra were averaged across 512 scans and reported in transmission mode relative to a clean gold surface.
Cell culture
HEK293 cells (ATCC® CRL-1573™; American Type Culture Collection, Manassas, VA, USA) and TCMK-1 cells (ATCC CCL-139™) were grown in minimum essential medium (MEM) (Thermo Fisher Scientific) supplemented with 10% fetal bovine serum (FBS) (Thermo Fisher Scientific). THP-1 cells (ATCC TIB-202™) were grown in RPMI-1640 medium (Thermo Fisher Scientific) supplemented with 10% FBS. AML12 cells (ATCC CRL-2254™) were grown in Ham’s F-12K medium (Thermo Fisher Scientific) supplemented with 10% FBS. The cells were maintained at 37°C and 5% CO2 in a humidified incubator, and the medium was changed every other day.
Cytotoxicity of PbS–MPA
To determine the cytotoxicity of PbS–MPA QDs, cells were seeded at a density of 1×10³ cells/well in 96-well plates in 100 µL medium and incubated for 24 hours. The cells were then incubated with fresh medium containing PbS–MPA particles at the intended concentrations (0–400 µg/mL) for 48 hours. Cells cultured in an equal volume of vehicle (PBS) were used as a control. To measure the cytotoxicity, the Cell Counting Kit-8 (CCK-8; Enzo Life Science, Farmingdale, NY, USA) was used in accordance with the manufacturer’s instructions. Briefly, 10 µL of CCK-8 reagent was added into each well, and the plate was incubated at 37°C for 2 hours. The absorbance was detected at 450 nm using a Multiskan microplate reader (Thermo Fisher Scientific). The cytotoxicity was expressed as the percent cell viability relative to the viability of the control cells. All experiments were performed in triplicate, and the half-maximal inhibitory concentration (IC50) for growth inhibition was calculated using Sigma Plot version 12.3 (Systat Software, Inc., San Jose, CA, USA).
Isolation and characterization of exosomes secreted from PbS–MPA QD-exposed HEK293 cells
The exosomes were isolated using ExoQuick-TC™ (System Bioscience, Mountain View, CA, USA), according to the manufacturer’s instructions. Briefly, 10 mL of HEK293 culture media was collected after 0 µg/mL, 5 µg/mL, and 50 µg/mL PbS–MPA treatment and centrifuged at 3,000× g for 15 minutes to remove cells and cell debris. The supernatant was transferred to a sterile tube and 2 mL of ExoQuick-TC was added. The ExoQuick-TC/biofluid mixture was refrigerated overnight and then centrifuged at 1,500× g for 30 minutes. After centrifugation, the exosome pellet at the bottom of the tube was resuspended in 500 µL of PBS and used for further analysis.
The isolated exosomes were observed by TEM (Tecani™ G2 Spirit; FEI Company, Hillsboro, OR, USA) to identify the shape and the extent of dispersion. Prior to observation with bio-TEM, the samples were stained with methanolic uranyl acetate and lead citrate.Citation18 The particle size distribution was analyzed by DLS.
Quantitative polymerase chain reaction analysis of exosomal and cellular miRNAs
The isolated exosomes and parent cells exposed to 0 µg/mL, 5 µg/mL, and 50 µg/mL PbS–MPA were used for miRNA analysis. Small RNA isolation, poly-A tailing, and cDNA synthesis were performed using the SeraMir™ RNA Amplification Kit (System Bioscience). To normalize the sample-to-sample variation, control miRNA provided by the manufacturer was spiked into each sample, and after this step, the RNA Amplification Kit protocol was followed in accordance with the manufacturer’s instructions. Small RNA concentrations were verified using an Agilent 2100 bioanalyzer (Agilent Technologies, Santa Clara, CA, USA), and 10 ng of small RNA was used for cDNA synthesis. The synthesized cDNA was diluted to 1:10, and 1 µL of cDNA was used in each quantitative polymerase chain reaction (qPCR) reaction. The global expression profiling of exosomal miRNAs was performed according to manufacturer’s instructions using 380 miRNA-specific primers that were obtained from the human exosomal miRNA profiling kit (Cat# RA820TC-1; System Bioscience) in combination with a universal reverse primer. qPCR was carried out in an ABI7900HT Real-Time PCR System (Thermo Fisher Scientific). Samples from three independent experiments were analyzed. The comparative threshold cycle (Ct) method was used to quantify the expression levels. The expression level (2−ΔCt) was determined by normalization to the control miRNA, and fold changes in expression from treated samples to untreated samples were calculated with the 2−ΔΔCt method.Citation19
Exosomal proteome analysis
The isolated exosomes from 0 µg/mL, 5 µg/mL, and 50 µg/mL PbS–MPA were used for proteome analysis. Exosomes isolated from three independent experiments were pooled into one sample. The pooled exosomes were lysed with a solution containing 7 M urea, 2 M thiourea containing 4% (w/v) 3-[(3-cholamidopropy)dimethyammonio]-1-propanesulfonate, 1% (w/v) dithiothreitol and 2% (v/v) pharmalyte, and 1 mM benzamidine. Proteins were extracted for 1 hour at room temperature with vortexing. After centrifugation at 15,000× g for 1 hour at 15°C, the soluble fraction obtained was used for 2D sodium dodecyl sulfate-polyacrylamide gel electrophoresis (SDS-PAGE). Isoelectric focusing was performed using immobilized pH gradient dry strips (24 cm, Genomine, Pohang, Korea) loaded with 30 µg of proteins with a Multiphor II electrophoresis unit (Amersham Bioscience, Piscataway, NJ, USA) according to the manufacturer’s instruction. Subsequently, gels were silver stained as described previously.Citation20 Quantitative analysis of digitized images was carried out using PDQuest Ver. 7.0 software (Bio-Rad Laboratories Inc., Hercules, CA, USA). Protein spots that met the selection criteria were excised from the gels, digested with trypsin, and subjected to MALDI-TOF analysis (Microflex LRF 20; Bruker, Billerica, MA, USA).Citation21 The search program MASCOT, developed by Matrixscience (http://www.matrixscience.com/), was used for protein identification by peptide map fingerprint (PMF). Spectra were calibrated with trypsin autodigestion ion peaks m/z (842.510 and 2,211.1046) as the internal standard.
Cellular and exosomal protein expression analysis by Western blotting
To identify the protein expression by Western blotting, the exosome and cell pellets were resuspended in 200 µL RIPA buffer (Sigma-Aldrich Co., St Louis, MO, USA) with protease inhibitor cocktail (Sigma-Aldrich) and incubated at room temperature for 5 minutes to allow complete lysis of exosomes. Next, Laemmli buffer (4% SDS, 20% glycerol, 10% 2-mercaptoethanol, 0.004% bromophenol blue, 0.125 M Tris–HCl, pH 6.8) with β-mercaptoethanol was added, and SDS-PAGE was performed following the procedure described by Laemmli.Citation22 The proteins separated by SDS-PAGE were transferred to a polyvinylidene di fluoride membrane using a transfer apparatus according to the manufacturer’s protocols (Bio-Rad Laboratories Inc.). After incubation with 5% nonfat milk in tris-buffered saline and tween 20 (TBST) (10 mM Tris, pH 8.0, 150 mM NaCl, 0.5% Tween 20) for 60 minutes, the membrane was washed once with TBST and incubated with antibodies against target proteins at 4°C for 12 hours. Membranes were washed thrice for 10 minutes and incubated with a 1:3,000 dilution of horseradish peroxidase-conjugated anti-rabbit antibodies for 2 hours. Blots were washed with TBST thrice and developed with the ECL system (Amersham Biosciences) according to the manufacturer’s protocols.
For CD63 and CD9 expression analysis, rabbit anti-human CD63 and CD9 antibodies (1:1,000) were used (ExoAb Antibody Sampler Kit, System Bioscience). To measure leucine-rich repeat-containing protein 23 (LRRC23) and keratin 5 (KRT5) expression levels in exosomes and parent cells, rabbit anti-human LRRC23 and anti-human KRT5 antibodies (1:1,000) (Abcam, Cambridge, UK) were used. The exosomal and cellular protein expression levels were normalized to CD9 and β-actin expression, respectively. The fold changes for upregulated samples were determined by the ratio of the expression levels for treated to control samples. In the case of downregulated samples, the fold changes were determined by the ratio of the control to treated samples and expressed as negative values.
Samples from three independent experiments were used in this analysis. The relative expression level was determined using an image analyzer (UN-SCAN-IT Ver. 6.1; Silk Scientific Corporation, Orem, UT, USA).
Analysis of DNA damage activity by comet assay
HEK293 cells were plated at a density of 2×10⁵ cells/well in six-well dishes. After treatment with 0 µg/mL, 5 µg/mL, and 50 µg/mL PbS–MPA QDs for 48 hours, cells were trypsinized and analyzed using the Comet SCGE assay kit (Enzo Life Science) according to the manufacturer’s instructions. Briefly, cells were embedded in agarose on a glass slide. Cells were maintained in lysis buffer (2.5 M NaCl, 0.1 M EDTA, 10 mM Tris, 1% sodium lauryl sarcosinate, and 1% (v/v) Triton X-100) for 1 hour at 4°C. Slides were then incubated with alkaline electrophoresis buffer (10 M NaOH and 200 mM EDTA) for 60 minutes to allow the DNA to unwind. Subsequently, electrophoresis was carried out for 30 minutes at 300 mA. Next, the slide was immersed in 70% ethanol for 5 minutes, air dried, and stained with Hoechst dye (Enzo Life Science). For quantification, comets on each gel were observed using a fluorescence microscope (Leica Microsystems, Wetzlar, Germany) and classified according to the relative intensity and shape of fluorescence.
qPCR for cellular mRNAs
RNA extraction was performed using TRIzol reagent (Thermo Fisher Scientific). RNA cleanup was performed using the RNeasy Mini Kit 50 (Qiagen NV, Venlo, the Netherlands). cDNA synthesis was performed at 37°C for 60 minutes with 100 ng RNA using random hexamer primers and virus reverse transcriptase (GibcoBRL, Karlsruhe, Germany). qPCR was performed using the LightCycler-DNA Master SYBR Green I Kit (Hoffman-La Roche Ltd., Basel, Switzerland) according to the manufacturer’s instructions with an ABI7900HT Real-Time PCR System (Thermo Fisher Scientific). Measurement of gene expression was performed for target genes using human-specific primers purchased from Exiqon (Vedbaek, Denmark). The relative quantity of the target mRNA was normalized to an endogenous gene (glyceraldehyde 3-phosphate dehydrogenase). The fold changes in RNA expression were calculated using the 2−ΔΔCt method.
Statistical analysis
To select differentially expressed miRNAs, a P-value of <0.05 for expression level and a fold change of >3 in samples treated with 50 µg/mL were defined as the selection criteria. For all experiments, data from three independent experiments were analyzed using the Student’s t-test and are reported as mean ± standard deviation. Sigma Plot version 12.3 was used (Systat Software, Inc.) to determine the P-values, and a P-value <0.05 was considered statistically significant.
Results
Properties of the synthesized PbS and PbS–MPA QDs
shows the physicochemical properties of the synthesized PbS and PbS–MPA QDs. Based on the TEM images shown in , the PbS QDs were extremely monodispersed in size and shape, and the particle size was determined to be 2.15 nm (n=92) by image analysis (). XRD analysis of the PbS QDs showed that the synthesized particles were composed of PbS compounds (JCPDS 03-065-0692 and ICCD-5-592) ().Citation23 For biological tests of the PbS QDs synthesized in this study, the hydrophobic particle surface was exchanged with MPA to allow the particles to disperse in water. After the particles were coated, the TEM images showed particle agglomeration (). The hydrodynamic diameter was determined to be 223±11 nm via DLS analysis (). The aggregation of the PbS–MPA QDs was attributed to the negative charge (−8.43±4.89 mV zeta potential) of the MPA on the particle surface. It has been reported that small molecules carrying a net charge, such as MPA, tend to contribute to aggregation of QDs in buffers, resulting in increased hydrodynamic diameter.Citation24
Figure 1 Characterization of PbS and PbS–MPA QDs.
Notes: (A) TEM images, (B) particle size distribution, and (C) XRD analysis of PbS QDs; (D) TEM image and (E) DLS analysis of PbS–MPA QDs; FT-IR analysis of (F) PbS and (G) PbS–MPA QDs. The measurements were performed with toluene-dispersed PbS and PBS-dispersed PbS–MPA.
Abbreviations: PbS, lead sulfide; MPA, 3-mercaptopropionic acid; TEM, transmission electron microscopy; XRD, X-ray diffraction; DLS, dynamic light scattering; QDs, quantum dots; FT-IR, Fourier transform infrared.
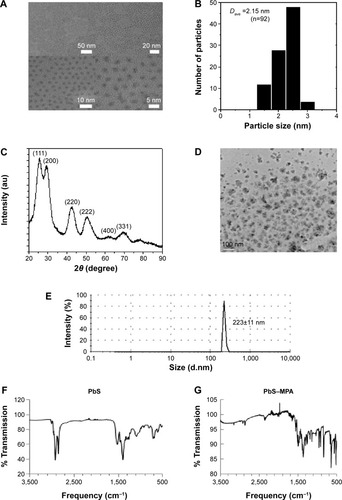
Immobilization of MPA on the PbS QDs was confirmed by FT-IR analysis. As shown in , the conventional spectrum of the PbS QDs was similar to that reported in a previous study.Citation25 Ligand exchange from oleic acid to MPA on the PbS QD surface was clearly observed (). After MPA treatment, the intensities of the peaks for C–H stretching vibrations (2,924 cm−1 and 2,857 cm−1) were decreased dramatically due to the removal of 1-oleic acid, which has a long hydrocarbon chain, from the surface of the prepared PbS QDs and its replacement with MPA, which has a short hydrocarbon chain. The –SH moiety signal was not detectable by FT-IR. Similar FT-IR analysis results have been reported previously using QDs with surfaces modified by MPA.Citation26
Cytotoxicity of PbS–MPA
Following exposure of HEK293 cells to 2 µg/mL, 6 µg/mL, 25 µg/mL, 100 µg/mL, and 400 µg/mL PbS–MPA, cell proliferation was decreased to 97%, 85%, 63%, 38%, and 38%, respectively, compared with that of the control cells (). The IC50 of PbS–MPA was 43 µg/mL. The cytotoxicity for human monocytic THP-1 cells was tested to provide data for toxicity in circulating cells in human bloodstream. For comparison, cell proliferation following exposure of mouse TCMK-1 and AML12 cells to PbS–MPA was also measured. PbS–MPA was cytotoxic to TCMK-1 and THP-1 cells at a concentration of 150 µg/mL (). The IC50 values of PbS–MPA in TCMK-1 and THP-1 cells were 127 µg/mL and 132 µg/mL, respectively. In contrast to the human-originated cells, the AML12 mouse cell line was not affected by PbS–MPA QDs at concentrations as high as 150 µg/mL ().
Figure 2 Cytotoxicity of PbS–MPA for human and mouse cell lines.
Notes: Results of Cell Counting Kit-8 (CCK-8) assays conducted to determine growth inhibition by PbS–MPA QDs are shown for (A) HEK293 cells and for (B) TCMK-1, THP-1, and AML12 cells.
Abbreviations: PbS–MPA, lead sulfide–3-mercaptopropionic acid; QDs, quantum dots.

The PbS–MPA QDs prepared in this study induced severe cytotoxic responses in HEK293 cells compared to those reported in several previous studies using PbS nanoparticles, although the results could not be compared directly due to the divergent physicochemical properties of the tested particles and differences in test methods. The IC50 value of PbS nanodendrite in Saccharomyces cerevisiae was 708 µg/mL.Citation27 In embryonic zebrafish, 3-mercaptopropanesulfonate coated PbS nanoparticles caused 20% cell mortality at a concentration of 10 µg/mL and 100% cell mortality at a concentration of 160 µg/mL.Citation15 The mortality of Panc-1 cells treated with PEGylated phospholipid micelle-encapsulated PbS QDs at a concentration of 250 µg/mL was 20% of that of control cells.Citation12
Isolation and characterization of exosomes secreted from HEK293 cells
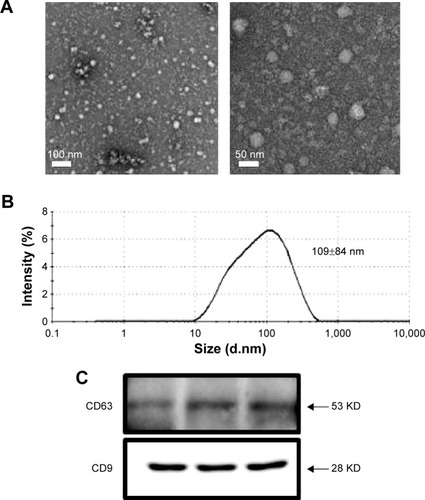
Exosomes were isolated from the culture media of HEK293 cells after they were exposed to PbS–MPA QDs at concentrations of 0 µg/mL, 5 µg/mL, and 50 µg/mL. The isolated exosomes were analyzed by TEM in order to study their morphology. The majority of the exosomes were observed in nanosized vesicles (). The image analysis indicated that the size distribution of the nanosized vesicles was nearly monodispersed and determined to be 28±3 nm (n=50). However, DLS provided a relative size distribution of the particles between 10 nm and 500 nm, and the hydrodynamic diameter was determined to be 109±84 nm (). A strong peak at 109 nm was attributed to exosomes released by the cells, but the smaller particle distribution around 10 nm was attributed to proteins. Peaks in the range of hundreds of nanometers were attributed to microvesicles. This result was comparable to that of a previous report on exosomes secreted from HEK293 cells (average hydrodynamic diameter of 70–80 nm in DLS).Citation28 Western blotting analysis for the representative exosomal biomarkers CD63 and CD9Citation29,Citation30 confirmed that the isolated vesicles were enriched in the exosomal fraction.
Figure 3 Properties of exosomes secreted form HEK293 cells.
Notes: (A) Bio-TEM images, (B) DLS analysis, and (C) expression of molecular markers of exosomes secreted from HEK293 cells.
Abbreviations: TEM, transmission electron microscopy; DLS, dynamic light scattering.
miRNA expression in exosomes
To determine specific biomarkers that are up- or downregulated by PbS–MPA QDs, expression levels of 380 human miRNAs frequently found in cells were measured by real-time qPCR analysis, using a human exosomal miRNA profiling kit provided by System Bioscience.Citation31,Citation32
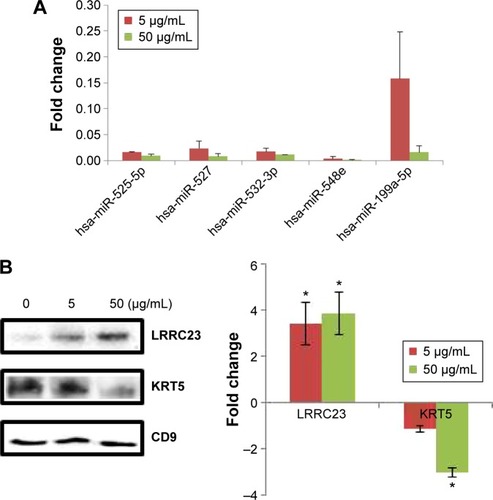
The criteria for biomarker selection were 1) dose dependent increase or decrease following PbS–MPA treatment at 5 µg/mL and 50 µg/mL, 2) a change in expression of at least more than threefold following treatment with 50 µg/mL PbS–MPA QDs (in comparison with the untreated control sample), and 3) a statistically significant change in expression level in comparison with that of control sample (P<0.05). Five miRNAs, hsa-miR-525-5p, hsa-miR-527, hsa-miR-532-3p, hsa-miR-548e, and hsa-miR-199a-5p, met the criteria and were proposed as exosomal biomarkers of exposure of HEK293 cells to PbS–MPA. shows the fold changes of the miRNA biomarkers for PbS–MPA QD exposure. All of the identified miRNA markers were down-regulated by PbS–MPA exposure in comparison to the control sample (2−ΔΔCt), with fold changes of 8.3×10⁻⁴–1.6×10⁻¹.
Figure 4 Fold changes of exosomal biomarkers for PbS–MPA exposure to HEK293 cells.
Notes: (A) Fold changes of miRNA biomarkers determined by qPCR. (B) Fold changes of protein biomarkers selected by 2D PAGE and PMF were measured by Western blotting. *P<0.05.
Abbreviations: PbS–MPA, lead sulfide–3-mercaptopropionic acid; qPCR, quantitative real-time polymerase chain reaction; 2D PAGE, two-dimensional polyacrylamide gel electrophoresis; PMF, peptide map fingerprint; LRRC23, leucine-rich repeat-containing protein 23; KRT5, keratin 5.
To identify comprehensively the pathways and functions that might be affected by changes in the identified biomarkers, the biomarkers were analyzed using Ingenuity Pathway Analysis.Citation33 As shown in , organismal injury and abnormalities, reproductive system disease, and cancer were identified as the most relevant diseases and disorders for the miRNA biomarkers of PbS–MPA exposure. Based on the pathway analysis, we focused on the carcinogenetic function of the miRNAs decreased owing to PbS–MPA exposure. The representative functions of miRNAs related to carcinogenesis are summarized in . Most miRNAs proposed as PbS–MPA biomarkers have been reported to suppress expression of target mRNAs, leading to enhancement of cancer progression (miR-525-5p,Citation34 miR-527,Citation35 miR-548e,Citation36 and miR-199a-5pCitation37). It has been shown that miRNAs generally are downregulated in cancer,Citation38 and tumor cells often have reduced levels of mature miRNAs as a consequence of genetic loss, epigenetic silencing, defects in synthesis pathways, or widespread transcriptional repression.Citation39,Citation40 The results indicated that PbS–MPA-exposed cells secreted exosomes with reduced levels of cancer-suppressive miRNAs in the extracellular matrix.
Table 1 List of miRNA biomarkers and their cancer-related functions
Proteome analysis in exosomes
The proteomes of the exosomes from the PbS–MPA QD-exposed HEK293 cells were analyzed with MALDI-TOF mass spectrometry following 2D SDS-PAGE. The 2D SDS-PAGE showed that levels of 121 proteins (identified as spots on the gel) were increased or decreased more than twofold in exosomes from cells exposed to 5 µg/mL and 50 µg/mL PbS–MPA QDs. Among these proteins, 29 were selected for MALDI-TOF mass spectrometry analysis to identify the proteins according to the following criteria: 1) concentration-dependent changes following treatment with 5 µg/mL and 50 µg/mL PbS–MPA QDs and 2) changes greater than threefold following treatment with 50 µg/mL PbS–MPA QDs (in comparison with the untreated control sample). shows the 29 spots in the 2D gels, in which 19 proteins showed concentration-dependent increases in expression and ten proteins showed concentration-dependent decreases in expression.
The 29 spots were excised from the gels and analyzed by mass spectroscopy to identify the proteins via PMF. Three proteins were matched with the MASCOT database for the PMF results and identified as leucine-rich repeat-containing protein 23, gi|5901898 (LRRC23), keratin 5, gi|119617038 (KRT5), and albumin-like protein (gi|763431). A separate Western blotting analysis for these proteins to measure LRRC23 (increased expression) and KRT5 (decreased expression) expression in exosomes confirmed the results of the proteome screening by 2D SDS-PAGE and MALDI-TOF (). Therefore, LRRC23 and KRT5 were proposed as exosomal protein biomarkers for PbS–MPA QD exposure. lists the known functions of LRRC23 and KRT5 with regard to cancer progression. LRRC23 expression increases in breast cancer,Citation41 and KRT5 has been reported as a biomarker for various cancer types, including lung and breast cancers.Citation42,Citation43 Similar to the miRNAs, the protein biomarkers for PbS–MPA QD exposure also were related to carcinogenesis.
Table 2 Cancer-related biological functions of protein biomarkers
DNA damage caused by PbS–MPA QDs in HEK293 cells
Because cellular DNA damage is an indicator of carcinogen exposure,Citation44 the comet assay (single-cell alkaline gel electrophoresis), which measures single- and double-strand breaks of DNA, was performed to support carcinogenic activity.Citation45–Citation47 The intensity of the comet tail relative to the head reflects the number of DNA breaks in a particular cell.Citation48
Long comet tails extending toward the anode were observed for cells exposed to 5 µg/mL PbS–MPA QDs, which was attributed to DNA strand breakage and loss of supercoiled structure (). Positive control cells were exposed to ultraviolet irradiation (0.1 J/cm2) for 10 minutes to induce DNA damage. The cells exposed to 50 µg/mL PbS–MPA QDs showed a level of DNA damage similar to that of the positive control cells, as indicated by DNA adduct smears that surrounded the cells. To determine the extent of DNA damage by manual scoring, 50 randomly selected comets from each gel were classified according to the relative intensity of fluorescence in the tail.Citation49 The comet tails were scored from 0 to 3, indicating undamaged (0 value) to maximally damaged (3 value) cells (). As shown in , the average scores increased with the PbS–MPA concentration in treated HEK293 cells.
Figure 5 Comet assay and biomarker expression analysis for PbS–MPA-exposed cells.
Notes: (A) Comet assay for measuring DNA damage in cells incubated with PbS–MPA QDs, (B) the criteria for scoring the comet assay results, and (C) the average score of tailing for each sample. (D) mRNA expression as measured by qPCR analysis for p53, IL-8, and CXCL5 (**P<0.01; ***P<0.001).
Abbreviations: PbS–MPA, lead sulfide–3-mercaptopropionic acid; QDs, quantum dots; qPCR, quantitative real-time polymerase chain reaction; IL-8, interleukin-8; CXCL5, C-X-C motif chemokine 5.
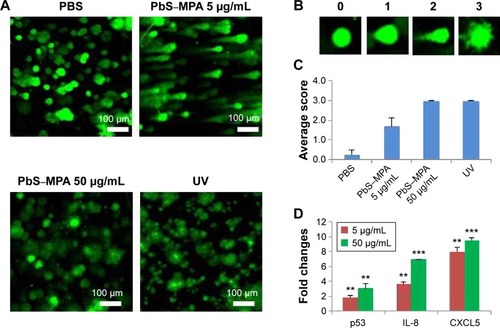
To support the comet assay results, expression of p53, interleukin (IL)-8, and C-X-C motif chemokine 5 (CXCL5) (DNA damage-related biomarkers) were analyzed by qPCR. Pathways involved in DNA damage response can activate p53 for cell cycle arrest, which can be transient or permanent.Citation50 If the p53 damage response pathway fails to protect against DNA damage, cancer progression will occur.Citation51 Therefore, p53 is increased upon DNA damage, and combination of the comet assay with detection of molecular markers, such as p53, offers a comprehensive approach for the assessment of DNA damage in vitro.Citation52
IL-8 expression has been reported to be increased by DNA strand breaksCitation53 and in renal cancer.Citation54 CXCL5 is known to be increased in renal cell carcinoma patients, and this change in CXCL5 expression is accompanied by DNA fragmentation.Citation55,Citation56 In this study, p53, IL-8, and CXCL5 mRNA expression levels in HEK293 cells were increased significantly by PbS–MPA QDs (). These results suggested that PbS–MPA QDs could have carcinogenic activity related to deficient DNA repair, as indicated by the comet assay and molecular expression related to DNA damage.
Signal intensification in exosomal biomarker expression signals
The expression levels of exosomal biomarkers specific to PbS–MPA exposure were analyzed in the parent cell extracts and compared with those of the exosomal extracts to calculate the level of signal intensification that occurred in the exosomes. Cellular levels of hsa-miR-532-3p and hsa-miR-548e were decreased significantly in HEK293 cells exposed to 5 µg/mL and 50 µg/mL PbS–MPA QDs (). However, hsa-miR-525-5p expression was decreased significantly only following exposure to 50 µg/mL PbS–MPA QDs, and hsa-miR-199a-5p expression was not changed significantly following exposure to 5 µg/mL and 50 µg/mL PbS–MPA QDs. miR-527 was not detected in the parent cell extracts, including the control sample. These results indicated that the molecular signatures of the identified biomarkers were exosome specific and, thus, would not be measurable using conventional approaches involving cellular screening. Significant differences in miRNA expression profiles were previously reported between human cancer cells and the secreted exosomes.Citation57
Figure 6 Expression of exosomal biomarkers in parent HEK293 cells.
Notes: (A) Fold changes of selected miRNAs in parent cells caused by PbS–MPA (*P<0.05). (B) Signal intensification for exosomal miRNA levels compared with those of parent cells. Signal intensification was calculated by the ratio of cellular to exosomal fold changes. (C) Fold changes of selected proteins in parent cells caused by PbS–MPA (*P<0.05). (D) Signal intensification for exosomal protein levels compared with those of parent cells. Because the fold change of KRT5 in exosomes was reverse to that of cellular changes, the ratio was expressed as a negative value.
Abbreviations: PbS–MPA, lead sulfide–3-mercaptopropionic acid; KRT5, keratin 5; LRRC23, leucine-rich repeat-containing protein 23.
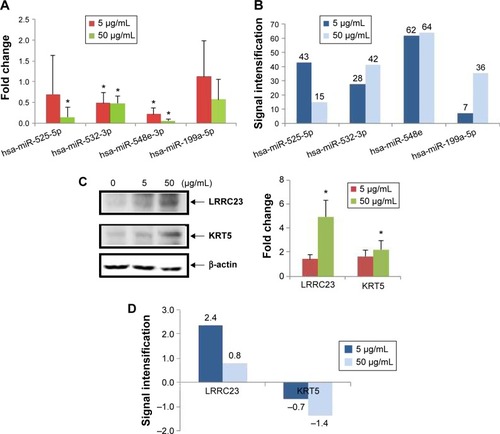
When the fold changes of miRNA expression caused by PbS–MPA QDs in the exosomes and parent cells were compared, the signal intensification was calculated as 7–64-fold (ratio of cellular/exosomal fold changes from the data shown in and ) following exposure to 5 µg/mL and 50 µg/mL PbS–MPA (). This result was attributed to the observation that the exosomal fold changes of miRNAs were decreased greater than that of cellular extracts, indicating that the exosomal signal would be more sensitive for detection of toxicological effects by exposure to PbS–MPA QDs.
shows the cellular levels of protein biomarkers. LRRC23 expression in parent cells was similar to its expression in exosomes following exposure to 5 µg/mL and 50 µg/mL PbS–MPA, but KRT5 expression in parent cells was increased by exposure to PbS–MPA QDs, which was opposite to the change in exosomal levels of KRT5 (). KRT5 levels increase in cancerous cells and, thus, it is accepted as a positive biomarker of cancer progression.Citation41 Although KRT5 was selected as a biomarker via exosomal screening, its expression level in exosomes was not positively correlated with its cellular expression level. Previous reports have shown that changes in protein expression levels in exosomes do not always correspond with changes in the expression levels in their parent cells.Citation58 Because of the limited information available on exosome biogenesis and regulation of exosomal composition,Citation59,Citation60 specific mechanisms responsible for differences in biomarker levels could not be explained, but it is known that exosomal content is highly regulated.Citation61 Our results implied that increased KRT5 expression in cells might be required for cellular function, but not for transfer to recipient cells.
shows the signal intensification of protein biomarkers in exosomes compared to their parent cells (ratio of exosomal/cellular fold changes from the data shown in and ). The fold change of LRRC23 expression was 2.4 times higher in exosomes following exposure to 5 µg/mL PbS–MPA QDs. The KRT5 showed downregulation in exosomes in contrast to upregulation in parent cells; thus, the signal intensification was expressed in negative values. In considering the absolute value for signal intensification in exosomes, the fold change of KRT5 was 1.4 times higher in exosomes than that of parent cells following exposure to 50 µg/mL PbS–MPA QDs.
Discussion
Lead-based nanoparticle toxicity has been studied widely in recent years because these nanoparticles offer an excellent platform for theragnostic applications via coloading of hydrophobic drugs in the micelle core.Citation62 The purpose of our study was to comprehensively evaluate PbS–MPA-induced toxicity in human cells by means of exosomal biomarkers. In this study, the miRNA and protein expression signatures in exosomes primarily indicated the possibility of carcinogenic activity of the particles, and this finding was supported by single-cell assays for DNA damage and qPCR analysis of molecular markers for deficient DNA repair, including p53, IL-8, and CXCL5.
Several reports have found that nanomaterials induce carcinogenesis. Zinc oxide nanoparticles induced epithelial hyperplasia of terminal bronchioles in rats.Citation63 Multiwalled carbon nanotubes showed mesotheliomagenicity in rats.Citation64 Exposure to single-walled carbon nanotubes has been associated with an increased risk of human lung cancer owing to the effects of chronic exposure on human lung epithelial cells.Citation65 Cobalt nanoparticles increased carcinogenic risk following long-term exposure.Citation66 Based on these previous studies and our results, carcinogenic activity should be given more importance while evaluating nanomaterial toxicity.
Exosomes are thought to be attractive sources to assess biological response induced by exogenous materials, because they are actively released from stressed cells to mediate cell-to-cell communication,Citation8 convey information regarding cellular state,Citation67 are highly stable in biofluids,Citation68 and are enriched with pathological biomarkers.Citation69 For example, metastatic factors are found in exosomes from several types of cancer cells, including human isogenic colorectal cells,Citation69 breast cancer cells,Citation70 and prostate cancer cells.Citation71 Recent studies demonstrate that exosome contents can be important indicators of in vivo pathogenesis.Citation72 Hence, exosomal screening was applied to identify the biological response of HEK293 cells to PbS QD exposure.
An additional advantage of the exosome-based approach in biomarker studies is the intensification of expression signals in comparison with those of parent cells, as shown in . The signal intensification measured by the ratio of fold changes in miRNA expression in cells to exosomes indicated that the exosomal response would be more sensitive than that of whole cells in miRNA screening, because the exosomal fraction is a narrower, but more specific, screening target pool to detect potential biomarkers. Intensification of miRNA expression signals has been reported in several recent studies.Citation73–Citation75 However, the exosomal intensification effect on protein biomarkers was not as significant as its effect on miRNAs in this study. Further study is needed on the mechanism of miRNA and protein compartmentation into exosomes to explain the significant reduction of signal intensification of proteins compared to that of miRNAs.
Conclusion
Toxicological effects of synthesized nanomaterials are important issues to determine where they can be used or not. PbS QDs have prominent potential for biomedical applications; however, the information on their toxicological effects has been limited. In this study, PbS QDs induced changes of molecular markers for carcinogenesis, and DNA damages accordingly. Together, it was proposed that PbS QDs have carcinogenic activity for human kidney cells. These results implied that the toxicity issues should be considered in the development of PbS QDs for biomedical applications.
Based on the biogenic and functional properties of exosomes, the molecular changes in exosomes could provide more significant and effective information on cellular response than those in whole cells. Our results supported this assumption: the proposed pathway induced by PbS QDs based on exosomal biomarkers was identified in the parent cells, and the signal intensification of miRNA expression was inherent to exosomes.
Exosomes are noninvasive biomarkers providing a new paradigm of molecular marker studies, which make possible to monitor the signaling molecules in circulating system by time-series analysis for the same animal or human body. To the best of our knowledge, this is the first in-depth study of exosomal miRNA/protein for toxicological evaluation. It will serve as a starting point to use exosomes for comprehensive screening and prediction of pathological toxicity caused by newly synthesized nanomaterials with various morphology and function.
Acknowledgments
This study was supported in part by the Ministry of Science, ICT, and Future Planning of the Republic of Korea (DGIST Basic Research Fund 15-NB-01 and 15-BD-0404). This research was supported also by the Basic Science Research Program through the National Research Foundation of Korea (NRF) funded by the Ministry of Science, ICT, and Future Planning (NRF-2013R1A1A1008678). We are thankful to the DGIST Center for Core Research Facilities for providing aid with the TEM and XRD experiments. We also are thankful to the Korea Basic Science Institute (KBSI) for providing technical assistance on the operation of Bio-TEM and the Ultra microtome.
Supplementary materials
Figure S1 Selected protein spots for PMF analysis according to selection criteria.
Notes: (A) Nineteen spots were increased and (B) ten spots were decreased by exposure to PbS–MPA QDs.
Abbreviations: PMF, peptide map fingerprint; PbS–MPA QDs, lead sulfide–3-mercaptopropionic acid quantum dots.
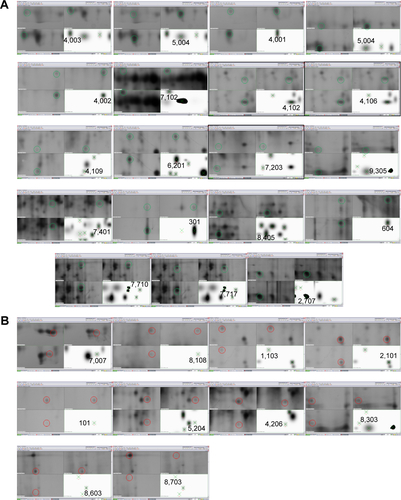
Table S1 Functional analysis of miRNA biomarkers by ingenuity pathway analysis (IPA) analysis
Disclosure
The authors report no conflicts of interest in this work.
References
- SimonDFDomingosRFHauserCHutchinsCMZergesWWilkinsonKJTranscriptome sequencing (RNA-seq) analysis of the effects of metal nanoparticle exposure on the transcriptome of Chlamydomonas reinhardtiiAppl Environ Microbiol2013794774478523728819
- KimEChuYCHanJYProteomic analysis of silver nanoparticle toxicity in ratToxicol Environ Health Sci20102251262
- NanboAKawanishiEYoshidaRYoshiyamaHExosomes derived from epstein-barr virus-infected cells are internalized via caveola-dependent endocytosis and promote phenotypic modulation in target cellsJ Virol201387103341034723864627
- GhossoubRLemboFRubioASyntenin-ALIX exosome biogenesis and budding into multivesicular bodies are controlled by ARF6 and PLD2Nat Commun201453477348824637612
- KogureTLinWLYanIKBraconiCPatelTIntercellular nanovesicle-mediated microRNA transfer: a mechanism of environmental modulation of hepatocellular cancer cell growthHepatology2011541237124821721029
- Conde-VancellsJFalcon-PerezJMIsolation of urinary exosomes from animal models to unravel noninvasive disease biomarkersMethods Mol Biol201290932134022903725
- KellerSRidingerJRuppAKJanssenJWAltevogtPBody fluid derived exosomes as a novel template for clinical diagnosticsJ Transl Med20119869421651777
- EldhMEkströmKValadiHExosomes communicate protective messages during oxidative stress; possible role of exosomal shuttle RNAPLoS One20105e1535321179422
- KobayashiMSalomonCTapiaJIllanesSEMitchellMDRiceGEOvarian cancer cell invasiveness is associated with discordant exosomal sequestration of Let-7 miRNA and miR-200J Transl Med20141241524393345
- BhuniaAKSamantaPKSahaSKamilyaTSafety concerns towards the biomedical application of PbS nanoparticles: an approach through protein-PbS interaction and corona formationAppl Phys Lett2014104123703
- BradshawTDJunorMPatanèAApoferritin-encapsulated PbS quantum dots significantly inhibit growth of colorectal carcinoma cellsJ Mater Chem B2013162546260
- HuRLawWCLinGPEGylated phospholipid micelle-encapsulated near-infrared PbS quantum dots for in vitro and in vivo bioimagingTheranostics2012272373322896774
- ChoiAOBrownSESzyfMMaysingerDQuantum dot-induced epigenetic and genotoxic changes in human breast cancer cellsJ Mol Med20088629130217965848
- FangMPengCWPangDWLiYQuantum dots for cancer research: current status, remaining issues, and future perspectivesCancer Biol Med2012915116323691472
- TruongLMoodyISStankusDPNasonJALonerganMCTanguayRLDifferential stability of lead sulfide nanoparticles influences biological responses in embryonic zebrafishArch Toxicol20118578779821140132
- MoodyISStonasARLonerganMCPbS nanocrystals functionalized with a short-chain, ionic, dithiol ligandJ Phys Chem C20081121938319389
- MurciaMJShawDLLongECNaumannCAFluorescence correlation spectroscopy of CdSe/ZnS quantum dot optical bioimaging probes with ultra-thin biocompatible coatingsOpt Commun20082811771178019572039
- ZhaoFQCraigRCapturing time-resolved changes in molecular structure by negative stainingJ Struct Biol2003141435212576019
- LivakKJSchmittgenTDAnalysis of relative gene expression data using real-time quantitative PCR and the 22DDCT methodMethods20012540240811846609
- OakleyBRKirschDRMorrisNRA simplified ultrasensitive silver stain for detecting proteins in polyacrylamide gelsAnal Biochem19801053613636161559
- ShevchenkoAWilmMVormOMannMMass spectrometric sequencing of proteins from silver-stained polyacrylamide gelsAnal Chem1996688508588779443
- LaemmliUKCleavage of structural proteins during the assembly of the head of bacteriophage T4Nature19702276806855432063
- AkhtarJMalikMAO’BrienPA greener route to photoelectrochemically active PbS nanoparticlesJ Mater Chem20102023362344
- ZhangYClappAOverview of stabilizing ligands for biocompatible quantum dot nanocrystalsSensors201111110361105522247651
- KimSImSHKangMAir-stable and efficient inorganic–organic heterojunction solar cells using PbS colloidal quantum dots co-capped by 1-dodecanethiol and oleic acidPhys Chem Chem Phys201214149991500223034567
- FuWShiYQiuWHigh efficiency hybrid solar cells using post-deposition ligand exchange by monothiolsPhys Chem Chem Phys201214120941209822868689
- YuQSunMWangYLiMLiuLThe interaction between lead sulfide nanodendrites and Saccharomyce cerevisiae is involved in nanotoxicityRSC Adv201442037120378
- GodaTMasunoKNishidaJA Label-free electrical detection of exosomal microRNAs using microelectrode arrayChem Commun2012481194211944
- CabyMPLankarDVincendeau-ScherrerCRaposoGBonnerotCExosomal-like vesicles are present in human blood plasmaInt Immunol20051787988715908444
- JørgensenMBækRPedersenSSøndergaardEKKristensenSRVarmingKExtracellular vesicle (EV) array: microarray capturing of exosomes and other extracellular vesicles for multiplexed phenotypingJ Extracell Vesicles201322092020928
- SuryawanshiSVladAMLinHMPlasma microRNAs as novel biomarkers for endometriosis and endometriosis-associated ovarian cancerClin Cancer Res2013191213122423362326
- VirtsELThomanMLAge-associated changes in miRNA expression profiles in thymopoiesisMech Ageing Dev201013174374820934450
- Ingenuity Pathway AnalysisRedwood CityQiagen2014 Available from: www.qiagen.com/ingenuityAccessed October 3, 2014
- HuangYSDaiYYuXFMicroarray analysis of microRNA expression in hepatocellular carcinoma and nontumorous tissues without viral hepatitisJ Gastroenterol Hepatol200823879418171346
- SlabyOSvobodaMMichalekJVyzulaRMicroRNAs in colorectal cancer: translation of molecular biology into clinical applicationMol Cancer2009810211419912656
- LinMChenWHuangJMicroRNA expression profiles in human colorectal cancers with liver metastasesOncol Rep20112573977347
- LeeJMHeoMJLeeCGYangYMKimSGIncrease of miR-199a-5p by protoporphyrin IX, a photocatalyzer, directly inhibits E2F3, sensitizing mesenchymal tumor cells to anti-cancer agentsOncotarget201563918393125714015
- JanssonMDLundAHMicroRNA and cancerMol Oncol2012659061023102669
- LuJGetzGMiskaEAMicroRNA expression profiles classify human cancersNature200543583483815944708
- ChangTCYuDLeeYSWidespread microRNA repression by Myc contributes to tumorigenesisNat Genet200840435018066065
- AdélaïdeJFinettiPBekhoucheIIntegrated profiling of basal and luminal breast cancersCancer Res2007671156518089785
- CominCENovelliLCavazzaARotelliniMCianchiFMesseriniLExpression of thrombomodulin, calretinin, cytokeratin 5/6, D2-40 and WT-1 in a series of primary carcinomas of the lung: an immunohistochemical study in comparison with epithelioid pleural mesotheliomaTumori201410055956725343553
- HousemanEAInceTANormal cell-type epigenetics and breast cancer classification: a case study of cell mixture-adjusted analysis of DNA methylation data from tumorsCancer Inform201413suppl 4536425574126
- AndersonDYuTWMcGregorDBComet assay responses as indicators of carcinogen exposureMutagenesis1998135395559862185
- OlivePLBanáthJPThe comet assay: a method to measure DNA damage in individual cellsNat Protoc20061232917406208
- SmithTRMillerMSLohmanKKCaseLDHuJJDNA damage and breast cancer riskCarcinogenesis20032488388912771032
- MoktarARavooriSVadhanamMVGairolaCGGuptaRCCigarette smoke-induced DNA damage and repair detected by the comet assay in HPV-transformed cervical cellsInt J Oncol2009351297130419885552
- CollinsARThe comet assay for DNA damage and repairMol Biotechnol20042624926115004294
- KlaggeAWeidingerCKrauseKJessnitzerBGutknechtMFuhrerDThe role of FOXO3 in DNA damage response in thyrocytesEndocr Relat Cancer20111855556421712344
- MombachJCMBugsCAChaouiyaCModelling the onset of senescence at the G1/S cell cycle checkpointBMC Genomics201415suppl 7S725573782
- LakinNDJacksonSPRegulation of p53 in response to DNA damageOncogene1999187644765510618704
- MarrotLBelaïdiJPMeunierJRComet assay combined with p53 detection as a sensitive approach for DNA photoprotection assessment in vitroExp Dermatol200211suppl 1333612444957
- MarczynskiBRaulf-HeimsothMPeschBDetection of DNA strand breaks by comet assay in sputum leucocytes of bitumen-exposed workers: a pilot studyHum Exp Toxicol20102972172920133338
- BiLKZhouNLiuCKidney cancer cells secrete IL-8 to activate Akt and promote migration of mesenchymal stem cellsUrol Oncol20143260761224412633
- AddisonCLBelperioJABurdickMDStrieterRMOverexpression of the duffy antigen receptor for chemokines (DARC) by NSCLC tumor cells results in increased tumor necrosisBMC Cancer200442815214968
- MestasJBurdickMDReckampKPantuckAFiglinRAStrieterRMThe role of CXCR2/CXCR2 ligand biological axis in renal cell carcinomaJ Immunol20051755351535716210641
- LiaoJLiuRYinLPuYExpression profiling of exosomal miRNAs derived from human esophageal cancer cells by solexa high-throughput sequencingInt J Mol Sci201415155301555125184951
- WebberJStoneTCKatiliusEProteomics analysis of cancer exosomes using a novel modified aptamer-based array (SOMAscanTM) platformMol Cell Proteomics2014131050106424505114
- SavinaAFaderCMDamianiMTColomboMIRab11 promotes docking and fusion of multivesicular bodies in a calcium-dependent mannerTraffic2005613114315634213
- HsuCMorohashiYYoshimuraSIRegulation of exosome secretion by Rab35 and its GTPase-activating proteins TBC1D10A-CJ Cell Biol201018922323220404108
- BraicuCTomuleasaCMonroigPCucuianuABerindan-NeagoeICalinGAExosomes as divine messengers: are they the Hermes of modern molecular oncology?Cell Death Differ201522344525236394
- TanTTSelvanSTZhaoLGaoSYingJYSize control, shape evolution, and silica coating of near-infrared-emitting PbSe quantum dotsChem Mater20071931123117
- XuJFutakuchiMAlexanderDBNanosized zinc oxide particles do not promote DHPN-induced lung carcinogenesis but cause reversible epithelial hyperplasia of terminal bronchiolesArch Toxicol201488657523832296
- NagaiHOkazakiYChewSHDiameter and rigidity of multi-walled carbon nanotubes are critical factors in mesothelial injury and carcinogenesisProc Natl Acad Sci U S A2011108E1330E133822084097
- LuanpitpongSWangLCastranovaVRojanasakulYInduction of stem-like cells with malignant properties by chronic exposure of human lung epithelial cells to single-walled carbon nanotubesPart Fibre Toxicol201411223924885671
- AnnangiBBachJValesGRubioLMarcosRHernandezALong-term exposures to low doses of cobalt nanoparticles induce cell transformation enhanced by oxidative damageNanotoxicology2015913814724713074
- MontecalvoALarreginaATShufeskyWJMechanism of transfer of functional microRNAs between mouse dendritic cells via exosomesBlood2012975676622031862
- ChengLSharplesRASciclunaBJHillAFExosomes provide a protective and enriched source of miRNA for biomarker profiling compared to intracellular and cell-free bloodJ Extracell Vesicles201432374323755
- JiHGreeningDWBarnesTWProteome profiling of exosomes derived from human primary and metastatic colorectal cancer cells reveal differential expression of key metastatic factors and signal transduction componentsProteomics2013131672168623585443
- KrugerSElmageedZYAHawkeDHMolecular characterization of exosome-like vesicles from breast cancer cellsBMC Cancer2014144424468161
- DuijveszDBurnum-JohnsonKEGritsenkoMAProteomic profiling of exosomes leads to the identification of novel biomarkers for prostate cancerPLoS One20138e8258924391718
- JiHChenMGreeningDWDeep sequencing of RNA from three different extracellular vesicle (EV) subtypes released from the human LIM1863 colon cancer cell line uncovers distinct mirna-enrichment signaturesPLoS One20149e11031425330373
- LvLLCaoYLiuDIsolation and quantification of microRNAs from urinary exosomes/microvesicles for biomarker discoveryInt J Biol Sci201391021103124250247
- Villarroya-BeltriCGutiérrez-VázquezCSánchez-CaboFSumoylated hnRNPA2B1 controls the sorting of miRNAs into exosomes through binding to specific motifsNat Commun201342980298324356509
- MadhavanBYueSGalliUCombined evaluation of a panel of protein and miRNA serum-exosome biomarkers for pancreatic cancer diagnosis increases sensitivity and specificityInt J Cancer20151362616262725388097