
 ?Mathematical formulae have been encoded as MathML and are displayed in this HTML version using MathJax in order to improve their display. Uncheck the box to turn MathJax off. This feature requires Javascript. Click on a formula to zoom.
Abstract
Combining the concept of magnetic drug targeting and photodynamic therapy is a promising approach for the treatment of cancer. A high selectivity as well as significant fewer side effects can be achieved by this method, since the therapeutic treatment only takes place in the area where accumulation of the particles by an external electromagnet and radiation by a laser system overlap. In this article, a novel hypericin-bearing drug delivery system has been developed by synthesis of superparamagnetic iron oxide nanoparticles (SPIONs) with a hypericin-linked functionalized dextran coating. For that, sterically stabilized dextran-coated SPIONs were produced by coprecipitation and crosslinking with epichlorohydrin to enhance stability. Carboxymethylation of the dextran shell provided a functionalized platform for linking hypericin via glutaraldehyde. Particle sizes obtained by dynamic light scattering were in a range of 55–85 nm, whereas investigation of single magnetite or maghemite particle diameter was performed by transmission electron microscopy and X-ray diffraction and resulted in approximately 4.5–5.0 nm. Surface chemistry of those particles was evaluated by Fourier transform infrared spectroscopy and ζ potential measurements, indicating successful functionalization and dispersal stabilization due to a mixture of steric and electrostatic repulsion. Flow cytometry revealed no toxicity of pure nanoparticles as well as hypericin without exposure to light on Jurkat T-cells, whereas the combination of hypericin, alone or loaded on particles, with light-induced cell death in a concentration and exposure time-dependent manner due to the generation of reactive oxygen species. In conclusion, the combination of SPIONs’ targeting abilities with hypericin’s phototoxic properties represents a promising approach for merging magnetic drug targeting with photodynamic therapy for the treatment of cancer.
Introduction
One of the most promising approaches for cancer treatment in the last few years is magnetic drug targeting (MDT).Citation1–Citation3 In this concept, drug accumulation in the tumor can be achieved with a drug-loaded magnetic carrier system, which is physically directed to the region of interest by an external magnetic field.Citation4,Citation5 In comparison to conventional drug administration, this leads to an effective increase in the drug concentration in the affected tissue as well as a reduced drug concentration in the rest of the body.Citation6,Citation7 Thus, a decrease in systemic side effects, such as nausea, hair loss, or neurotoxicity, can be achieved.Citation8–Citation10
An interesting feature of MDT is that it can be combined with other cancer treatment strategies such as photodynamic therapy (PDT), to create an even more selective treatment. Magnetic particles that are commonly used for MDT are super-paramagnetic iron oxide nanoparticles (SPIONs), including magnetite (Fe3O4), maghemite (γ-Fe2O3), or other ferrites.Citation11–Citation13 They are biocompatible and have superparamagnetic characteristics depending on their size, which leads to an extensive use of these particles in bioseparation, hyperthermia, magnetic resonance imaging, and drug targeting.Citation6,Citation14–Citation19 SPIONs have a large surface-area-to-volume ratio, which is the reason why they tend to agglomerate in order to reduce their surface energy.Citation20 To prevent the particles from this behavior, we used dextran as a stabilizing agent. It is a biocompatible, biodegradable, and water-dispersible branched polysaccharide.Citation21,Citation22 Additionally, the hydroxyl groups of this polymer can be used to add various functionalities, which can then be further used to link the photosensitizer (PS), in our case, hypericin.Citation23
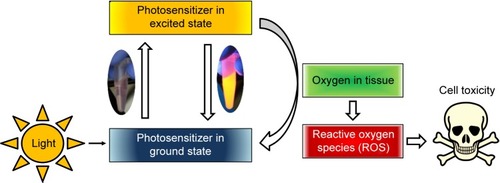
Hypericin, a naturally occurring PS, is an essential component of the plant Hypericum perforatum, also known as St John’s wort. Besides its natural extraction, hypericin can also be synthesized as described by Karioti and Bilia.Citation24 As a derivative of the anthraquinone, hypericin consists of aromatic rings that form a planar molecule. Its delocalized π-electron system is responsible for the photoactive behavior, which is used in PDT (). There, upon activation by light, PS transfers its energy to other molecules finally generating highly reactive oxygen species (ROS). In the vicinity of cell components, these intermediates cause biological damage by oxidation.Citation25 Usually, the PS such as hypericin is applied systemically, which leads to a high systemic photosensitivity accompanied by a high rate of discomfort to the patients. Hence, the combination of MDT with PDT can reduce this disadvantage and result in a high selectivity as well as significant fewer side effects, since the therapeutic treatment only takes place in the area where the accumulation of the particles due to the external magnet and the radiation by a laser system overlap.
Figure 1 Schematic representation of principle of photodynamic therapy: a photosensitizer is excited by an external light stimulus.
Note: This energy can be transferred to oxygen in tissue, which leads to the formation of reactive oxygen species, causing oxidation of cellular components (eg, proteins, lipids, and DNA) and finally cell death.
In this work, we describe a novel approach, where such a drug delivery vehicle is designed based on the combination of MDT and PDT.
Materials and methods
Materials
Chemicals for the iron oxide nanoparticles synthesis, acetic acid (water free), acetonitrile (HPLC gradient grade), ethanol (HPLC gradient grade), methanol (MeOH, HPLC gradient grade), MUSE count and viability assay kit, sodium dihy-drogen phosphate, as well as sterile and unsterile Rotilabo®-syringe filters with cellulose mixed ester membrane have been provided by Carl Roth (Karlsruhe, Germany) and Merck (Darmstadt, Germany), respectively.
Dextran from Leuconostoc spp. (molecular weight =6 kDa), epichlorohydrin (ECH), ammonium acetate, chloroacetic acid, 2′,7′-dichlorofluorescein diacetate (DCFH-DA), ethyl chloroformate, as well as phosphate buffered saline (PBS) were purchased from Sigma-Aldrich (Hamburg, Germany). Sulfosalicylic acid solution (20%) was obtained from AppliChem (Darmstadt, Germany). RPMI 1640 medium, F-12K medium, L-glutamine, Hoechst 33342 (Hoe), Annexin A5-Fitc (AxV), and hexamethylindodicarbocyanine iodide dye (DiI) were purchased from Thermo Fisher Scientific (Waltham, MA, USA). Hypericin was purchased from Alfa Aesar (Karlsruhe, Germany), and fetal calf serum (FCS) and L-glutamine from Biochrom (Berlin, Germany). Ringer’s solution containing 0.9% NaCl (w/v) was supplied by DeltaSelect (Rimbach, Germany). SPECTRA/POR® 6 dialysis tubing with a molecular weight cut-off (MWCO) of 10 kDa and a diameter of 29 mm was purchased from Serva Electrophoresis (Heidelberg, Germany). Vivaspin 20 ultrafiltration units with 100 kDa MWCO were supplied by Sartorius Stedim Biotech (Goettingen, Germany). Water used in all experiments was of bidistilled quality.
Preparation of functionalized dextran-coated SPIONs
Dextran-coated SPIONs (SPIONDEX) were synthesized in a cold gelation process, as described previously.Citation26 In brief, an aqueous solution containing 8.8% (w/w) dextran, 2.4% (w/w) FeCl3·6H2O, and 0.9% (w/w) FeCl2·4H2O was prepared and filtered through a 0.22-µm membrane into an ice-cooled three-neck round-bottomed flask. Under an argon atmosphere, the temperature was adjusted to 0°C–4°C. NH3 was added to the solution, which resulted in a green-brownish suspension. After heating the solution at 75°C, the formed particles were cooled and dialyzed against water (MWCO 10 kDa) to remove excess salts. Redundant dextran was removed afterward by ultrafiltration in a centrifuge 5430R (Eppendorf, Hamburg, Germany) with Vivaspin20 filter units at 6,300× g for 10 minutes for multiple runs. The dextran molecules of the SPION coating were crosslinked with ECH. In this reaction, the pH of the particles was adjusted to basic conditions with 5 M NaOH and then ECH was added to a final concentration of 15% (v/v). The suspension was stirred for 24 hours and then it was again dialyzed against water for 24 hours, followed by ultrafiltration and sterile filtration through 0.22 µm filters.
The dextran coating of the particles was functionalized with carboxylic acid groups according to Huynh et al.Citation23 Briefly, the pH of the suspension was adjusted to 12–13 with 5 M NaOH. After cooling the suspension, monochloroacetic acid was added and then it was heated to 60°C for 90 minutes, followed by neutralization with acetic acid. In the end, the particles were purified by dialysis against water and ultrafiltration. In the following, they are referred to as SPIONCMD.
The determination of the particles’ iron content was performed photometrically as described by Dokuzovic.Citation27
Linking of hypericin to functionalized SPIONs
Hypericin was covalently bound to SPIONCMD via glutaraldehyde (GA). First of all, a 1% GA solution was prepared by diluting a commercial 25% GA stock solution with 10 mM phosphate buffer solution, and the particulate suspension was buffered with 10 mM NaH2PO4. Buffered suspension (5 mL) was mixed with 838 µL 1% GA and stirred for 1 hour. Thereafter, an equal volume of hypericin (50 µg/mL in MeOH) was added and stirring was continued for further 23 hours. The resulting samples were dialyzed against water to remove excess GA.
For the removal of unbound hypericin from the samples, a method was developed, based on different solubility-behaviors of hypericin and SPIONCMD in alcoholic medium. While hypericin shows very good solubility in MeOH, SPIONCMD precipitates if MeOH content in the suspension is too high. Therefore, samples were diluted with MeOH until precipitation occurred and sedimentation was accelerated in a 5430R centrifuge at 7,200× g. As a result, SPIONCMD-Hyp deposited on the bottom and excess hypericin could be removed by decantation. The samples were refilled with MeOH to their original volume and dispersed by ultrasonification (ultrasonic finger Sonopuls, Bandelin, Germany) for 30 seconds, before they were centrifuged again at 7,200× g for 10 minutes. This step is repeated five times, until the supernatant becomes clear. Finally, the samples were resus-pended in water by ultrasonification (75 W for 30 seconds), which resulted in a stable colloid, and is referred to as SPIONCMD-Hyp.
Particle size and ζ potential measurement
The hydrodynamic size of the nanoparticles was acquired by dynamic laser scattering with a Nanophox (Sympatec, Clausthal-Zellerfeld, Germany) operated in cross-correlation mode. For the ζ potential measurements (Nanosizer ZS, Malvern Instruments, Herrenberg, Germany), which were performed at pH 7 and 25°C with a scattering angle of 90°, particles were dispersed in aqueous solutions. The experiments were performed in triplicates and, the results were averaged.
Fourier transform infrared spectroscopy
The chemical composition of lyophilized nanoparticle specimens was determined with the ALPHA FT-IR spectrometer (Bruker Corporation, Billerica, MA, USA). The spectra were collected in attenuated total reflection mode in the mid-infrared region from 4,000 to 400 cm−1, with a step size of 0.5 cm−1.
Determination of hypericin content
Prior to the determination of the hypericin content in drug-loaded samples, nanoparticles had to be dissolved in acidic conditions at 99°C. Then, quantification of hypericin was done by high-performance liquid chromatography (HPLC), combined with an electrospray-ionization mass spectrometer. As a stationary phase, an XBridge Shield RP18 column (Waters, Milford, MA, USA) with a particle size of 3.5 µm, an interior diameter of 3.0 mm, and a length of 100 mm was used at a temperature of 30°C. The mobile phase consisted of acetonitrile, MeOH, and 20 mM ammonium acetate in a volume ratio of 54:36:10 and was used with a flow rate of 1.0 mL/minute. The HPLC device was a Waters e2695 series and the mass spectrometer was a Waters Acquity SQ detector (both Milford, MA, USA), with a desolvation temperature of 450°C and detecting a mass-to-charge ratio of 503 in ESI(−)-mode. Based on the reference samples, a linear calibration curve can be achieved, showing the dependence of hypericin concentration as a function of peak area and thus can be used to calculate the hypericin content of the particulate specimens. All measurements were performed in triplicates and the results were averaged.
Transmission electron microscopy
Transmission electron microscopy (TEM) images were taken by a CM300 UltraTWIN transmission electron microscope (Philips, Eindhoven, the Netherlands) operating at 300 kV in imaging mode. Samples were prepared by drop cast of a 10 µL aliquot of a diluted nanoparticle solution, on an Athene® grid (Plano GmbH, Wetzlar, Germany). The size distribution is determined by examination of an overview TEM image with the software ImageJ (version 1.48; National Institutes of Health, Bethesda, MD, USA).
X-ray diffraction
In this study, a Siemens D500 (Bruker AXS Inc., Madison, WI, USA) X-ray diffraction (XRD) device is used to perform a θ/2θ-measurement in order to determine the inter-planar distances dhkl and therefore the crystallinity of the samples. Lyophilized particles were mounted onto a sample holder. The Cu Kα beam with the wavelength λ=0.15418 nm was used as an X-ray source and the angular range was 25°–70° with a step size of 0.02°/second and a dwell time of 1 second. Afterwards, the interplanar spacing was determined by Bragg’s law (1) and the lattice parameter a by EquationEquation 2(2) :
According to the Debye–Scherrer formula, the crystallite size dXRD for the sample is given by:
In vitro toxicity
Cell line and culture condition
The in vitro toxicity of free and particle-bound hypericin was investigated in the nonadherent human T-cell leukemia cell line Jurkat (ACC 282, DSMZ, Braunschweig, Germany), cultured in RPMI 1640 medium supplemented with 10% FCS and 1% glutamine. Cells were cultured in a CO2 incubator (INCOmed, MEMMERT, Schwabach, Germany) at 37°C, 95% humidified air and 5% CO2.
Analysis of Jurkat cells using flow cytometry
Before beginning every experiment, cell viability and cell count were determined using a Muse® Cell Analyzer (EMD Millipore, Billerica, MA, USA). Cells were adjusted to a concentration of 2×10⁵ cells/mL in culture medium, and 950 µL of the suspension were seeded in each well of a TC 48-well plate (Sarstedt, Nümbrecht, Germany). Then, the wells were supplemented with 50 µL of the sterile-filtered samples. After preincubation of cells with free hypericin, particle-bound hypericin or free hypericin in the presence of particles for 2 hours, the cells were incubated for 2 hours, while in the dark (plates were wrapped with aluminum foil) the cells were excited with a slimlite LED white light source (40 W/m2, Kaiser, Buchen, Germany) for different time intervals (0, 5, 10, and 15 minutes) to start the phototoxic reaction of hypericin, followed by incubation for 16, 24, and 48 hours. Subsequently, cells were mixed and 50 µL of the cell suspension were taken out and incubated with 250 µL freshly prepared staining solution, consisting of 1 µL/mL Hoe, 0.5 µL/mL AxV, and 0.4 µL/mL DiI in Ringer’s solution for 20 minutes at 4°C.
Flow cytometry was performed with a Gallios cytofluorometer (Beckman Coulter, Brea, CA, USA). Excitation for AxV-Fitc was at 488 nm, the Fitc fluorescence was recorded on an FL1 sensor (525/38 nm BP), the DiI fluorescence was excited at 638 nm and recorded on an FL6 sensor (675/20 nm BP), and the Hoechst 33342 fluorescence was excited at 405 nm and recorded on an FL9 sensor (430/40 nm BP). Electronic compensation was used to eliminate bleed through fluorescence. Data analysis was performed with Kaluza software version 2.0 (Beckman Coulter).
Hoe has been used to differentiate between cells (Hoe positive) and particles (Hoe negative). DiI was added to measure mitochondrial membrane potential in viable (DiI positive) as well as apoptotic and necrotic cells (both DiI negative). AxV serves as additional cell viability marker (AxV negative: viable; AxV positive: apoptotic/necrotic). During preparation steps, excitation by any ambient light was reduced to a minimum. All experiments were performed in triplicates and the results were averaged. The statistical significance of comparisons with the untreated control was investigated using Student’s t-test in Excel (Microsoft Corporation, Redmond, WA, USA) (*P<0.05, **P<0.005, and ***P<0.0005).
In vitro ROS determination
The amount of hypericin-produced ROS was determined using the fluorescence dye DCFH-DA. DCFH-DA was then incubated with the cells (2×10⁵ cells/mL) in a concentration of 20 µM for 30 minutes in the dark at 37°C to ensure cell penetration. After that, cells were washed once and taken up in PBS. Suspensions (950 µL) were pipetted into each well of a 48-well plate and 50 µL of free hypericin, particle-bound hypericin, as well as a free hypericin in the presence of SPIONCMD were added to a drug concentration of 0.2 µg/mL and incubated for further 2 hours. Afterward, cells were excited with the LED white light source for 60 seconds. After further incubation for 5, 45, and 85 minutes, 300 µL of each well were taken out and analyzed in flow cytometry. DCFH was excited at 488 nm and its fluorescence was recorded on an FL1 sensor (525/38 nm BP). The corresponding cell viability was determined by morphological cell analysis in a flow cytometer: the forward scatter, which is a measure for the size of the cell and can be used to determine between cell and nanoparticles, is plotted against the side scatter, which stands for the granularity of the cells. Experiments were performed in quadruplicates and the results were averaged. The statistical significance of comparisons with the untreated control was investigated using Student’s t-test in Excel (Microsoft Corporation) (*P<0.05, **P<0.005, and ***P<0.0005).
Results and discussion
Structural characterization of SPIONCMD-Hyp
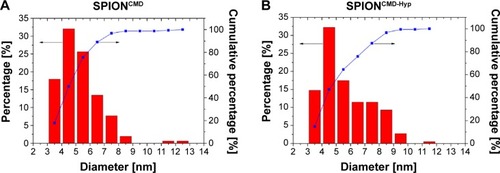
We first investigated the change in size and ζ potential after each preparation step of the particles, which is summarized in . SPIONDEX, which is the building block of our system, has a hydrodynamic size of approximately 56.3±1.2 nm and a relatively uncharged surface with a ζ potential of −5.3±0.3 mV. After the functionalization process, the hydrodynamic size is increased to 66.4±2.2 nm. Due to the anionic character of carboxyl groups, which are introduced to the particle surface, the ζ potential is decreased to −35.9±1.1 mV. The linkage between hypericin and SPIONCMD was achieved via GA, which changed the ζ potential to −40.7±0.2 mV and increased the hydrodynamic size to 84.5±0.3 nm. The obtained particles did not show any sign of precipitation after 12 weeks of storage.
Table 1 Particle sizes (volume mean diameter) and ζ potential in water at pH 7
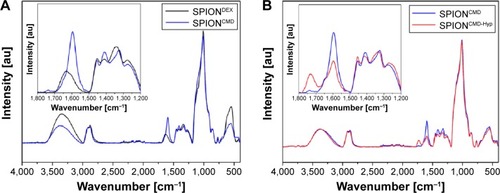
Besides the change in ζ potential, the success of carboxymethylation of the dextran coating on the particles is also demonstrated in the fourier transform infrared spectra (). Both SPIONDEX and SPIONCMD exhibit a strong peak at 600 cm−1 that can be attributed to Fe–O surface vibrations.Citation28 The presence of dextran can be ascertained by characteristic α-glucopyranose ring deformation modes at frequencies of 765, 845, and 914 cm−1. Absorption bands at 1,000–1,150 cm−1 correspond to C–O–C vibrations and peaks at 1,040–1,150 cm−1 to C=O vibrational modes.Citation29 In addition, C–H peaks of dextran were produced in a range of 1,250–1,460 cm−1 and further at around the frequency of 2,900 cm−1.Citation30 Absorption bands at 1,640 and 3,400 cm−1 are visible due to O–H deformation and stretching modes of hydroxyl groups, related to the dextran coating and physical adsorbed water.Citation30 After functionalization, the particles show new bands at 1,720 cm−1 and 1,640 cm−1, which correspond to C=O stretches of carboxylic acid, and prove the success of the particle functionalization. After binding hypericin to the particles via GA, the peak ratios in the range between 1,800 and 1,200 cm−1 change (). The main differences in the spectra are the reduction of the peak at 1,600 cm−1 and the increase in the peak at 1,720 cm−1, which can also be attributed to C=O stretches by hypericin. However, GA molecules, which are not involved in the hypericin binding, might also contribute to the band changes.
Figure 2 FT-IR spectra demonstrate the success of the functionalization of SPIONCMD.
Notes: The inset shows the introduction of peaks at 1,720 and 1,600 cm−1, which can be contributed to carboxyl groups (A). The spectra for SPIONCMD-Hyp shows changes in relative peak intensities, which can be attributed to the linkage of hypericin and glutaraldehyde; the inset shows magnification of the important wavenumber range (B).
Abbreviations: FT-IR, fourier transform infrared; SPIONCMD, functionalized dextran-coated SPIONs; SPION, superparamagnetic iron oxide nanoparticle; SPIONCMD-Hyp, hypericin linked to SPIONCMD; SPIONDEX, dextran-coated SPIONs; au, arbitrary unit.
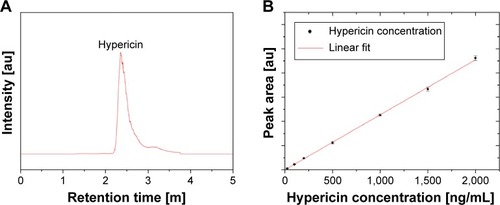
In order to quantify the amount of hypericin, which is coupled to the particles, an HPLC-MS quantification method was developed. An exemplary chromatogram of hypericin with the aforementioned conditions is depicted in . The peak has a retention time of 2.4 minutes and a slight tailing. shows that there is a distinct linear correlation between the area under the curve and the hypericin concentration in the concentration range between 25 and 2,000 ng/mL with an R2=0.9993. With this assay, the hypericin concentration of SPIONCMD-Hyp was determined as 6.9±0.8 µg/mL and in relation to the iron concentration it is 6.7±0.5 µg hypericin/mg iron, which is high enough for further biological tests.Citation31,Citation32 Washing of the particles 12 weeks after fabrication and remeasuring the hypericin concentration resulted in similar contents, proving that the particles do not show drug leakage over the examined time period.
Figure 3 Exemplary HPLC ESI-MS chromatogram of hypericin (A). Linear calibration curve (R2=0.9993) for the determination of the particles’ hypericin concentration (B).
Abbreviations: HPLC ESI-MS, high-performance liquid chromatography combined with an electrospray-ionization mass spectrometer; m, minutes.
Overview TEM images of SPIONCMD and SPIONCMD-Hyp are depicted in . Both samples show agglomeration of round iron oxide nanoparticles. The sizes of the clusters are consistent with dynamic light scattering experiments. displays the size distribution of the individual iron oxide cores which are the building blocks for the agglomerates. The distribution was derived from measuring 200 particles within TEM pictures (data not shown) with the software ImageJ. The sizes for SPIONCMD ranged from 3.0 to 9.0 nm and had a mean value of 4.5±1.0 nm. SPIONCMD-Hyp has a similar distribution in the range between 3.0 and 10.0 nm, with a mean value of 4.6±1.0 nm. It can be concluded that the core size distributions for both samples were quite narrow and in the same order of magnitude. These values are in good agreement for dextran-coated SPIONs in the literature.Citation26,Citation33,Citation34
Figure 4 Overview TEM image of SPIONCMD (A) and SPIONCMD-Hyp (B) particles show agglomerates of SPIONs.
Abbreviations: TEM, transmission electron microscopy; SPIONCMD, functionalized dextran-coated SPIONs; SPION, superparamagnetic iron oxide nanoparticle; SPIONCMD-Hyp, hypericin linked to SPIONCMD.
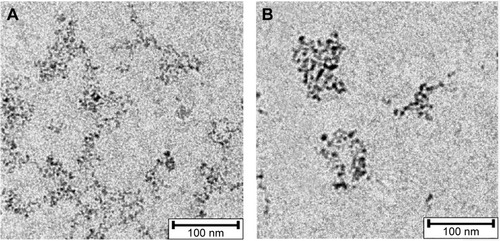
Figure 5 Magnetite particle distributions derived from measuring 200 particles of TEM images with the software ImageJ.
Notes: The sizes for SPIONCMD ranged from 3.0 to 9.0 nm and had a mean value of 4.5±1.0 nm (A). The sizes for SPIONCMD-Hyp ranged from 3.0 to 10.0 nm and had a mean value of 4.6±1.0 nm (B).
Abbreviations: TEM, transmission electron microscopy; SPIONCMD, functionalized dextran-coated SPIONs; SPION, superparamagnetic iron oxide nanoparticle; SPIONCMD-Hyp, hypericin linked to SPIONCMD.
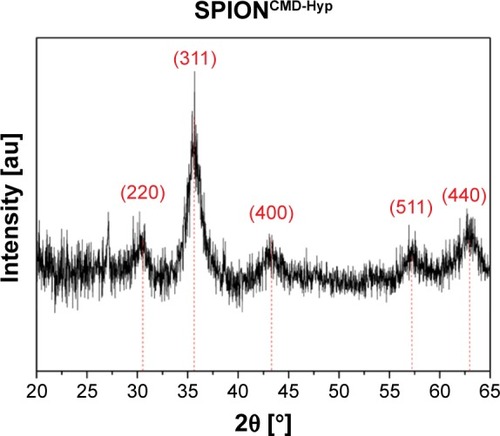
Examination of the crystalline structure and the crystallite size were performed by recording an XRD pattern of SPIONCMD-Hyp, which is depicted in . Occurring peaks are characteristic for the face-centered cubic spinel structure of magnetite as well as maghemite, which only differ slightly. Thus, differentiation, whether magnetite, maghemite, or a combination of both has been formed, is not determinable only due to the XRD pattern. The major peak at 35.6° refers to the (311) plane, while less marked peaks at 30.3° (220), 43.4° (400) 57.3° (511), and 62.7° (440) indicate a small crystallite size.Citation35,Citation36 Taking Bragg’s law (EquationEquation 1(1) ) into account, the interplanar spacing dhkl, corresponding to the (311) plane, can be calculated with its peak position to dhkl=0.25240 nm. By applying this result in EquationEquation 2
(2) , the lattice parameter a can be determined to a=0.83713 nm. In comparison with literature values for magnetite (a=0.83967 nm) and maghemite (a=0.83457 nm), the lattice parameter is located right between both iron oxide forms.Citation37 Based on this result, a definite determination, whether magnetite or maghemite is formed, cannot be done. However, it can be assumed that a mixture of both is present in the sample. It is thinkable that magnetite has been formed during precipitation under inert gas, but even storage at 4°C of the particles enables oxidation and hence partial formation of maghemite.Citation38 Moreover, the crystallite size can be estimated with the full width at a half maximum of the (311) peak by applying EquationEquation 3
(3) . This results in dXRD≈5 nm for the SPIONCMD-Hyp sample and is in line with the mean value of the size distribution, which was acquired from TEM images.
Figure 6 XRD pattern of SPIONCMD-Hyp exhibits typical peaks for the spinel structure of magnetite.
Note: The high noise is typical for nanocrystallites.
Abbreviations: XRD, X-ray diffraction; SPIONCMD, functionalized dextran-coated SPIONs; SPION, superparamagnetic iron oxide nanoparticle; SPIONCMD-Hyp, hypericin linked to SPIONCMD.
Biological characterization of SPIONCMD-Hyp
The toxicological impact of SPIONCMD, SPIONCMD-Hyp, and hypericin alone on Jurkat cells was determined using two fluorescent viability markers in flow cytometry. Healthy cells exhibit a proton gradient of the inner mitochondrial plasma membrane, which generates the conversion from adenosine diphosphate to adenosine triphosphate. Therefore, DiI – a compound that penetrates the cytosol of the cells and accumulates in the active and vital mitochondria – was used to determine this membrane potential. A decrease in this potential is an indicator for apoptosis and necrosis.Citation39 On the other hand, AxV serves as an alternative marker for dying and dead cells. AxV binds phosphatidylserine, which is accessible in apoptotic cells due to exposition on the outer layer of the plasma membrane and in necrotic cells due to rupture of the plasma membrane. Viable cells, in contrast, have an asymmetric plasma membrane with phosphatidylserine located on the inner side and not accessible for AxV binding. Usually, AxV is combined with propidium iodide, making it possible to differentiate between apoptotic and necrotic cells, but since the emission wavelength of propidium iodide (620 nm) overlaps by the emission peak of hypericin (~600 nm), it is not used in our experiments.Citation39
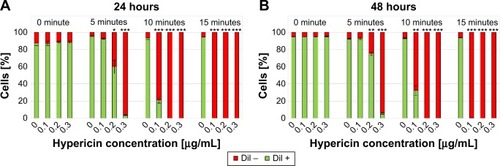
First of all, free hypericin was used as proof of principle for the phototoxicity of hypericin after light irradiation on Jurkat cells. Jurkat cells were treated with 0, 0.1, 0.2, and 0.3 µg/mL hypericin and exposure time was 0, 5, 10, and 15 minutes. exemplarily shows the results for the DiI staining 24 hours after exposure. Both the experiments with DiI and AxV (data not shown) indicate that in the absence of light, hypericin does not display any toxic effects independent from the incubation time, confirming hypericin’s negligible dark toxicity.Citation40 However, a concentration and exposure time-dependent increase in cytotoxicity can be clearly observed. With 15 minutes of light exposure, all hypericin concentrations cause complete cell death, whereas with shorter light exposure (5 and 10 minutes) not all cells are killed. In the samples with 5-minute exposure, a clear dose-dependent cytotoxic effect of the hypericin can be observed. Interestingly, after incubation for 48 hours, proliferation of the surviving cells can be observed () underlining the importance of initially high tumor cell killing rates in cancer therapy, especially for the fact that apoptotic cell death is immunologically silent and factors released from apoptotic cells might foster the compensatory proliferation of the surviving cells causing tumor cell repopulation.Citation41
Figure 7 Cell death of Jurkat cells determined by DiI staining 24 hours (A) and 48 hours (B) after treatment with hypericin in different concentrations.
Notes: DiI-positive cells were considered viable, DiI-negative cells were considered dying/dead. Without illumination hypericin shows no toxicity, whereas with increased exposure time (0, 5, 10, and 15 minutes) as well as concentration (0, 0.1, 0.2, and 0.3 µg/mL) cell death can be observed. Figures show the mean values of triplicates with standard deviations. The statistical significance of comparisons with the untreated control was investigated using Student’s t-test in Excel (Microsoft Corporation, Redmond, WA, USA) (*P<0.05, **P<0.005, and ***P<0.0005).
Abbreviation: DiI, hexamethylindodicarbo-cyanine iodide.
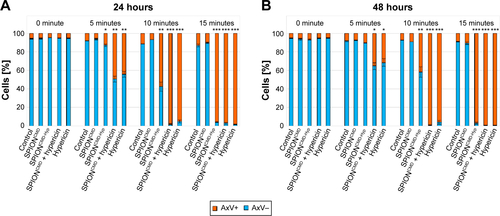
Based on these data for the following experiments, an intermediate hypericin concentration of 0.2 µg/mL was selected to investigate cytotoxic capacity of nanoparticle loaded with hypericin. Free hypericin, SPIONCMD-Hyp (corresponding iron concentration: 30 µg/mL), and SPIONCMD in the presence of free hypericin were incubated with Jurkat cells and illuminated for the same times as aforementioned. Water and SPIONCMD served as controls. shows exemplary results for DiI staining 24 hours after exposure (corresponding AxV data are shown in ). In line with the experiment before, in the presence of hypericin and the absence of light cell remained viable, whereas hypericin in the presence of light induced cell death in an exposure time-dependent manner. Unloaded SPIONs (SPIONCMD) did not induce cell death at all.
Figure 8 Cell death of Jurkat cells determined by DiI staining 24 hours (A) and 48 hours (B) after treatment with SPIONCMD, SPIONCMD-Hyp, SPIONCMD + hypericin not linked to the particles as well as hypericin alone at a hypericin concentration of 0.2 µg/mL.
Notes: DiI-positive cells were considered viable, DiI-negative cells were considered dying/dead. Without illumination all samples show no toxicity, whereas with increased exposure time (0, 5, 10, and 15 minutes) cell death can be observed. Figures show the mean values of triplicates with standard deviations. The statistical significance of comparisons with the untreated control was investigated using Student’s t-test in Excel (Microsoft Corporation, Redmond, WA, USA) (*P<0.05, **P<0.005, and ***P<0.0005).
Abbreviations: DiI, hexamethylindodicarbo-cyanine iodide; SPIONCMD, functionalized dextran-coated SPIONs; SPION, superparamagnetic iron oxide nanoparticle; SPIONCMD-Hyp, hypericin linked to SPIONCMD.
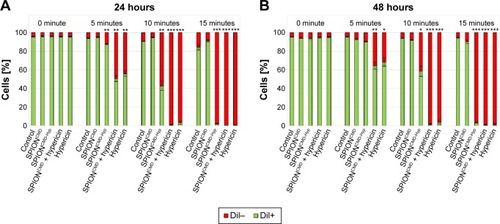
Comparing the cytotoxic effect of free hypericin (Hyp and SPIONCMD + Hyp) and particle-bound hypericin (SPIONCMD-Hyp), free hypericin showed a stronger cytotoxic effect. In contrast, the presence of SPIONs in the free hypericin solution (SPIONCMD + Hyp) did not reduce the cytotoxic effect, indicating that binding of hypericin to the particles and not quenching of light is responsible for a lower cytotoxicity of SPION-bound hypericin. Again, prolonged incubation of cells after treatment showed proliferation of the surviving cells in the presence of free hypericin as well as in the presence of SPIONCMD-Hyp ().
In order to prove that the cytotoxic effects can be attributed to the ROS formation an assay with the hydrophobic and nonfluorescent DCFH-DA molecule is used. It is able to penetrate into cells, where intracellular esterases hydrolyze it to the nonfluorescent dichlorofluorescein (DCFH). In the presence of ROS, DCFH is oxidized to the fluorescent dichlorofluorescein (FDCF), which can be detected by flow cytometry to quantify the amount of produced ROS.Citation42 For the experiments, an intermediate hypericin concentration of 0.2 µg/mL was used. For previous phototoxicity investigations, cells were incubated in FCS containing culture medium, whereas for ROS determination using DCFH-DA cells were incubated in PBS. Preliminary tests showed that the change of the suspension media increases the sensitivity of the cells toward the treatment, and therefore the irradiation time had to be reduced to 1 minute under these conditions. shows exemplary results in 5 minutes after light exposure. The fluorescence signal indicating the ROS generation was normalized to the control.
Figure 9 Determination of ROS generation (A) and corresponding cell death (B).
Notes: DCFH-DA-treated Jurkat cells after application of SPIONCMD, SPIONCMD-Hyp, SPIONCMD + hypericin not linked to the particles as well as hypericin alone with a drug concentration of 0.2 µg/mL and exposure time of 1 minute. Cell viability was determined by morphological cell analysis. After incubation for 5 minutes the hypericin samples showed ROS generation and correspondent cell death, whereas hypericin-bound nanoparticles without illumination did not generate ROS. Figures present the mean value of quadruplicates with standard deviations. The statistical significance of comparisons with the untreated control was investigated using Student’s t-test in Excel (Microsoft Corporation, Redmond, WA, USA) (*P<0.05, **P<0.005, and ***P<0.0005).
Abbreviations: DCFH-DA, 2′,7′-dichlorofluorescein diacetate; SPIONCMD, functionalized dextran-coated SPIONs; SPION, superparamagnetic iron oxide nanoparticle; SPIONCMD-Hyp, hypericin linked to SPIONCMD; ROS, reactive oxygen species; au, arbitrary unit.
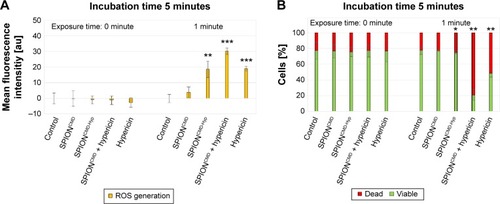
Without illumination, no increase in the FDCF fluorescence signal is detected and the cell viability is unchanged. However, after 1 minute light exposure, all samples with hypericin showed an increase in FDCF fluorescence indicating the generation of ROS. It is noteworthy that even the particles without hypericin produced a low amount of ROS, which might be due to the Fenton reaction that occurs by availability of Fe2+ of the particles in the presence of hydrogen peroxide.Citation43 As a consequence, 5 minutes of incubation after light exposure, the FDCF intensity of SPIONCMD + hypericin is approximately the sum of the intensities of pure hypericin and SPIONCMD specimens. The intensity of SPIONCMD-Hyp is higher compared to SPIONCMD, but lower compared to the other ones which is in agreement with the slower kinetics in the toxicological investigations. Furthermore, already 5 minutes after light exposure for 1 minute, cell death was induced as determined by characteristic morphological alterations of the cells, leading to the assumption that the predominant cell death mechanism is necrosis, because apoptosis is a more time-consuming process.Citation44 With prolonged incubation after light exposition, the FDCF fluorescence signal of the samples with free hypericin decreases parallel with increasing cell death rates, whereas the SPION-bound hypericin produces a constant FDCF signal with lower cell death rates. This might be due to faster intracellular uptake and abreaction of free hypericin compared to nanoparticle bound hypericin.
Conclusion
In this project, dextran-coated and functionalized SPIONs, loaded with a sufficient amount of hypericin, were successfully synthesized for the first time. The particles were stable in water and PBS for several weeks, without any sign of agglomeration. The evaluation of the phototoxic behavior of the hypericin-bound particles was performed with the non-adherent Jurkat cell line by investigating the viability of cells via DiI and AxV staining and flow cytometry. The experiment revealed that pure nanoparticles as well as hypericin were not toxic for the cells in the absence of light illumination, whereas drug-loaded particles induced cell death in a concentration and exposure time-dependent manner. Comparison of nanoparticle-loaded hypericin to the controls treated with free hypericin indicated a weaker cytotoxic impact that can be explained by reducing effects of drug coupling to particles. This difference can still be compensated by adjusting the irradiation time. Furthermore, with a DCFH-DA assay, the origin of the cytotoxic behavior could be attributed to the generation of ROS. In conclusion, the combination of dextran-coated SPIONs loaded with hypericin represents a promising approach to be used in combined MDT and PDT for cancer therapy.
Acknowledgments
The authors are grateful to the Bavarian State Ministry of the Environment and Consumer Protection, the Margarete Ammon Stiftung, and to the DFG Cluster of Excellence – Engineering of Advanced Materials (EAM) for their support. We further acknowledge support by Deutsche Forschungsgemeinschaft and Friedrich-Alexander-Universität Erlangen-Nürnberg within the Open Access Publishing funding program.
Supplementary material
Figure S1 Cell death of Jurkat cells determined by AxV staining 24 hours (A) and 48 hours (B) after treatment with SPIONCMD, SPIONCMD-Hyp, and SPIONCMD + hypericin not linked to the particles as well as hypericin alone at a hypericin concentration of 0.2 µg/mL.
Notes: AxV-negative cells were considered viable, AxV-positive cells were considered dying/dead. Without illumination all samples show no toxicity, whereas with increased exposure time (0, 5, 10, and 15 minutes) cell death can be observed. Figure shows the mean values of triplicates with standard deviations. The statistical significance of comparisons with the untreated control was investigated using Student’s t-test in Excel (Microsoft Corporation, Redmond, WA, USA) (*P<0.05, **P<0.005, and ***P<0.0005).
Abbreviations: AxV, Annexin V; SPIONCMD, functionalized dextran-coated SPIONs; SPION, superparamagnetic iron oxide nanoparticle; SPIONCMD-Hyp, hypericin linked to SPIONCMD.
Disclosure
The authors report no conflicts of interest in this work.
References
- TietzeRLyerSDurrSAlexiouCNanoparticles for cancer therapy using magnetic forcesNanomedicine (Lond)20127344745722385201
- AlexiouCTietzeRSchreiberECancer therapy with drug loaded magnetic nanoparticles – magnetic drug targetingJ Magn Magn Mater20113231014041407
- TietzeRJurgonsRLyerSQuantification of drug-loaded magnetic nanoparticles in rabbit liver and tumor after in vivo administrationJ Magn Magn Mater20093211014651468
- AlexiouCDiehlDHenningerPA high field gradient magnet for magnetic drug targetingIEEE Trans Appl Supercond200616215271530
- SeligerCJurgonsRWiekhorstFIn vitro investigation of the behaviour of magnetic particles by a circulating artery modelJ Magn Magn Mater20073111358362
- BealleGDiCRKolosnjaj-TabiJUltra magnetic liposomes for mr imaging, targeting, and hyperthermiaLangmuir20122832118341184222799267
- AlexiouCTietzeRSchreiberELyerSPharmakotherapie mittels nanomedizinOnkologe2011175405412
- ChengLJinCLvWDingQHanXDeveloping a highly stable PLGA-mPEG nanoparticle loaded with cisplatin for chemotherapy of ovarian cancerPLoS One201169e25433e2543321966528
- TietzeRLyerSDurrSEfficient drug-delivery using magnetic nanoparticles – biodistribution and therapeutic effects in tumour bearing rabbitsNanomed Nanotechnol Biol Med201397961971
- JankoCDürrSMunozLMagnetic drug targeting reduces the chemotherapeutic burden on circulating leukocytesInt J Mol Sci20131447341735523549268
- DornianiDBinHMZKuraAUFakuraziSShaariAHAhmadZPreparation of Fe3O4 magnetic nanoparticles coated with gallic acid for drug deliveryInt J Nanomed2012757455756
- WahajuddinAroraSSuperparamagnetic iron oxide nanoparticles: magnetic nanoplatforms as drug carriersInt J Nanomed2012734453471
- ZhaoYDunnillCWZhuYLow-temperature magnetic properties of hematite nanorodsChem Mater2007194916921
- ShiSJiaJ-fGuoX-kToxicity of iron oxide nanoparticles against osteoblastsJ Nanopart Res20121491091
- LyerSTietzeRJurgonsRVisualisation of tumour regression after local chemotherapy with magnetic nanoparticles – a pilot studyAnticancer Res20103051553155720592340
- AlexiouCNanomedicine: basic and clinical applications in diagnostics and therapyElse Kröner-Fresenius Symposium2BaselKarger2011154163
- LyerSTietzeRDürrSDiagnostic imaging in cancer therapy with magnetic nanoparticlesBuzugTMBorgertJMagnetic Particle Imaging140Berlin, HeidelbergSpringer2012199203
- BrunkeOOdenbachSJurgonsRAlexiouCHilgerIBeckmannFDetermination of the magnetic particle distribution in tumour tissue by means of x-ray tomographyJ Phys Condens Matter20061838S2903
- TietzeRRahnHLyerSVisualization of superparamagnetic nanoparticles in vascular tissue using XmuCT and histologyHistochem Cell Biol2011135215315821279377
- KimDKZhangYVoitWRaoKVMuhammedMSynthesis and characterization of surfactant-coated superparamagnetic monodispersed iron oxide nanoparticlesJ Magn Magn Mater20012251–23036
- LeeYTWooKChoiKSPreparation of water-dispersible and biocompatible iron oxide nanoparticles for MRI agentIEEE Trans Nanotechnol200872111114
- Carmen BautistaMBomati-MiguelOdel Puerto MoralesMSernaCJVeintemillas-VerdaguerSSurface characterisation of dextran-coated iron oxide nanoparticles prepared by laser pyrolysis and coprecipitationJ Magn Magn Mater200529312027
- HuynhRChaubetFJozefonviczJCarboxymethylation of dextran in aqueous alcohol as the first step of the preparation of derivatized dextransDie Angew Makromol Chem199825416165
- KariotiABiliaARHypericins as potential leads for new therapeuticsInt J Mol Sci201011256259420386655
- WilsonBCPhotodynamic therapy for cancer: principlesCan J Gastroenterol200216639339612096303
- UnterwegerHTietzeRJankoCDevelopment and characterization of magnetic iron oxide nanoparticles with a cisplatin-bearing polymer coating for targeted drug deliveryInt J Nanomed2014936593676
- DokuzovicLKolorimetrie-photometrie Available from: http://www.lickl.net/doku/photo.pdf1822Accessed on Oct 23, 2013
- ShenMCaiHWangXeaFacile one-pot preparation, surface functionalization, and toxicity assay of APTS-coated iron oxide nanoparticlesNanotechnology2012231010560122349004
- PretschEBühlmannPBadertscherMStructure Determination of Organic Compounds – Tables of Spectral Data4Berlin HeidelbergSpringer-Verlag2009
- JungCWSurface properties of superparamagnetic iron oxide MR contrast agents: ferumoxides, ferumoxtran, ferumoxsilMagn Reson Imag1995135675691
- ZhangWAnkerLLawREEnhancement of radiosensitivity in human malignant glioma cells by hypericin in vitroClin Cancer Res1996258438469816239
- BlankMKostenichGLavieGKimelSKeisariYOrensteinAWavelength-dependent properties of photodynamic therapy using hypericin in vitro and in an animal modelPhotochem Photobiol200276333534012403456
- BogdanovAAJrMartinCWeisslederRBradyTJTrapping of dextran-coated colloids in liposomes by transient binding to aminophospholipid: preparation of ferrosomesBiochim Biophys Acta1994119312122187518693
- PardoeHChua-anusornWSt PierreTGDobsonJStructural and magnetic properties of nanoscale iron oxide particles synthesized in the presence of dextran or polyvinyl alcoholJ Magn Magn Mater20012251–24146
- MascoloMPeiYRingTRoom temperature co-precipitation synthesis of magnetite nanoparticles in a large pH window with different basesMaterials201361255495567
- SunJZhouSHouPSynthesis and characterization of biocompatible Fe3O4 nanoparticlesJ Biomed Mater Res Part A200780A2333341
- CervellinoAFrisonRCernutoGGuagliardiAMasciocchiNLattice parameters and site occupancy factors of magnetite–maghemite core–shell nanoparticles. A critical studyJ Appl Crystallograp201447517551761
- ZalogaJJankoCAgarwalRDifferent storage conditions influence biocompatibility and physicochemical properties of iron oxide nanoparticlesInt J Mol Sci20151659368938425918940
- MunozLEMaueroderCChaurioRBerensCHerrmannMJankoCColourful death: six-parameter classification of cell death by flow cytometry – dead cells tell talesAutoimmunity201346533634123231469
- AgostinisPVantieghemAMerlevedeWde WittePAMHypericin in cancer treatment: more light on the wayInt J Biochem Cell Biol20023422124111849990
- HuangQLiFLiuXCaspase 3-mediated stimulation of tumor cell repopulation during cancer radiotherapyNat Med201117786086621725296
- BarathanMMariappanVShankarEMAbdullahBJGohKLVadiveluJHypericin-photodynamic therapy leads to interleukin-6 secretion by HepG2 cells and their apoptosis via recruitment of BH3 interacting-domain death agonist and caspasesCell Death Dis20134e69723807226
- LiuQBerchner-PfannschmidtUMöllerUA Fenton reaction at the endoplasmic reticulum is involved in the redox control of hypoxia-inducible gene expressionProc Natl Acad Sci U S Am20041011243024307
- BonfocoEKraincDAnkarcronaMNicoteraPLiptonSAApoptosis and necrosis: two distinct events induced, respectively, by mild and intense insults with N-methyl-D-aspartate or nitric oxide/superoxide in cortical cell culturesProc Natl Acad Sci U S Am1995921671627166