
Abstract
A new strategy to improve osseointegration of implants is to stimulate adhesion of bone cells, bone matrix formation, and mineralization at the implant surface by modifying surface coating on the nanoscale level. Plant-derived pectins have been proposed as potential candidates for surface nanocoating of orthopedic and dental titanium implants due to 1) their osteogenic stimulation of osteoblasts to mineralize and 2) their ability to control pectin structural changes. The aim of this study was to evaluate in vitro the impact of the nanoscale plant-derived pectin Rhamnogalacturonan-I (RG-I) from potato on the osteogenic response of murine osteoblasts. RG-I from potato pulps was isolated, structurally modified, or left unmodified. Tissue culture plates were either coated with modified RG-I or unmodified RG-I or – as a control – left uncoated. The effect of nanocoating on mice osteoblast-like cells MC3T3-E1 and primary murine osteoblast with regard to proliferation, osteogenic response in terms of mineralization, and gene expression of Runt-related transcription factor 2 (Runx2), alkaline phosphate (Alpl), osteocalcin (Bglap), α-1 type I collagen (Col1a1), and receptor activator of NF-κB ligand (Rankl) were analyzed after 3, 7, 14, and 21 days, respectively. Nanocoating with pectin RG-Is increased proliferation and mineralization of MC3T3-E1 and primary osteoblast as compared to osteoblasts cultured without nanocoating. Moreover, osteogenic transcriptional response of osteoblasts was induced by nanocoating in terms of gene induction of Runx2, Alpl, Bglap, and Col1a1 in a time-dependent manner – of note – to the highest extent under the PA-coating condition. In contrast, Rankl expression was initially reduced by nanocoating in MC3T3-E1 or remained unaltered in primary osteoblast as compared to the uncoated controls. Our results showed that nanocoating of implants with modified RG-I beneficially 1) supports osteogenesis, 2) has the capacity to improve osseointegration of implants, and is therefore 3) a potential candidate for nanocoating of bone implants.
Introduction
Nanotechnology in dentistry has expanded over the last years, especially in implant dentistry. Surface modification at the nanolevel has been reported in a number of studies to play a crucial role in osseointegration.Citation1–Citation12 A new strategy to improve osseointegration is biochemical stimulation by developing surface nanocoating, which is able to increase adhesion of bone cells, bone matrix formation, and mineralization at the implant surface.
Nanocoating with organic molecules and human-, animal-, and plant-derived polysaccharides demonstrated that complementary lectins to cell-surface carbohydrates have the ability to bind polysaccharide present at the surface and mediate cell response ().Citation4 Plant-derived pectins have been proposed as potential candidates for surface nanocoating of medical devices due to their effect on bone cells and the possibility of controlling their structure.Citation13–Citation15 The effect on bone cells has been explained by a direct adhesion of cells to pectins and indirectly through proteins binding to the pectins ().Citation4 The direct mechanism results in adhesion of bone cells directly to the surface. The indirect mechanism results in binding of a variety of proteins from the surrounding fluids to the surface, followed by selective binding to distinct receptors on the surface of invading cells.Citation16,Citation17 Binding to the receptors will elicit signals in the cells that result in enhanced adhesion, proliferation, and production of extracellular matrix (ECM).Citation17 Osteoblast differentiation process is essential for development, maturation, and repair of the bone.Citation18 A functional relationship between cell growth and the initiation and progression of events associated with cell differentiation is maintained and strictly regulated.Citation19 The sequentially regulated expression of cell growth genes has defined three distinct phases of osteoblast development: 1) proliferation; 2) ECM synthesis, development, and maturation; and 3) ECM mineralization.Citation19–Citation21
Figure 1 Schematic representation of specific cell recognition and adhesion to titanium surface nanocoated with analogs of cell-surface carbohydrates (1), osteoblasts with integrins recognize and adhere directly or indirectly through adhesive proteins to the surface (2), followed by migration, proliferation (3), differentiation and maturation (4), and transformation into osteocytes and lining cells (5).
Note: Reproduced with permission from Gurzawska KA. Nanocoating of Implant Surfaces with Pectin Rhamnogalacturonan-ls, Review and In Vitro Studies [PhD thesis]. Copenhagen, Denmark: Faculty of Health and Medical Sciences, University of Copenhagen; 2013.Citation31
Abbreviation: ECM, extracellular matrix.
![Figure 1 Schematic representation of specific cell recognition and adhesion to titanium surface nanocoated with analogs of cell-surface carbohydrates (1), osteoblasts with integrins recognize and adhere directly or indirectly through adhesive proteins to the surface (2), followed by migration, proliferation (3), differentiation and maturation (4), and transformation into osteocytes and lining cells (5).Note: Reproduced with permission from Gurzawska KA. Nanocoating of Implant Surfaces with Pectin Rhamnogalacturonan-ls, Review and In Vitro Studies [PhD thesis]. Copenhagen, Denmark: Faculty of Health and Medical Sciences, University of Copenhagen; 2013.Citation31Abbreviation: ECM, extracellular matrix.](/cms/asset/a364c2c8-cc57-4fb3-9ac0-6721f623ca3e/dijn_a_99020_f0001_b.jpg)
As the osseointegration depends on osteoblast activity, it is important to investigate and understand the interaction between cell and the nanocoating at the surface. Pectin nanocoating has been reported in a number of studies to modulate the osteoblast response because of their chemical and physical properties. Pectin’s chemical structure imitates the polysaccharides from the ECM of mammals, thus providing biospecific cell adhesion.Citation22 It is possible to control the structure of pectin RG-I (Rhamnogalacturonan-I) by enzymatic modification. A variety of different pectin structures can be produced by changing the side chains (galactose and arabinose) or main chain (galacturonic acid and rhamnose) of the pectin molecule. Therefore, a screening of different RG-Is is important for identifying the regions of the RG-I molecule most important for bone cells and mineralized matrix formation. The hypothesis of our study is that galactose side chain will promote osteoblasts to produce mineralized matrix. The aim of this study was to evaluate in vitro the effect of nanocoating of polystyrene surfaces with unmodified and enzymatically modified (enrichment of galactose side chains) pectin RG-I from potato on osteoblasts with respect to their osteogenic response.
Experimental
Isolation, modification, and analysis of RG-I
Isolation and modification of RG-I
RG-I from potato pulps were isolated according to the previously published procedure.Citation23 The enzymatic modification of potato RG-I was done using polygalacturonase-I (Novozymes, Copenhagen, Denmark) and polygalacturonase-III (Novozymes) together with pectin methylesterase (Novozymes). The side chains of potato RG-I were treated with α-L-arabinofuranosidase and endo-arabinanase to remove arabinan side chains and with β-galactosidase and endo-β-1,4-galactanase to remove galactan side chains. The monosaccharide composition and linkage analysis of unmodified potato (PU) and potato dearabinanated (PA) has been presented in our previous work.Citation24
Surface modification and characterization
Surface nanocoating
Adherent PU (unmodified) and PA (modified) RG-Is (128 µg/mL) were coated on the surface of 6-, 24-, and 96-well tissue polystyrene culture plates (TCPS) (Techno Plastic Products, Trasadingen, Switzerland). The reaction was carried out at room temperature overnight under sterile conditions on a shaker (IKA-Werke GmbH & Co. KG, Staufen, Germany) at 100 rpm, and then the plates were extensively rinsed in sterile water and dried in a laminar flow hood before in vitro experiments.
Surface nanocoating detection
The recognition of PU and PA RG-Is nanocoating was performed using enzyme-linked immunosorbent assay (ELISA) before and after in vitro tests on the 24-well plate (n=2) in four wells selected randomly (m=4) to detect the presence of the nanocoating. RG-Is (PU and PA)-coated wells and control wells without RG-Is were blocked for 15 minutes with 1 mL/well (24-well plate) 5% (solution of fat-free milk powder in phosphate-buffered saline [PBS], pH 7.2) skimmed milk from Applichem (Darmstadt, Germany). Skimmed milk was removed from all the wells, and 1 mL/well of anti-(1→4)-β-galactan LM5 (Plant Probes, Leeds, UK) diluted 1:10 in 5% skimmed milk was added. The 24-well plate was placed on a shaker for 2 hours. All wells were washed with 5% skimmed milk three times (after adding the milk to the wells, the plate was placed on a shaker for 5 minutes). Secondary antibody, anti-rat IgG (whole molecule) from Sigma-Aldrich (Munich, Germany), was diluted 1:5,000 in 5% of skimmed milk and 1 mL was added in each well. The plate was covered with aluminum foil and placed on the shaker for 2 hours. Subsequently, wells were washed three times with 1 M PBS. Approximately 500 µL of phosphate substrate was applied to each well, and the plate was placed on the shaker for 10 minutes. Colorimetric detection was performed with Microplate Reader 500 (Bio-Rad, Munich, Germany) at 450 nm.
In vitro studies
The TCPS with PU and PA nanocoating were the test samples, and TCPS without the RG-Is were control samples. The in vitro assays, proliferation, mineralization, gene expression, and cell cycle analysis, were repeated six times each (n=6). The osteogenic response was examined using mice osteoblast-like cells MC3T3-E1 and primary osteoblast isolated from calvariae of wild-type (WT) C57BL/6 mice. The primary osteoblasts were extracted from two samples of WT mice (WT1 and WT2), and all in vitro experiments were repeated twice.
Cell culture
MC3T3-E1 osteoblast-like cells were grown in cell culture medium consisting of minimum essential medium (Gibco, Darmstadt, Germany), 18% fetal bovine serum (FBS; Biochrom, Berlin, Germany), antibiotic (100 mg/L streptomycin and 100 U/mL penicillin; Biochrom), and 10 mL/L L-Glutamine (Biochrom) and incubated at 37°C with 5% CO2 (Heraeus, Hanau, Germany). Primary cells (WT) were isolated from mice calvariae (3 days old) using digestion medium containing 0.2% collagenase (Sigma-Aldrich), 0.25%/0.5% trypsin (Biochrom), and minimum essential medium (Gibco) and incubated at 37°C with 5% CO2 (Heraeus) with cell culture medium consisting of minimum essential medium (Gibco), 10% FBS (Biochrom), antibiotic (100 mg/L streptomycin and 100 U/mL penicillin) (Biochrom), and 10 mL/L nonessential amino acids (Biochrom). For proliferation assays, 1×10⁵ cells/mL were seeded on 96-well TCPS plates and cultured for 12, 24, 48, and 72 hours. Cell culture for cell cycle analysis with fluorescence-activated cell sorting (FACS) was performed on 24-well plates with 2×10⁴ cells/mL for 12, 24, 48, and 72 hours.
For real-time polymerase chain reaction (PCR), 5×10⁴ cells/mL were seeded on six-well TCPS plates and cultured for 3, 7, 14, and 21 days. For mineralization, 2×10⁴ cells/mL were seeded on 24-well TCPS plates and cultured for 3, 7, 14, and 21 days. For mineralization assay, culture medium in all wells was replaced after 24 hours with mineralization medium additionally consisting of 50 µL/mL ascorbic acid (Sigma-Aldrich, Seelze, Germany) and 10 mM glycerol 2-phosphate disodium salt hydrate (Sigma-Aldrich). The mineralization medium was changed every third day. The cells’ morphology was observed daily by light microscopy (Leitz Labovert, Ernst Leitz Wetzlar GmbH, Wetzlar, Germany).
Proliferation
Cell proliferation was determined by bromodeoxyuridine (BrdU). The BrdU incorporated into newly synthesized DNA was quantified after 12, 24, 48, and 72 hours. Briefly, the proliferation assay was performed following the procedure described by the manufacturer (Roche Diagnostics GmbH, Mannheim, Germany). BrdU was added to the culture medium and incubated (37°C, 5% CO2) for 2 hours. Afterward, the medium was removed and the cells were fixed in 70% ethanol for 30 minutes. Fixed cells were incubated with anti-BrdU antibody for 2 hours. The absorbance from each well was measured using the Microplate Reader 500 at 450 nm. The wells without cells (ie, containing only culture medium) were used as a blank; wells with cells incubated with anti-BrdU antibody for unspecific binding were used as a background and were subtracted from all measurements.
Cell cycle analysis
Cell cycle analysis was based on DNA staining method using propidium iodide (PI, Sigma-Aldrich), which binds in proportion to the amount of DNA present in the cell. In brief, cells after 12, 24, 48, and 72 hours were washed twice with 1 mL PBS, trypsinized, resuspended in 150 µL culture medium, and collected from three wells into one Eppendorf vial. Cells were harvested by centrifugation, 3,000 rpm for 10 minutes. The supernatant was discarded and the cells were washed with 500 µL PBS containing 2% FBS and harvested by centrifugation, at 3,000 rpm for 10 minutes. This procedure was repeated twice. Cells were fixed with 70% cold ethanol for 20 minutes at 4°C and centrifuged at 3,000 rpm for 10 minutes. Afterward, cells were washed twice with 1 mL cold PBS containing 2% FBS and centrifuged at 3,000 rpm for 10 minutes. Approximately 300 µL PBS containing 2% FBS and 1.5 µL RNase were added. Subsequently, cells were stained with PI and resuspended before cell cycle analysis using FACSCalibur flow cytometer (Becton-Dickinson, Mansfield, MA, USA) and FlowJo software (version 10; Tree Star Inc., Ashland, OR, USA).
Mineralization assay
In the mineralization assay, cells were fixed in ice-cold 70% ethanol (1 mL/well) for 1 hour at 4°C. The wells were washed with 1 mL distilled water, and the cell mineral matrix was stained with 500 µL, 40 mM Alizarin Red-S (AR-S; Sigma-Aldrich) at pH 4.2 for 10 minutes at room temperature, with shaking rotation 100 rpm. The wells were washed three times with 1 mL distilled water and finally washed with 1 mL PBS with calcium and magnesium (PBS+, Biochrom AG) for 15 minutes at room temperature, with shaking rotation 100 rpm to reduce nonspecific AR-S staining. Cell mineral matrix was destained in 500 µL 10% cetylpyridynium chloride (CPC; Sigma-Aldrich) for 15 minutes at room temperature, with rotation 100 rpm. Standard dilution and AR-S extracts were added (200 µL/well) into a 96-well ELISA plate and AR-S concentrations were determined at 562 nm using a Microplate Reader 500. Measurements were performed using 650 nm as reference. Additionally, standards were applied, 1.0 mM AR-S and 10% CPC (Sigma-Aldrich), to calculate the content of calcium in each well using analytical curve.
Gene expression, real-time PCR
RNA isolation using the RNeasy mini kit (Qiagen, Hilden, Germany) and the reverse-transcription PCR using one-step high-capacity cDNA reverse-transcription kit (Applied Biosystem, Foster City, CA, USA) were performed as previously described.Citation25 A comparative threshold cycle (Ct) method was selected for gene expression analysis performed with CFX96 Real-Time PCR Detection System (Bio-Rad). SsoAdvanced™ Universal SYBR Green Supermix (Bio-Rad) was used for expression of target genes: Runt-related transcription factor 2 (Runx2), alkaline phosphatase (Alpl), osteocalcin (Bglap), α-1 type I collagen (Col1a1), receptor activator of NF-κB Ligand (Rankl), and beta actin (Actb) as endogenous control gene. Manually prepared cDNA of 2 and 8 µL reaction mix were pipetted to each well of 96-well plate (Bio-Rad), according to manufacturer’s instructions. Results were shown using the comparative Ct method (ΔΔCt). As a Ct reference beta actin (Actb) has been used for each of sample.
Statistical analyses
Descriptive statistics were used and mean values were calculated. Results of surface analysis as well as results from the in vitro experiments were analyzed using one-way analysis of variance (ANOVA) tests and Bonferroni corrections for multiple comparisons to control using SPSS version 11.5 software (SPSS Inc., Chicago, IL, USA). A significance level (a P-value) of 5% was used throughout.
Results
Detection of RG-I surface nanocoating
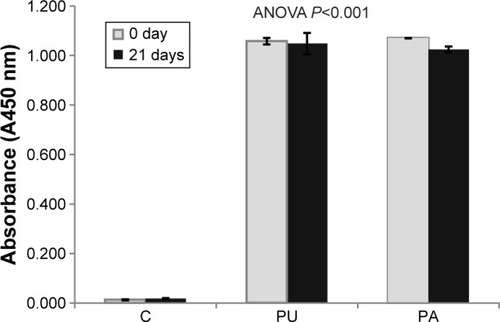
The RG-I PU and PA were detected before in vitro tests and after 21 days of cell culture. The results showed presence of the nanocoating with PU and PA with colorimetric staining, while on the control surface without the nanocoating, the absorbance was close to zero (). After 21 days of cell culture, the results still showed presence of PU and PA, but with lower amount than before the in vitro test.
Figure 2 Presence of the nanocoating with PU and PA with immunofluorescence staining using anti-(1→4)-β-galactan LM5 and Anti-rat IgG (whole molecule)–alkaline phosphatase antibody.
Note: The results represent absorbance values measured at 450 nm before in vitro test and after 21 days of WT cell culture.
Abbreviations: ANOVA, analysis of variance; IgG, immunoglobulin G; PA, potato dearabinanated; PU, potato unmodified; WT, wild-type mice primary osteoblast from calvariae; LM, lyphophilized rat monoclonal protein-G; C, control tissue culture polystyrene surface.
In vitro studies
The in vitro results will be presented only for one sample of WT cells as a significant difference was not found between WT1 and WT2.
Cell morphology
The WT and MC3T3-E1 cell morphology investigated with light microscopy showed osteoblastic cells with spread-out morphology when cultured on both noncoated and RG-Is-nanocoated surfaces after 24, 48, and 72 hours. No difference in cell morphology was observed between the control TCPS-, PA-, and PU-coated surfaces.
Proliferation
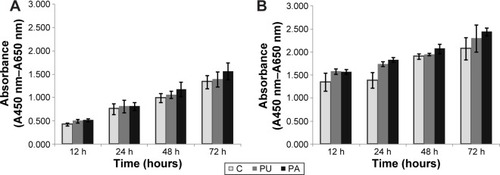
RG-I coating did not influence the proliferation of MC3T3-E1 and primary osteoblasts as compared to the uncoated controls after 12, 24, 48, and 72 hours (). The proliferation of WT and MC3T3-E1 cells increased over time from 12 to 72 hours, reaching the highest value at 72 hours. The proliferation of WT cells at PA was higher than at PU, and proliferation at PU was higher than at the control TCPS surface in each period of time, 12, 24, 48, and 72 hours. The difference in proliferation rate over time was observed between the cell line MC3T3-E1 and WT cells. The highest amount of proliferating cells was detected in the MC3T3-E1 culture and the lowest in WT primary cell culture.
Figure 3 Proliferation activity of WT cells (A) and osteoblastic cells MC3T3-E1 (B) measured by the colorimetric method using BrdU after 12, 24, 48, and 72 hours (mean ± SEM, n=6).
Notes: The results represent absorbance values measured at 450 nm against the background control wells using 650 nm as a reference. ANOVA tests and Bonferroni corrections were performed for multiple comparisons. A significance level of 0.05 was used throughout the study. There was no significant difference between tested (PU and PA) and C samples.
Abbreviations: ANOVA, analysis of variance; BrdU, bromodeoxyuridine; C, control TCPS; h, hour; PA, potato dearabinanated; PU, potato unmodified; RG-I, rhamnogalacturonan-I; SEM, standard error of the mean; TCPS, tissue culture polystyrene surface; WT, wild-type mice primary osteoblast from calvariae.
Cell cycle analysis (FACS)
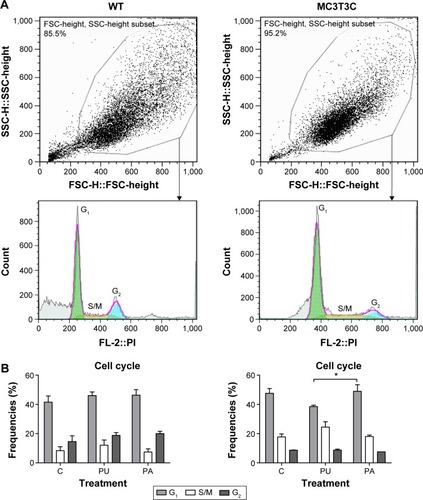
Cell cycle analysis using flow cytometry did not show significant differences in the percentages of MC3T3-E1 and WT cells in G1, S/M, and G2 phases on PU and PA compared to TCPS control after 72 hours. A significant increase in the cell frequencies (%) was found in G1 phase in MC3T3-E1 cells cultured at PU-coated surface compared to PA-coated surfaces (P≤0.05; ).
Figure 4 Cell cycle analysis of MC3T3-E1 and WT cells cultured on PU, PA, and uncoated TCPS (control) after 72 hours.
Notes: (A) Representative diagrams of osteoblastic MC3T3-E1 and WT cells. (B) Frequencies (%) of MC3T3-E1 and WT cells in G1, S/M, and G2 phases (mean ± SEM, n=6). ANOVA tests and Bonferroni corrections were performed for multiple comparisons. A significance level of 0.05 was used throughout the study. There was no significant difference between tested (PU and PA) and C samples. Significant difference between PU and PA: *P<0.05.
Abbreviations: ANOVA, analysis of variance; C, control TCPS; PU, potato unmodified RG-I; PA, potato dearabinanated RG-I; RG-I, rhamnogalacturonan-I; SEM, standard error of the mean; TCPS, tissue culture polystyrene surface; WT, wild-type mice primary osteoblast from calvariae; SSC, side scatter; FSC, forward scatter; FL, fluorescence; PI, propidium iodide.
Mineralization
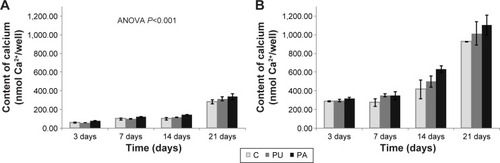
The mineralization assay showed no significant increase in matrix deposition for cells cultured on surfaces coated with PU and PA compared to control TCPS for MC3T3-E1 and WT after 3, 7, 14, and 21 days. The mineralization results, for both WT and MC3T3-E1, showed increase of mineralized matrix over time, and the highest amount was observed after 21 days. The amount of mineralized matrix was higher in MC3T3-E1 compared to WT cells ().
Figure 5 Relative mineralization of ECM, measured by an AR-S staining assay after 7 days (mean ± SEM, n=6).
Notes: Results in nmol Ca2+ AR-S correspond to amount of AR-S bound to 2 mol Ca2+/mol of dye in solution. ANOVA tests and Bonferroni corrections were performed for multiple comparisons. A significance level of 0.05 was used throughout the study. There was no significant difference between tested (PU and PA) and C samples in WT cells (A) and MC3T3-E1 osteoblastic cells (B) cultured on plates coated with PU, PA, and C.
Abbreviations: ANOVA, analysis of variance; AR-S, Alizarin Red-S; C, control TCPS; ECM, extracellular matrix; PU, potato unmodified RG-I; PA, potato dearabinanated RG-I; RG-I, rhamnogalacturonan-I; SEM, standard error of the mean; TCPS, tissue culture polystyrene surface; WT, wild-type mice primary osteoblast from calvariae.
Gene expression
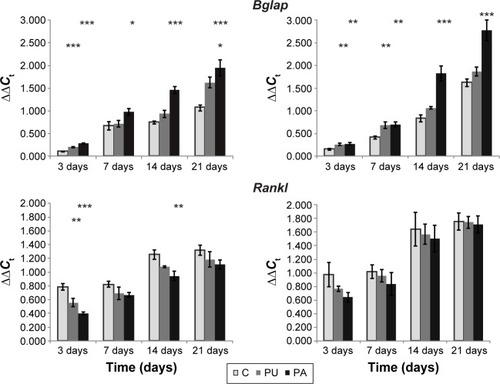
The real-time PCR results of gene expression measured at different end points (3, 7, 14, and 21 days) are shown in . Gene expression of Runx2, Col1a1, Alpl, Bglap, and Rankl was measured as they increased over time, from 3 to 21 days.
Figure 6 Real-time PCR measurements of the gene expression of Runx2, Col1a1, Alpl, Bglap, and Rankl in WT cells (A) and MC3T3-E1 osteoblastic cells (B) cultured on plates coated with PU, PA, and C.
Notes: Values on the y-axis represent amplification efficiency (∆∆Ct). Results are mean ± SEM of six independent. ANOVA tests and Bonferroni corrections were performed for multiple comparisons. A significance level of 0.05 was used throughout the study. Significant difference between C and tested samples (PU and PA): *P<0.05; **P<0.01; ***P<0.001.
Abbreviations: ANOVA, analysis of variance; Alpl, alkaline phosphate; Bglap, osteocalcin; Col1a1, collagen type-1; C, control TCPS; PCR, polymerase chain reaction; PA, potato dearabinanated RG-I; PU, potato unmodified RG-I; RG-I, rhamnogalacturonan-I; Rankl, receptor activator for nuclear factor; Runx2, osteoblast transcription factor (runt-related gene 2); SEM, standard error of the mean; TCPS, tissue culture polystyrene surface; WT, wild-type mice primary osteoblast from calvariae.
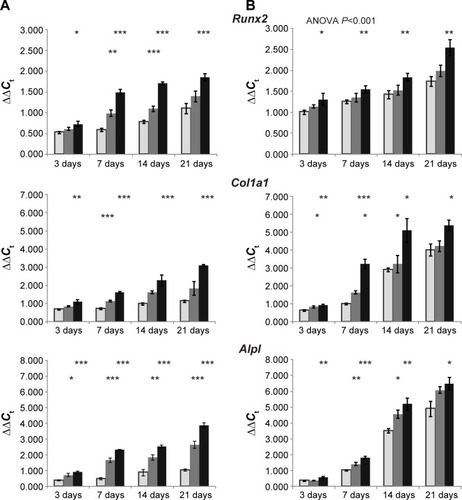
Runx2 expression in MC3T3-E1 and WT cultured at PU- and PA-coated surfaces was significantly different compared to control TCPS at different time points, as illustrated in . In MC3T3-E1 and WT cells cultured on surface coated with PA, Runx2 expression after 3, 7, 14, and 21 days was significantly upregulated compared to control TCPS (WT: P≤0.05 after 3 days, P≤0.001 after 7, 14, and 21 days; MC3T3-E1: P≤0.05 after 3 days, P≤0.01 after 7, 14, and 21 days). On the surface coated with PU, Runx2 expression was significantly upregulated after 7 and 14 days in WT cell culture compared to control TCPS (P≤0.05 after 3 days, P≤0.001 after 14 days). The expression of Runx2 was the highest in MC3T3-E1 and WT cell cultures at the surface coated with PA and was the lowest on the control TCPS.
In general, Col1a1, Alpl, and Bglap expressions at different time points (3, 7, 14, and 21 days) were the highest at PA-coated surface in MC3T3-E1 and WT cell cultures. Expression of Col1a1, Alpl, and Bglap in MC3T3-E1 and WT cells cultured at PU was lower than those cultured at PA, but higher than at control TCPS surface.
The Col1a1 in WT cell culture was found to be expressed significantly higher (P≤0.01 after 3 days, P≤0.001 after 7, 14 and 21 days) at PA compared to control TCPS. The Col1a1 in MC3T3-E1 cell culture was found to be expressed significantly higher (P≤0.01 after 3 days, P≤0.001 after 7 days, P≤0.05 after 14 and 21 days) at PA compared to control TCPS. For PU-coated surface, the Col1a1 expression was significantly higher (P≤0.001) after 7 days in the WT cell culture. In MC3T3-E1, the gene expression was significantly higher after 3, 7, and 14 days (P≤0.05).
The Alpl in WT cell culture was significantly higher (P≤0.001) at PA compared to control TCPS at each time end point. Alpl expression in MC3T3-E1 cell culture was significantly higher (P≤0.01 after 3 and 14 days, P≤0.001 after 7 days, P≤0.05 after 21 days) at PA compared to control TCPS. For PU-coated surface, the Alpl expression in WT cell culture was significantly higher (P≤0.05 after 3 days, P≤0.001 after 7 and 21 days, and P≤0.01 after 14 days) compared to control TCPS. In MC3T3-E1 cell culture at PU-coated surface, the Alpl expression was significantly higher (P≤0.01 after 7 days and P≤0.05 after 14 days) compared to control TCPS.
Bglap expression in WT cell culture at PA was significantly higher (P≤0.001 after 3, 14, and 21 days and P≤0.05 after 7 days) compared to control TCPS. In MC3T3-E1, Bglap expression at PA-coated surface was significantly higher (P≤0.01 after 3 and 7 days and P≤0.001 after 14 and 21 days). The expression of Bglap in WT cell culture at PU-coated surface was significantly higher after 3 (P≤0.001) and 21 days (P≤0.05) compared to control TCPS. The expression of Bglap in MC3T3-E1 cell culture at PU-coated surface was significantly higher after 3 and 7 days (P≤0.01) compared to control TCPS.
Rankl expression in WT cell culture was found to be significantly lower (P≤0.001 after 3 days and P≤0.01 after 14 days) at PA compared to control TCPS. The expression of Rankl in MC3T3-E1 cells was not found to be significantly lower at PA compared to control TCPS. For PU-coated surface, the Rankl expression was significant lower (P≤0.01) after 3 days in WT cell culture. In MC3T3-E1, no significant difference in gene expression was observed between PU and control TCPS.
Discussion
The aim of this study was to evaluate in vitro the effect of nanocoating of polystyrene surfaces with pectin RG-I from potato on osteoblasts with respect to their osteogenic response. To test the hypothesis of our studies that galactose side chain of RG-I will promote osteoblasts to produce mineralized matrix, analysis of enzymatically modified RG-I was included.
Our results demonstrate that osteoblasts are sensitive to surface modification of RG-Is coating. The cells cultured on surfaces coated with RG-Is containing higher amount of galactose produced higher level of mineralized matrix compared with controls. Furthermore, increased level of gene expression of Runx2, Col1a1, Alpl, and Bglap and decreased level of Rankl were detected in cells cultured on surfaces coated with RG-Is, PU, and PA.
In general, the difference between PU and modified RG-I, PA was reflected by the sugar composition.Citation24 Chemical components of the RG-I structure influenced osteoblast activity, which is in agreement with other studies.Citation13–Citation15,Citation22,Citation25,Citation26 Our findings support results from earlier studies, indicating that surfaces coated with RG-I containing short arabinan side chains and high amount of galactose enhance fibroblast and osteoblast cells spreading and growth, in contrast to the RG-I with high amount of arabinose, which led to aggregation and decreased proliferation.Citation15 In this study, we proved that high content of galactose, present in PA and PU, promoted osteoblasts to produce mineralized matrix. Our finding is also in agreement with previous studies performed at polystyrene and titanium surfaces showing that RG-Is with higher amount of galactose side chains activated human osteoblast-like cells, SaOS-2, to mineralize.Citation24,Citation25,Citation27 In this study, osteoblast-like cells, MC3T3-E1, and primary WT osteoblasts from mice were used to confirm the hypothesis that galactose stimulates the mineralization process at different end points.
The highest proliferation (BrdU) of MC3T3-E1 and WT cells at different end points was reported on PA-coated surface with high content of galactose. However, the results of FACS analysis showed that PU and PA did not significantly influence MC3T3-E1 and WT cell cycle progression compared to cells cultured on TCPS control. Proliferation (BrdU) of MC3T3-E1 and WT cells at different end points was reported to be the highest on PA with high content of galactose. These results are the first to show the RG-Is effect on osteoblast proliferation measured with BrdU assay and cell cycle analysis (FACS analysis). Kokkonen et alCitation14 investigated the effect of RG-Is from apple on MC3T3-E1 cell number and morphology. The findings showed an increase in the number of cells and more spread morphology at surfaces coated with the RG-Is with shorter side chains of arabinose compared to the surface coated with RG-I with longer side chains of arabinose.Citation26
The direct contact between RG-I side chains and the cells might affect cell behavior.Citation25 Adhesion of the cells promotes proliferation and further differentiation.Citation8,Citation14 Our findings indicate that RG-Is coating might promote adhesion of the cells, resulting in an increase in proliferation and differentiation. Adhesion of the cells to the surface is the first step in osseointegration, which initiates cell growth and differentiation.Citation19 A mutual relationship between cell growth and progression of events associated with osteoblast differentiation and matrix formation and maturation can be observed by measuring gene expression levels in real-time PCR. The gene expression has been supplemented in our study with colorimetric assay (AR-S) to analyze mineralization process by measuring mineralized matrix formation. Gene expression and mineralization were examined at different time points (3, 7, 14, and 21 days) to identify behavior of osteoblasts during the whole osteoblast lineage. The selection of time points was based on our own experience and other studies.Citation28 The results of mineralization showed an increase in matrix deposition for cells cultured on surfaces coated with PA and PU compared to control after 3, 7, 14, and 21 days, but a significant difference was not found. The AR-S assay, based on our experience, is rather suitable for quality than for quantity evaluation. Cells cultured on PU- and PA-coated surface created hard and condensed calcium deposits, which were difficult to access and penetrate for AR-S to stain. Therefore, other methods to quantify the mineralized matrix deposition should be included in the study. Gene expression is one of the most reliable methods to identify and characterize activity during the whole osteoblast lineage.Citation19 The selection of genes for monitoring should be well-defined based on the aims of the study. Therefore, we selected genes related to matrix formation (Col1a1), matrix maturation (Alpl), and matrix mineralization (Bglap).Citation29 Furthermore, we selected Runx2 expressed during the whole osteoblast lineage, from pluripotent stem cells to a stage of immature osteoblasts. Rankl produced by osteoblast in late stage of mineralization activating osteoclast was selected to investigate if the nanocoating is inhibiting the bone resorption by osteoclast.Citation30,Citation31 We found Runx2 to be upregulated after 3, 7, 14, and 21 days at the surface coated with both PU and PA, which leads to the conclusion that RG-Is influenced cell activity in the early stage itself, shortly after adhesion to the coated surface. This finding is important as Runx2 is able to upregulate expression of genes involved in matrix formation, maturation, and mineralization, such as Col1a1, Alpl, osteopontin, bone sialoprotein, and Bglap.Citation30 In our studies, expression of Col1a1, Alpl, and Bglap have been increased at the surface coated with PU and PA compared to control after 3, 7, 14, and 21 days. This is in agreement with results from a study by Gurzawska et al,Citation25 which showed higher expression of Col1a1, Alpl, and Bglap at the surface coated with RG-I from lupin unmodified, characterized with high content of galactose after 3 days. However, these genes have been measured only at one time point, while in this study four time points (3, 7, 14, and 21 days) were investigated, confirming that RG-Is coating activates osteoblast differentiation at different stages. This is the first study which analyzed the influence of RG-Is coating at different time points using two types of osteoblasts, MC3T3-E1 and primary osteoblast from mice. Our findings showed that PU and PA coating improved osteoblast proliferation, matrix formation, maturation, and mineralization, which may influence bone healing and osseointegration of the implants. In addition, our studies showed that the PU and PA coating downregulated Rankl compared to control at different time points, which is a crucial finding in relation to bone-resorbing osteoclasts. The Rankl expression results have revealed that RG-Is decreased receptor activator Rankl secretion in osteoblasts, suggesting a role in the osteoblast-induced inhibition of osteoclast differentiation. The inhibition of Rankl might prolong the osteoblast activity; however, it should be expressed to keep the bone remodeling in balance.Citation32
The in vitro results revealed that RG-Is coating stimulated the osteoblast activity and suggested that the chemical structure of the molecule might modulate the cell response. Nanocoating with PA with a higher content of galactose influenced higher proliferation (BrdU), mineralized matrix formation (AR-S), and Runx2, Col1a1, Alpl, and Bglap expression compared to PU nanocoating.Citation24 It has previously been indicated that RG-I with high amounts of galactose enhanced cell spreading and growth, in contrast to the RG-I with high amounts of arabinan, which lead to aggregation and decreased proliferation.Citation13–Citation15,Citation22,Citation26 Our findings support our hypothesis that linear 1.4-linked galactans might be important for osteoblast differentiation, which has also been proposed in previous studies.Citation24 Galectin-3 is present in the membrane of osteoblastic cells, which specifically binds to galactose residues, and it can therefore be speculated that the interaction with the RG-I galactans is mediated through galectin-3.Citation33,Citation34 However, the hypothesis of linear 1.4-linked galactans influencing osteoblast behavior should be confirmed using other in vitro assays (protein expression) and microscopic investigations (immunofluorescence staining).
In summary, our in vitro results showed an increase in proliferation, mineralization, and gene expression in osteoblasts cultures on surfaces coated with RG-Is, particularly modified RG-I with high content of galactose.
Conclusion
The nanocoating with unmodified and enzymatically modified pectin RG-I from potato influenced osteoblast proliferation, mineralization, and gene expression. The results enriched the knowledge about RG-Is effect on osteoblast behavior at different time points. The structural properties of RG-Is have an influence on different cell responses, and further investigations about linear 1.4-linked galactans should be performed.
Our results showed that the RG-Is nanocoating might have the potential for further improvement of bone healing and osseointegration.
Acknowledgments
The project has been supported by Marie Skłodowska-Curie grant (FP-7 # 290246). The authors thank RAPID (Rheumatoid Arthritis and Periodontal Inflammatory Disease) research group for providing support in performing experiments, and Bodil Jørgensen and Pete Ulvskov from University of Copenhagen for providing RG-Is.
Disclosure
The authors report no conflicts of interest in this work.
References
- MorraMBiochemical modification of titanium surfaces: peptides and ECM proteinsEur Cell Mater20061211516865661
- AlbrektssonTWennerbergAOral implant surfaces: part 1 – review focusing on topographic and chemical properties of different surfaces and in vivo responses to themInt J Prosthodont200417553654315543910
- de JongeLTLeeuwenburghSCWolkeJGJansenJAOrganic–inorganic surface modifications for titanium implant surfacesPharm Res200825102357236918509601
- GurzawskaKSvavaRJørgensenNRGotfredsenKNanocoating of titanium implant surfaces with organic molecules. Polysaccharides including glycosaminoglycansJ Biomed Nanotechnol2012861012102423030010
- Le GuéhennecLSoueidanALayrollePAmouriqYSurface treatments of titanium dental implants for rapid osseointegrationDent Mater200723784485416904738
- MeirellesLCurrieFJacobssonMAlbrektssonTWennerbergAThe effect of chemical and nanotopographical modifications on the early stages of osseointegrationInt J Oral Maxillofac Implants200823464164718807559
- MeirellesLMelinLPeltolaTEffect of hydroxyapatite and titania nanostructures on early in vivo bone responseClin Implant Dent Relat Res200810424525418384406
- MendoncaGMendoncaDBAragaoFJCooperLFAdvancing dental implant surface technology – from micron- to nanotopographyBiomaterials200829283822383518617258
- WennerbergAAlbrektssonTEffects of titanium surface topography on bone integration: a systematic reviewClin Oral Implants Res200920Suppl 417218419663964
- WennerbergAAlbrektssonTOn implant surfaces: a review of current knowledge and opinionsInt J Oral Maxillofac Implants2010251637420209188
- WennerbergAAlbrektssonTAnderssonBAn animal study of c.p. titanium screws with different surface topographiesJ Mater Sci Mater Med199565302309
- WennerbergAJimboRStubingerSObrechtMDardMBernerSNanostructures and hydrophilicity influence osseointegration: a biomechanical study in the rabbit tibiaClin Oral Implants Res20132591041105023782316
- BussyCVerhoefRHaegerAModulating in vitro bone cell and macrophage behavior by immobilized enzymatically tailored pectinsJ Biomed Mater Res A200886359760618004795
- KokkonenHEIlvesaroJMMorraMScholsHATuukkanenJEffect of modified pectin molecules on the growth of bone cellsBiomacromolecules20078250951517291075
- NagelMDVerhoefRScholsHEnzymatically-tailored pectins differentially influence the morphology, adhesion, cell cycle progression and survival of fibroblastsBiochim Biophys Acta200817807–8995100318485917
- BrandleyBKSchnaarRLCell-surface carbohydrates in cell recognition and responseJ Leukoc Biol1986401971113011937
- HeinegårdDConnective tissue as the environment receiving tissue implantsBranemarkP-IChienSGröndahlHGRobinsonKThe Osseointegration BookBerlin, GermanyQuintessence Publishing Co. Inc.2005143147
- HuhJEYangHRParkDSPuerariae radix promotes differentiation and mineralization in human osteoblast-like SaOS-2 cellsJ Ethnopharmacol2006104334535016455216
- SteinGSLianJBMolecular mechanisms mediating proliferation/differentiation interrelationships during progressive development of the osteoblast phenotypeEndocr Rev19931444244428223340
- FranceschiRTThe developmental control of osteoblast-specific gene expression: role of specific transcription factors and the extracellular matrix environmentCrit Rev Oral Biol Med1999101405710759426
- KrauseCde GorterDJJKarperienMDijkePSignal transduction casacades controlling osteoblasts differentiationCliffordJRPrimer on the Metabolic Bone Diseases and Disorders of Mineral Metabolism7Washinghton, DCAmerican Society of Bone and Mineral Research20081016
- MorraMCassinelliCCascardoGEffects on interfacial properties and cell adhesion of surface modification by pectic hairy regionsBiomacromolecules2004562094210415530022
- BygIDiazJØgendalLHLarge-scale extraction of rhamnogalacturonan I from industrial potato wasteFood Chem2012131412071216
- GurzawskaKSvavaRYihuaYOsteoblastic response to pectin nanocoating on titanium surfacesMater Sci Eng C Mater Biol Appl20144311712525175196
- GurzawskaKSvavaRSybergSEffect of nanocoating with rhamnogalacturonan-I on surface properties and osteoblasts responseJ Biomed Mater Res A2012100365466422213456
- KokkonenHCassinelliCVerhoefRMorraMScholsHATuukkanenJDifferentiation of osteoblasts on pectin-coated titaniumBiomacromolecules2008992369237618680340
- SvavaRGurzawskaKYihauYThe structurally effect of surface coated rhamnogalacturonan I on response of the osteoblast-like cell line SaOS-2J Biomed Mater Res A201410261961197123852647
- ByersBAPavlathGKMurphyTJKarsentyGGarciaAJCell-type-dependent up-regulation of in vitro mineralization after overexpression of the osteoblast-specific transcription factor Runx2/CbfalJ Bone Miner Res200217111931194412412799
- JonasonJHO’KeefeRJIsolation and culture of neonatal mouse calvarial osteoblastsMethods Mol Biol2014113029530524482182
- NeveACorradoACantatoreFPOsteoblast physiology in normal and pathological conditionsCell Tissue Res2011343228930221120535
- GurzawskaKANanocoating of Implant Surfaces with Pectin Rhamnogalacturonan-ls, Review and In Vitro Studies [PhD thesis]Copenhagen, DenmarkFaculty of Health and Medical Sciences, University of Copenhagen2013
- RucciNMolecular biology of bone remodellingClin Cases Miner Bone Metab200851495622460846
- GaoXZhiYSunLThe inhibitory effects of a rhamnogalacturonan I (RG-I) domain from ginseng pectin on galectin-3 and its structure-activity relationshipJ Biol Chem201328847339533396524100038
- GunningAPBongaertsRJMorrisVJRecognition of galactan components of pectin by galectin-3FASEB J200923241542418832596