Abstract
Patients with sickle cell disease (SCD) are often treated with opioids for severe pain. Although opioids are known to have renal-specific effects, their role in nephropathy in SCD remains unknown. Because a subset of patients receives opioids for long periods of time, we examined the influence of chronic morphine treatment on mice with pre-existing renal disease expressing varying amounts of sickle hemoglobin. Morphine treatment for 3–6 weeks resulted in a variety of defects in renal morphology observed using light and electron microscopy. Notably, morphine induced glomerular pathology, resulting in increased glomerular volume, mesangial expansion, mesangial cell proliferation, parietal cell metaplasia, podocyte effacement, and microvillus transformation. Cystic tubulopathy and hemeoxygenase-1 expression and activity were also increased in morphine-treated mice. Naloxone, a non-selective opioid receptor (OR) antagonist, ameliorated these effects. Functionally, the urine albumin to creatinine ratio was increased following acute as well as chronic morphine treatment. These results suggest that clinically relevant doses of morphine induce renal pathology and that OR antagonists may be effective for ameliorating morphine-induced renal disease.
Introduction
Sickle nephropathy is recognized as a devastating manifestation of sickle cell disease (SCD).Citation1 Although the pathophysiology of sickle nephropathy is not completely understood, potential etiologic factors include the mechanical effects of red blood cell (RBC) sickling, hyperfiltration, oxidant-mediated damage, and unintended side effects related to medical therapies.Citation2–Citation4 Sickle patients commonly use opioids long-term due to “crises” and chronic pain treatment;Citation5 these patients often require higher doses than those with other diseases due to alterations in drug pharmacokinetics and metabolism as well as increased renal clearance.Citation6 Via opioid receptors (ORs), opioids induce kidney disease in rodents.Citation7–Citation9 Thus, opioids may exacerbate renal disease during SCD. However, the effect of opioid use on kidney disease remains unknown.
Opioids act via three well-defined G-protein coupled receptors (GPCRs): mu-, delta-, and kappa-opioid receptors (MOR, DOR, and KOR, respectively), as well as other undefined receptors. In addition to analgesia induction, opioids activate growth, survival, and cytoprotection via ORs in multiple cell types in peripheral organs and in the central nervous system (CNS).Citation10–Citation12 An association between morphine and renal disease was first identified more than three decades ago when heroin-associated nephropathy was recognized in chronic drug abusers, implicating morphine (a metabolite of heroin) as a possible etiologic agent.Citation13 Our previous study showed that chronic administration of morphine, a MOR agonist, in clinically relevant doses results in significant glomerular pathology, including mesangial growth, glomerular enlargement, and increased proteinuria in tumor-bearing and wild-type (WT) mouse kidneys.Citation8,Citation9 Earlier studies from other laboratories revealed that morphine directly stimulates mesangial cell, medullary interstitial cell, and fibroblast proliferation in vitro.Citation14–Citation16 These data indicate that morphine inadvertently promotes renal disease in SCD. We therefore examined whether morphine adversely affects renal morphology and function in the kidneys of transgenic sickle mice with the long-term goal of developing strategies for preventing, treating, or delaying nephropathy onset in SCD patients.
Materials and methods
Mice
All mouse studies were performed with prior approval from the Institutional Animal Care and Use Committee (#0806A37663).
We used three transgenic murine models expressing human sickle hemoglobin to determine whether the effect of morphine on the kidney is strain-specific and/or influenced by the variability of sickle hemoglobin expression. NY1DD mice exhibit a very mild (and non-hemolytic and non-anemic) phenotype, are homozygous for deletion of murine β-globin, and carry a single copy of linked transgenes for human α- and βS-globins. These mice have a C57BL/6 genetic background.Citation17 WT C57BL/6 mice were used as controls for NY1DD. BERK mice are homozygous for knockout of both murine α and β globins and carry a single copy of linked transgenes for human α̣ and βS globins. Therefore, BERK mice express human α̣ and βS globin chains (ie, human hemoglobin S), but no murine α̣ or β globins.Citation18 These mice have severe disease resembling human sickle cell anemia, exhibiting hemolysis, reticulocytosis, anemia, extensive organ damage, and a shortened life span. hBERK1 mice are homozygous for knockout of murine α̣ globin, hemizygous for knockout of murine β globin, and carry a single copy of linked transgenes for human α̣ and βS globins.Citation18 hBERK1 mice express the globin chains human α, human βS, and murine β (human hemoglobin S and hybrid human α/mouse β hemoglobin) and show renal pathology.Citation19 Both BERK and hBERK1 have the same mixed genetic background and can be bred as littermates. Control hemoglobin A (HbA)-BERK mice have the same mixed background as BERK and hBERK1, but exclusively express human α̣ and βA globins (thus, normal human hemoglobin A), but no murine α or β globins.Citation18 Mice were bred in a pathogen-free facility, maintained under controlled environmental conditions (12-hour light–dark cycle, 23°C), and were genotyped and phenotyped using isoelectric focusing and, when necessary, real-time polymerase chain reaction to identify the transgene number.
Drugs and treatments
Sickle hemoglobin-expressing mice with pre-existing renal pathology and their controls were treated with vehicle (phosphate-buffered saline [PBS]) or morphine for 3 and 6 weeks, with or without coadministration of the OR antagonist naloxone. Injectable morphine sulfate and naloxone were obtained from Baxter Esilerderle Healthcare (Cherry Hill, NJ) and Hospira Inc (Lake Forest, IL), respectively. Each day, mice were injected subcutaneously with increasing doses of pharmacological grade morphine (0.75, 1.4, 2.14, 2.8, 3.6, and 4.3 mg/kg/day in two divided doses during the 1st, 2nd, 3rd, 4th, 5th, and 6th weeks, respectively, which is equivalent to approximately 50–301 mg/70 kg human/day). Naloxone was used in a dose equivalent to 10 mg/70 kg/day. Sex- and age-matched mice were treated with PBS. Mice were treated for a total of 3 or 6 weeks, and euthanized at the end of treatment using CO2. Kidneys were excised, weighed, and processed for analysis.
Histology
Formalin-fixed, paraffin-embedded kidney sections were cut at 4 μm and stained with (i) Periodic acid–Schiff (PAS) stain and counterstained with hematoxylin, and (ii) hematoxylin and eosin (H&E) and analyzed by a renal pathologist in a double-blind manner. Images were visualized using a Zeiss AXIOPHOT microscope (Carl Zeiss Microscopy, LLC, Thornwood, NY) with a 10× eyepiece and a 40× or 100× objective. Photographs were acquired using an Olympus DP70 camera and 160ME digital camera interface using Olympus DP Manager version 3-11288 (Olympus Corporation, Tokyo, Japan).
Electron microscopy
Kidney sections were collected in 4% formaldehyde and 1% glutaraldehyde, washed in PBS, placed in osmium for 90 minutes, washed in acetone, embedded in epon, and dried overnight. One-micron-thin sections stained with methylene azure II blue were evaluated using light microscopy to select blocks for electron microscopy. Selected blocks were cut in 500-nM thick sections using a diamond knife, placed on a wire grid, stained with uranyl acetate and lead citrate, and evaluated on a JEM 1011 electron microscope (JEOL, Tokyo, Japan). Electron micrographs were acquired using the built-in camera.
Glomerular volume measurement
Morphometric analysis was performed on 4-μm PAS-stained kidney sections and based on the method of point counting as described previously.Citation9 Thirty glomeruli were counted for each kidney. The area of the entire glomerulus, including the glomerular tuft, the urinary space, and the Bowman’s capsule was included for volume estimation.
Urine albumin and creatinine
Urine albumin and creatinine were analyzed using the Assay- Max Mouse Albumin ELISA Kit (catalog no EMA3201-1, AssayPro, St Charles, MO) and the Creatinine assay kit (Cayman Chemicals, Ann Arbor, MI), respectively, according to the manufacturers’ instructions.
Northern analysis of heme oxygenase 1 (HO-1) mRNA expression
HO-1 mRNA expression in the kidney was assessed using Northern analysis as described previously.Citation20 Briefly, RNA was extracted from the kidneys using the Trizol method, separated on an agarose gel, and transferred to a nylon membrane. The membrane was hybridized overnight with a 32P-labeled human HO-1 cDNA probe. Densitometry of the autoradiogram was performed and standardized by factoring optical density of HO-1 with the optical density of the 18S rRNA. Optical density of the 18S rRNA was obtained from a negative of the ethidium bromide-stained nylon membrane.
Measurement of renal HO activity
HO activity was assessed by measuring the rate of bilirubin generation by microsomes prepared from kidneys as described previously.Citation21 Briefly, microsomes were incubated with mouse liver cytosol (a source of biliverdin reductase), hemin (20 μM), glucose-6-phosphate (2 mM), glucose-6- phosphate dehydrogenase (4 U/mL), and NADPH (0.8 mM) for 90 minutes at 37°C in the dark. Bilirubin was extracted using chloroform; the difference in optical density (OD) at 464–530 nm (extinction coefficient, 40 mM/cm for bilirubin) was measured, and enzyme activity was determined (pmol-bilirubin formed/h/mg protein).
Data and statistical analysis
Data are expressed as the mean ± standard deviation (SD) or standard error of the mean (SEM). One-way analysis of variance (ANOVA) with Tukey’s post-test or Student’s t-test, as applicable, was performed using GraphPad Prism version 5.04 for Windows (GraphPad Software, Inc, La Jolla, CA). Because of unequal sample sizes and multiple groups, Tukey’s post-test was selected for analysis. Statistical significance was defined as P < 0.05.
Results
Mouse models of kidney disease in SCD
We used three transgenic mouse models exhibiting kidney abnormalities characteristic of human SCD and expressing varying levels of sickle hemoglobin (HbS). Mouse models used included hBERK1 (~26% HbS), NY1DD (~40% HbS), and BERK (~99% HbS).Citation17–Citation23 Age- and sex-matched control WT C57BL/6 mice (0% HbS) were on the same genetic background as NY1DD and HbA-BERK mice (0% HbS) were on the same mixed genetic background as hBERK1 and BERK (littermates). HbA-BERK mice express normal human HbA. hBERK1 mice were used, although these mice express lower levels of HbS because they develop kidney disease and pain.Citation19,Citation22–Citation24 Morphine-induced renal pathology observed in this study in mice from different genetic backgrounds suggest that these effects are not influenced by the strains of the mice. shows different transgenic mice, controls, and number of mice used in this study.
Table 1 Number of mice for different treatments used in the study
Baseline kidney characteristics of mouse models and controls
As described previously, transgenic sickle mice exhibited pathological abnormalities in kidney tissue as compared to their strain-specific background controls.Citation17–Citation19 HbA-BERK controls exhibited parietal epithelial cell (PEC) metaplasia in many glomeruli, which were larger compared to C57BL/6 controls (not shown) as we previously reported.Citation9 Our previous study showed that the kidneys of untreated C57BL/6 mice showed no pathological abnormalities except for slight hypertrophy of PECs in males and vascular congestion. Citation9 Although tubules in HbA-BERK kidneys were more dilated compared to C57BL/6 kidneys, no vascular congestion was observed (not shown), revealing strain-specific variability.
Morphine treatment alters the histology and ultrastructure of kidneys in sickle mice
All mice were treated with increasing doses of morphine similar to those used in patients with SCD. Mice were treated with vehicle (PBS) or morphine for 3 (NY1DD) and 6 (hBERK1 and BERK) weeks. NY1DD and hBERK1 mice were also treated with or without coadministration of an OR antagonist, naloxone, for 3 and 6 weeks, respectively. The minimum 3-week treatment period was chosen based on our previous study showing that morphine-induced mesangial glomerular volume was optimum 3 weeks after morphine treatment in C57BL/6 mice.Citation9
Light microscopy of transgenic NY1DD sickle mice kidneys
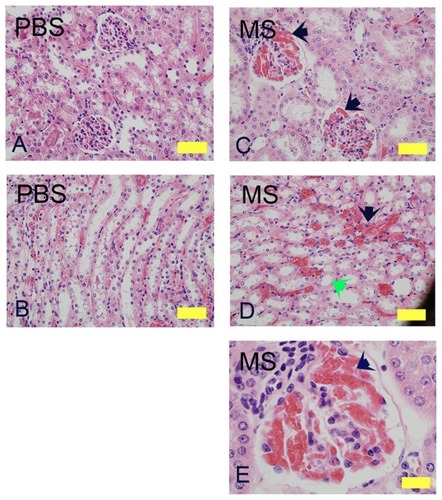
Three weeks of morphine treatment induced glomerular expansion, tubular dilatation, and intraglomerular and peritubular congestion compared to mice treated with PBS (). In the cortico-medullary region, sloughing of epithelial cells and loss of brush border was observed in some morphine-treated but not in PBS-treated mice (, green arrow). A higher magnification image from a morphine-treated mouse kidney shows increased juxtaglomerular cells and extremely high intraglomerular congestion ().
Figure 1 Morphine treatment exacerbates renal pathology in NY1DD mice. H&E stained kidney sections of NY1DD mice treated with morphine for 3 weeks. Cortical and cortico-medullary regions with glomerular and tubular histology are shown. Glomerular and tubular morphology in PBS-treated mouse kidneys (A and B). Note the severe intraglomerular congestion (C and E, black arrows), tubular dilatation and loss of brush border (D, green arrow), and peritubular congestion (black arrow) in morphine-treated mice.
Abbreviations: H&E, hematoxylin and eosin; MS, morphine sulfate, PBS, phosphatebuffered saline.
Light microscopy of transgenic hBERK1 and HBA-BERK mice kidneys
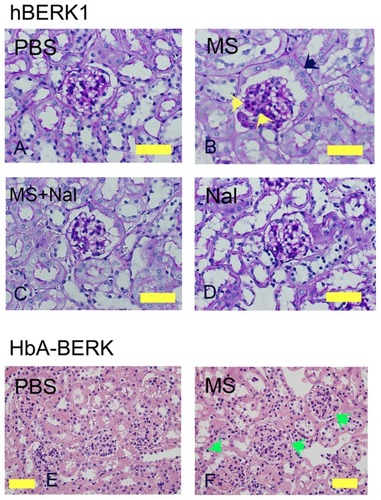
Morphine treatment of hBERK1 for 6 weeks led to alterations similar to those observed in morphine-treated NY1DD mice, except for tubular dilatation, which did not increase upon morphine treatment in hBERK1 mice. As described above, tubules of hBERK1 mice were more dilated than those of NY1DD mice at baseline, perhaps due to strain differences. Increased cellularity of mesangial and juxtaglomerular cells and PEC metaplasia resembling tubular epithelial cells were observed in hBERK1 mice treated with morphine as compared to mice treated with PBS (). Co-treatment with naloxone antagonized morphine-induced pathological changes, suggesting an OR-mediated mechanism (). Naloxone alone did not influence renal pathology in hBERK1 mice (). Control HbA-BERK mice expressing normal human hemoglobin also showed increased glomerular enlargement after 6 weeks of morphine treatment as compared to treatment with PBS (). These data suggest that morphine-induced pathology is independent of the strain of transgenic mice expressing sickle hemoglobin. Furthermore, mice did not develop a tolerance to the effect of morphine in the kidneys even after prolonged treatment for up to 6 weeks.
Figure 2 Morphine treatment exacerbates renal pathology in hBERK1 and HbA-BERK mice. (A–D) PAS-stained kidney sections from hBERK1 mice treated with morphine and/or naloxone for 6 weeks. Note the glomerular enlargement, increased mesangial cell density (black arrow), and parietal cell metaplasia (green arrow) in (B).
Abbreviations: H&E, hematoxylin and eosin; HbA, hemoglobin A; MS, morphine sulfate; Nal, naloxone; PAS, periodic acid-Schiff; PBS, phosphate-buffered saline.
Light microscopy of transgenic BERK mice kidneys
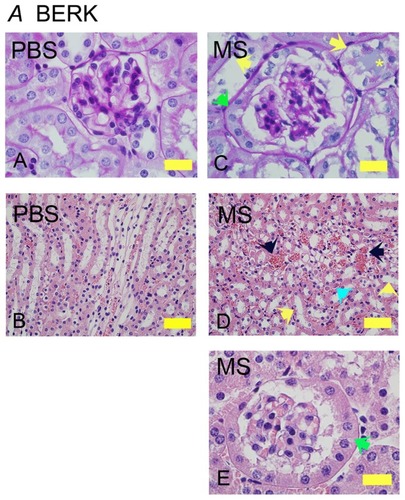
Similar to NY1DD and hBERK1 mice, morphine treatment for 6 weeks resulted in glomerular and tubular changes in BERK mice (). Morphine-treated mice show increased glomerular volume and extremely high PEC metaplasia as compared to PBS-treated BERK mice (, green arrows). Peritubular congestion was remarkably high in morphine-treated mice as compared to PBS-treated BERK mice (, black arrows). Morphine-induced tubular pathology showed epithelial cells sloughing off from the basement membrane, loss of brush border, and proteinaceous deposits (, yellow and turquoise arrows), suggesting tubular injury.
Figure 3 Morphine treatment exacerbates renal pathology in BERK mice. Kidney sections from BERK mice treated with PBS or MS for 6 weeks. (A and C) Glomeruli stained with PAS to show the basement membrane. Note that the tubules in PBS-treated mice are lined with intact epithelium and a brush border. In morphine-treated mice (C), the glomerulus is much larger than that in PBS-treated and shows parietal cell metaplasia (green arrow); tubules show basement membrane without epithelial cells (left yellow arrow) or epithelial cells sloughing off of the basement membrane (right yellow arrow) with a proteinaceous deposit (yellow *). Parietal epithelial cell metaplasia can be seen more prominently at the higher magnification in (E) (green arrow). In (D), the H&E-stained images show prominent vascular congestion (black arrows), early tubular epithelial cell necrosis (left yellow arrow), loss of epithelial cells and brush border (right yellow arrow), and proteinaceous deposits (turquoise arrow).
Abbreviations: H&E, hematoxylin and eosin; MS, morphine sulfate; PAS, periodic acid-Schiff; PBS, phosphate-buffered saline.
Electron microscopy of BERK mice kidneys
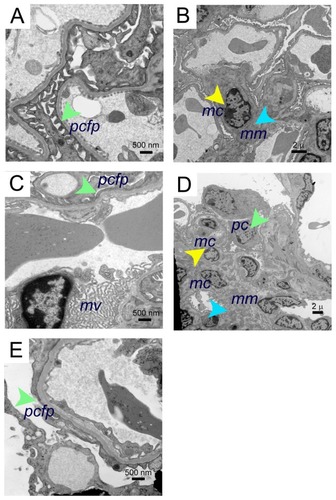
Electron microscopy revealed mild to moderate mesangial prominence, with a mild increase in mesangial cells, slightly increased foot process effacement, prominence of red cell fragments, and electron dense iron deposits in the kidneys of BERK mice treated with morphine for 3 weeks as compared to PBS-treated BERK mice (). Foot processes, the mesangial region containing mesangial cells, and the mesangial matrix appeared to be normal in PBS-treated BERK mice (). Foot process effacement and marked microvillus transformation were accompanied by increased mesangial cell proliferation and mesangial matrix, resulting in an expanded mesangial area without evidence of immune complexes in the kidneys of morphine-treated mice ().
Figure 4 Electron microscopy images of morphine-induced glomerular alterations in BERK-sickle mice. Electron micrographs of kidneys from BERK mice treated with PBS or morphine for 3 weeks. (A and B) Electron micrographs of kidneys from PBS-treated BERK mice. (A) Normal podocyte foot processes (green arrow) and (B), normal mesangial region (mesangial cell, yellow arrow and mesangial matrix, turquoise arrow) in male BERK mice treated with PBS. (C–E) Electron micrographs of BERK mice treated with morphine for 3 weeks. (C) Foot process effacement (green arrow) and marked microvillus (mv) transformation in the kidney of female BERK mice treated with morphine. (D) Marked expansion of mesangial matrix (turquoise arrow), podocyte (green arrow), and increased mesangial cells (yellow arrow), but no immune complexes in the kidneys of male BERK mice treated with morphine. (E) Foot process effacement (green arrow) in the kidney of male BERK mice.
Abbreviations: mc, mesangial cell; mm, mesangial matrix; mv, microvillus; pcfp, podocyte foot processes; PBS, phosphate-buffered saline.
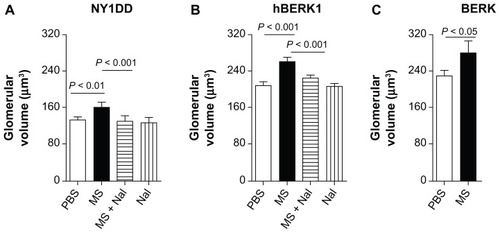
Morphine treatment significantly increased glomerular volume in mouse kidneys. Morphine treatment for 3–6 weeks led to significantly increased glomerular volume in the kidneys of HbS-expressing and HbA-BERK mice as compared to PBS-treated mice (). Glomerular volume increased by 22% in NY1DD mice (P < 0.01) after 3 weeks of morphine treatment and by 26% and 22.5% in hBERK1 mice (P < 0.01) and BERK mice (P < 0.05), respectively, after 6 weeks of morphine treatment as compared to PBS treatment. Naloxone antagonized morphine-induced glomerular enlargement, suggesting an OR-mediated effect ().
Figure 5 Morphine treatment increases glomerular volume. (A–C) Glomerular volume of NY1DD (A), hBERK1 (B), and BERK (C) mice treated with morphine and/or naloxone for 3 or 6 weeks as indicated. Note that morphine stimulates a significant increase in glomerular volume, which is abrogated by co-treatment with naloxone, although naloxone alone did not alter glomerular volume.
Abbreviations: MS, morphine sulfate; Nal, naloxone; PBS, phosphate-buffered saline; SD, standard deviation.
Morphine increases kidney weight in sickle mice
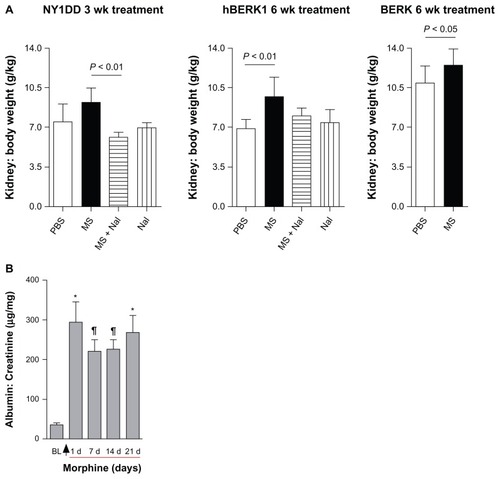
Mice did not show a significant gain or loss in body weight after morphine and/or naloxone treatment as compared to PBS-treated mice (data not shown). Fractional kidney mass increased by 23% in NY1DD mice after 3 weeks of morphine treatment and by 40% in hBERK1 mice after 6 weeks of treatment compared to PBS-treated mice (). Co-treatment with naloxone antagonized this morphine-induced increase in kidney mass, suggesting that morphine acts through an OR-mediated mechanism. Naloxone treatment alone had no significant effect on kidney weight. Morphine treatment also increased kidney weight in BERK mice by 31% after 6 weeks compared to that in PBS-treated mice. No changes in body weight or behavior were associated with morphine treatment as compared to body weight and behavior in PBS-treated mice.
Figure 6 Morphine treatment increases kidney weight and urine albumin. (A) Kidney: body weight ratio of NY1DD, hBERK1, and BERK mice treated with morphine as indicated. (B) NY1DD mice were treated with morphine for 3 weeks. Urine was collected before beginning treatment and periodically following treatment.
Abbreviations: MS, morphine sulfate; Nal, naloxone.
Morphine induces albuminuria
Treatment of NY1DD mice with morphine significantly increased urine albumin to creatinine ratios 24 h after treatment; these values remained increased over a period of 3 weeks (). These data suggest that renal histopathological alterations induced by morphine are associated with functional abnormalities in mice expressing HbS.
Morphine increases heme oxygenase (HO) in the kidney
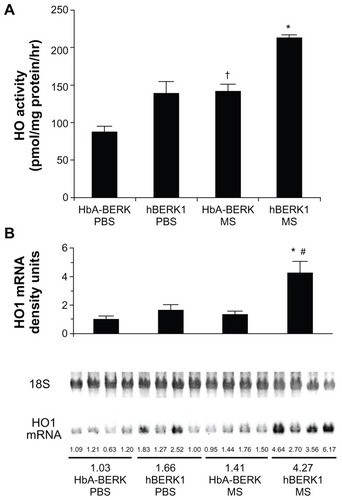
HO-1 is upregulated in the kidneys of mice and humans with SCD,Citation25 and chronic morphine increases HO in the spinal cord and kidney.Citation8,Citation26 Morphine treatment likely further increases HO as a stress response. We therefore examined the effect of chronic morphine treatment on HO activity and HO-1 mRNA expression in hBERK1 mouse kidneys. Treatment with morphine for 3 weeks resulted in a significant increase in HO activity and HO-1 mRNA in hBERK1 kidneys (P < 0.001 and 0.01, for activity and mRNA, respectively, versus PBS []). Similar effects were observed in control HbA-BERK kidneys, suggesting that chronic morphine treatment leads to increased HO activity in the kidneys, irrespective of sickle Hb expression in mice.
Figure 7 Morphine stimulates heme oxygenase (HO) activity and alters kidney function. (A) HO activity in the kidney of HbA-BERK and hBERK1 mice after 3 weeks of morphine treatment. Each bar represents the mean ± SEM of 4 mice/group. *P < 0.001 compared with hBERK1 mice treated with PBS or HbA-BERK mice treated with MS; †P < 0.01 compared with HbA-BERK PBS. (B) HO1 mRNA expression in the kidney of HbA-BERK and hBERK1 mice after 3 weeks of morphine treatment.
Abbreviations: HbA, hemoglobin A; PBS, phosphate-buffered solution; MS, morphine sulfate; HO1, heme oxygenase 1.
Discussion
Nephropathy is a major factor contributing to morbidity in SCD. The present study demonstrates that chronic exposure to morphine promotes renal injury in sickle mice. Additionally, our data show that chronic opioid exposure inadvertently leads to development of renal disease in non-sickle mice in the absence of underlying pathology. We also demonstrate that morphine impairs renal function, in part through histopathologic alterations in the glomerulus. Using two different strains of mice (NY1DD on C57BL/6) and BERK/hBERK1 (on mixed background), we reveal distinguishable features of morphine-induced strain-specificity in the kidney.
Opioids and their receptors were once thought to have an exclusive role in the CNS, but have also been identified to have activity in the kidney.Citation9,Citation27,Citation28 While it is unclear whether increased MOR and KOR expression is a cause or consequence of renal disease, OR antagonism by naloxone suggests that morphine-induced renal effects are mediated by ORs.
Glomerular enlargement is thought to result in increased urinary protein excretion and to be a precursor of glomerular sclerosis.Citation29 We observed increases in kidney weight, glomerular volume, and urinary albumin excretion in sickle mice exposed to morphine treatment. Additionally, glomerular epithelium is critically important in the development of kidney disease. Metaplasia of glomerular PEC is a common sign of glomerular injury. It has been suggested that cellular lesions seen in Bowman’s space in focal sclerosis (the prominent glomerular lesion seen in sickle cell nephropathy) are derived from proliferating PEC.Citation30 The observed increase in PEC metaplasia with prolonged morphine exposure and its antagonism with naloxone further highlight the potential importance of ORs in renal disease. However, naloxone alone did not exacerbate kidney pathology, suggesting that although OR expression is increased in the kidneys of sickle mice, it likely does not contribute to renal pathology in the absence of pharmacological doses of opioids. Increased albuminuria following morphine treatment is consistent with glomerular injury. Although renal pathology inevitably develops in sickle mice, our data suggest that morphine exacerbates the underlying pathologic condition by contributing to glomerular pathology.
Podocytes regulate glomerular function by maintaining the filtration barrier between the capillaries and urinary space.Citation31 Even localized podocyte injury induces stress on uninjured podocytes, glomerular endothelium, and mesangial cells, initiating a cycle of progressive glomerular disease.Citation32 Consistent with increased albuminuria, morphine treatment resulted in podocyte effacement and microvillus formation, suggesting podocyte injury and disruption of glomerular filtration barrier in sickle mice. An increased number of podocyte microprojections was observed using SEM following one week of morphine treatment in rats.Citation33
We also show that tubular damage was exacerbated in morphine-treated mice. These observations are consistent with chronic morphine-induced vacuolization of tubular cells and increases in blood urea nitrogen in the kidneys of Wistar rats.Citation7 Furthermore, morphine-induced rheological changes in red blood cells led to the intra- and extra-glomerular capillary vascular congestion in the kidneys of mice treated with morphine. This may contribute in part to the observed glomerular enlargement.
Morphine inhibits the activity of glutathione reductase purified from human erythrocytes.Citation34 This may lead to increased oxidative stress in tissues. In previous studies, we observed increased HO-1 activity in the kidneys of sickle mice with renal injury.Citation25 HO-1 plays a protective role against cellular insults such as oxidative stress and heme protein-induced injury.Citation35 Low concentrations of morphine were shown to increase proliferation and HO activity in glomerular epithelial cells in vitro.Citation36 In the present study, increased HO activity and HO-1 expression in the kidneys of mice treated with morphine may have been due to increased oxidative stress and serves as a protective mechanism against morphine-induced renal injury. This is a novel finding which requires further investigation.
Clinical studies of sickle cell nephropathy show varying degrees of albuminuria, hyperfiltration, and an altered glomerular filtration rate.Citation37 Variable use of opioids may be a contributing factor to physiologic and hematologic renal responses in SCD. Analgesic nephropathy is recognized as a problem, although clinical attention has focused almost exclusively on the roles of non-steroidal anti-inflammatory drugs (NSAIDs) in acute renal failure, development of edema, and hypertension.Citation38 Because these opioids are frequently used at high doses, are started at an early age, and administered repeatedly throughout life, the clinical implications of our data are significant considering the high incidence of nephropathy in SCD. Therefore, clinical studies are required to directly assess the association of opioid use and nephropathy in patients with SCD.
Authors’ contributions
MLW performed experiments and assisted with writing the manuscript; DV performed urine analysis; PEV interpreted data and wrote the manuscript; JTC and PG analyzed and interpreted histopathology and electron microscopy data; RPH conducted genotyping, provided mice, and gave advice regarding editing of the manuscript; KG conceived, designed, and supervised the study and analyzed and interpreted data as well as edited the manuscript.
Acknowledgments
We thank Mariya Farooqui, Tasneem Poonawala, Karl A Nath, Anthony Croatt, Stefan Kren, and Janet Parker for technical assistance. This work was funded by NIH grants, RO1 HL68802, HL103773, HL68802-06S1, HL68802-7S1 (to KG) and PO1 HL55552 (to RPH).
Disclosure
The authors report no conflicts of interest in this work.
References
- ScheinmanJISickle cell disease and the kidneyNat Clin Pract Nephrol200952788819048000
- HelalIFick-BrosnahanGMReed-GitomerBSchrierRWGlomerular hyperfiltration: definitions, mechanisms and clinical implicationsNat Rev Nephrol20128529330022349487
- BeckerAMSickle cell nephropathy: challenging the conventional wisdomPediatr Nephrol201126122099210921203778
- ReesDCWilliamsTNGladwinMTSickle-cell diseaseLancet201037697572018203121131035
- BallasSKNeurobiology and treatment of painEmburySHHebbelRPMohandasNSteinbergMHSickle Cell Disease: Basic Principles and Clinical PracticeNew YorkRaven Press1994745772
- DampierCDSettyBNLoganJIoliJGDeanRIntravenous morphine pharmacokinetics in pediatric patients with sickle cell diseaseJ Pediatr199512634614677869211
- AticiSCinelICinelLDorukNEskandariGOralULiver and kidney toxicity in chronic use of opioids: an experimental long term treatment modelJ Biosci200530224525215886461
- ArerangaiahRChalasaniNUdagerAMOpioids induce renal abnormalities in tumor-bearing miceNephron Exp Nephrol20071053e80e8917220637
- WeberMLFarooquiMNguyenJMorphine induces mesangial cell proliferation and glomerulopathy via kappa-opioid receptorsAm J Physiol Renal Physiol20082946F1388F139718385270
- GuptaKStephensonEJExistence and modus operandi of opioid receptors in endotheliumAirdWCThe Endothelium: A Comprehensive ReferenceNew YorkCambridge University Press2007451460
- GuptaMGuptaKOpioids as promoters and regulators of angiogenesisMaragoudakisMEPapadimitriouEAngiogenesis: Basic Science and Clinical ApplicationsKerala, IndiaTransworld Research Network2007303318
- TegederIGeisslingerGOpioids as modulators of cell death and survival – unraveling mechanisms and revealing new indicationsPharmacol Rev200456335136915317908
- KilcoyneMMGockeDJMeltzerJINephrotic syndrome in heroin addictsLancet19721774017204108817
- SinghalPCSharmaPGibbonsNFrankiNKapasiAWagnerJDEffect of morphine on renomedullary interstitial cell proliferation and matrix accumulationNephron19977722252349346391
- SinghalPCSharmaPSanwalVMorphine modulates proliferation of kidney fibroblastsKidney Int19985323503579461094
- SinghalPCGibbonsNAbramoviciMLong term effects of morphine on mesangial cell proliferation and matrix synthesisKidney Int1992416156015701501412
- FabryMENagelRLPachnisASuzukaSMCostantiniFHigh expression of human beta S- and alpha-globins in transgenic mice: hemoglobin composition and hematological consequencesProc Natl Acad Sci U S A1992892412150121541465454
- PasztyCBrionCMManciETransgenic knockout mice with exclusively human sickle hemoglobin and sickle cell diseaseScience199727853398768789346488
- DiwanBAGladwinMTNoguchiCTWardJMFitzhughALBuzardGSRenal pathology in hemizygous sickle cell miceToxicol Pathol200230225426211950169
- NathKAVercellottiGMGrandeJPHeme protein-induced chronic renal inflammation: suppressive effect of induced heme oxygenase-1Kidney Int200159110611711135063
- LiangMCroattAJNathKAMechanisms underlying induction of heme oxygenase-1 by nitric oxide in renal tubular epithelial cellsAm J Physiol Renal Physiol20002794F728F73510997923
- ManciEAHilleryCABodianCAZhangZGLuttyGACollerBSPathology of Berkeley sickle cell mice: similarities and differences with human sickle cell diseaseBlood200610741651165816166585
- NoguchiCTGladwinMDiwanBPathophysiology of a sickle cell trait mouse model: human alpha(beta)(S) transgenes with one mouse beta-globin alleleBlood Cells Mol Dis200127697197711831863
- KohliDRLiYKhasabovSGPain-related behaviors and neurochemical alterations in mice expressing sickle hemoglobin: modulation by cannabinoidsBlood2010116345646520304807
- NathKAGrandeJPHaggardJJCroattAJKatusicZSSoloveyAHebbelRPOxidative stress and induction of heme oxygenase-1 in the kidney in sickle cell diseaseAm J Pathol2001158389390311238038
- LiangDYClarkJDModulation of the NO/CO-cGMP signaling cascade during chronic morphine exposure in miceNeurosci Lett20043651737715234476
- QuirionRFinkelMSMendelsohnFAZamirNLocalization of opiate binding sites in kidney and adrenal gland of the ratLife Sci198333Suppl 12993026319881
- NeidleAManigaultIWajdaIJDistribution of opiate-like substances in rat tissuesNeurochem Res197943399410223080
- HostetterTHHyperfiltration and glomerulosclerosisSemin Nephrol200323219419912704579
- SmeetsBTe LoekeNADijkmanHBThe parietal epithelial cell: a key player in the pathogenesis of focal segmental glomerulosclerosis in Thy-1.1 transgenic miceJ Am Soc Nephrol200415492893915034095
- ShanklandSJThe podocyte’s response to injury: role in proteinuria and glomerulosclerosisKidney Int200669122131214716688120
- IchikawaIMaJMotojimaMMatsusakaTPodocyte damage damages podocytes: autonomous vicious cycle that drives local spread of glomerular sclerosisCurr Opin Nephrol Hypertens200514320521015821411
- JohnsonJEJrWhiteJJJrWalovitchRCLondonEDEffects of morphine on rat kidney glomerular podocytes: a scanning electron microscopic studyDrug Alcohol Depend19871932492573595448
- SenturkMIrfan KufreviogluOCiftciMEffects of some analgesic anaesthetic drugs on human erythrocyte glutathione reductase: an in vitro studyJ Enzyme Inhib Med Chem200924242042418608753
- NathKABallaGVercellottiGMInduction of heme oxygenase is a rapid, protective response in rhabdomyolysis in the ratJ Clin Invest19929012672701634613
- PatelJManjappaNBhatRMehrotraPBhaskaranMSinghalPCRole of oxidative stress and heme oxygenase activity in morphineinduced glomerular epithelial cell growthAm J Physiol Renal Physiol20032855F861F86912812915
- HaymannJPStankovicKLevyPGlomerular hyperfiltration in adult sickle cell anemia: a frequent hemolysis associated featureClin J Am Soc Nephrol20105575676120185605
- HarrisRCJrCyclooxygenase-2 inhibition and renal physiologyAm J Cardiol2002896A10D17D