Abstract
Background
A reduction of dopaminergic (DAergic) activity with increased prolactin levels has been found in obese and hypertensive patients, suggesting its involvement as a pathophysiological mechanism promoting hypertension. Similarly, leptin action increasing sympathetic activity has been proposed to be involved in mechanisms of hypertension. The aim of this study was to analyze the effects of DA, norepinephrine (NE), and prolactin on leptin release and leptin gene (OB) expression in adipocytes from obese and hypertensive patients.
Methods
Leptin release and OB gene expression were analyzed in cultured adipocytes from 16 obese and hypertensive patients treated with DA (0.001, 0.01, 0.1, and 1.0 μmol/L), NE (1.0 μmol/L), insulin (0.1 μmol/L), and prolactin (1.0 μmol/L), and from five nonobese and normotensive controls treated with DA (1 μmol/L), NE (1 μmol/L), insulin (0.1 μmol/L), and prolactin (1.0 μmol/L).
Results
A dose-related reduction of leptin release and OB gene messenger ribonucleic acid expression under different doses of DA was observed in adipocytes from obese hypertensive patients. Whereas prolactin treatment elicited a significant increase of both leptin release and OB gene expression, NE reduced these parameters. Although similar effects of DA and NE were observed in adipocytes from controls, baseline values in controls were reduced to 20% of the value in adipocytes from obese hypertensive patients.
Conclusion
These results suggest that DAergic deficiency contributes to metabolic disorders linked to hyperleptinemia in obese and hypertensive patients.
Introduction
The association between hypertension, obesity, and insulin resistanceCitation1 is closely linked to increased sympathetic activity.Citation2 The dopaminergic (DAergic) influence on blood pressure regulation, including DAergic-mediated inhibition of norepinephrine (NE) at sympathetic neuroeffector endings, leads to a reduction of central and peripheral DAergic activity and a hypertensive condition, possibly accounting for essential hypertension.Citation3 Clinical studies show a DAergic modulation of sympathetic activity in hypertensive and obese individuals,Citation4 and DAergic agonists have been successfully used as a treatment for hypertension by reducing adrenergic neurotransmission at sympathetic endings.Citation5 As bromocriptine treatment in obese humans elicited a reduction of serum leptin valuesCitation6 and improved insulin sensitivity,Citation7 this indirectly suggests beneficial effects of reduced DAergic activity.
Leptin, the peptide product of the obesity gene (OB) expressed and released mainly from adipocytes,Citation8 plays an important role in the regulation of food intake, energy expenditure, and body weight regulation.Citation9 High plasma levels of leptin in obese subjects reflect leptin resistance,Citation10 which may contribute to obesity-related hypertension,Citation11 ie, chronic leptin infusion increases sympathetic activity and arterial pressure.Citation12 Whereas several endogenous compounds, including insulin,Citation13 glucocorticoids,Citation14 and prolactin,Citation15 may increase OB gene expression from adipocytes, NE induces the opposite effect.Citation16 Hence, a leptin-mediated pathophysiological influence of these endogenous compounds has been suggested in obesity and hypertension.Citation17
The aim of this study was to explore if DAergic deficiency could contribute at least in part to metabolic disorders, particularly hyperleptinemia in obese and hypertensive patients. For this purpose, we examined the effects of DA, NE, insulin, and prolactin on leptin release and OB gene expression in adipocytes from obese hypertensive patients and age- and sex-matched nonobese normotensive patients undergoing elective surgery.
Materials and methods
Study design
The study comprised 16 obese hypertensive patients (ten women and six men, body mass index [BMI] ≥30 kg/m2) and five nonobese normotensive patients (three women and two men, BMI <30 kg/m2) serving as controls who underwent elective surgery for cholecystitis (n=7), umbilical hernia (n=12), lipoma (n=1), and polycystic ovary (n=1). The hypertensive patients had on at least two occasions during a 1-week interval systolic blood pressure ≥140 mmHg and/or diastolic blood pressure ≥90 mmHg, and mean blood pressure ≥107 mmHg (after a 5-minute rest period and seated). No subjects had renal, hepatic, or cardiac disease. Six subjects were taking antihypertensive drugs: angiotensin-converting enzyme (ACE) inhibitors (n=4), calcium antagonists (n=1), and ACE-inhibitors plus diuretic (n=1) at the time of surgery.
The local research committee of the General Regional Hospital Number 1, Instituto Mexicano del Seguro Social (IMSS), Morelia, Michoacán, México, approved the experimental protocol. All patients gave informed consent to participate in the study.
Samples
Abdominal subcutaneous adipose tissue samples weighing from 2.5 to 10 g were obtained by biopsy during elective abdominal surgery, under general anesthesia or epidural blockage, 5 minutes after opening the abdominal wall and before further surgical procedures. The patients had fasted from 10 pm the previous day before undergoing surgery. General anesthesia was induced at about 8 am by a short-acting barbiturate and maintained by sevoflurane plus fentanyl and oxygen (balanced anesthesia) or epidural blockage induced with lidocaine 2%. After removal of adipose tissue, specimens were stored in sterile cold (2°C–4°C) phosphate-buffered saline (PBS) with the addition of 500 IU/mL penicillin and 500 μg/mL streptomycin and immediately transferred to the laboratory to be processed within the following 30 minutes.
Materials
DA, NE, prolactin, and propranolol (β-adrenergic receptor antagonist) were purchased from Sigma-Aldrich (St Louis, MO, USA). Metoclopramide (DAergic antagonist) and NPH human insulin were provided by the pharmaceutical companies Hoechst Marion Russell (Mexico City, Mexico) and Eli Lilly (Mexico City, Mexico), respectively. Dulbecco’s Modified Eagle’s Medium (DMEM), bovine serum albumin (BSA), collagenase type II, PBS, penicillin and streptomycin, and cell-culture reagents were purchased from Life Technologies (Carlsbad, CA, USA). A Titan one-tube reverse-transcription polymerase chain reaction (RT-PCR) kit (Roche Diagnostics, Basel, Switzerland) was used RT and PCR. Oligonucleotides were purchased from Life Technologies.
Cell culture
The isolation and culture of the adipose tissue cells were performed following the Rodbell procedure,Citation18 with minor modifications, as follows. Tissue samples were weighed and minced; tissue fragments were then digested in fresh PBS penicillin/streptomycin buffer in the presence of type II collagenase (2 mg/mL buffering tissue) at 37°C with gentle shaking at 200 cycles/minute for 45 minutes. The resulting cell suspension was separated from undigested tissue by filtration through a 400-μM nylon mesh and washed three times. For each wash, cells were centrifuged at 500 rpm for 1 minute, and the infranatant was discarded each time. The supernatant adipocytes were resuspended in PBS penicillin/streptomycin buffer. The final wash was in DMEM supplemented with 10% BSA, sodium bicarbonate, HEPES (4-[2-hydroxyethyl]-1-piperazineethanesulfonic acid), penicillin/streptomycin (penicillin 500 IU/mL and streptomycin 500 μg/mL). It was then incubated for 30 minutes at a constant temperature of 37°C and 5% CO2, before being plated in culture plates in order to continue the incubation for 72 hours, with DMEM replacement at 24-hour intervals. Viability of the adipocytes was microscopically monitored (ID03 phase-contrast microscope; Zeiss, Jena, Germany). Then, the DMEM, without BSA, was used for maintenance of cultured adipocytes during the following treatments: DA (0.001, 0.01, 0.1, and 1.0 μmol/L); DA (1.0 μmol/L) plus metoclopramide (1.0 μmol/L); NE (1.0 μmol/l); NE (1.0 μmol/L) plus propranolol (20 μg/mL); and insulin (0.1 μmol/L) or prolactin (1.0 μmol/L). All treatments were maintained for 24 hours, with the exception of insulin treatment (which was maintained for 72 hours), in order to evaluate their effects on adipocyte OB gene expression and leptin release. Each experiment was performed six times in different cultured adipocytes obtained by biopsies, ie, in six plates incubated simultaneously, and was repeated in two separate experiments. At the end of the 24- or 72-hour treatment period, culture medium corresponding to adipocytes receiving the different treatments was frozen and stored at −70°C until assay. Cultured adipocytes in the plates under the different treatments were prepared for total ribonucleic acid (RNA) extraction.
Total RNA extraction and reverse-transcription polymerase chain reaction
Total RNA from cultured cells was prepared with the use of TRIzol® Reagent (Life Technologies) according to the manufacturer’s protocol. Agarose gel electrophoresis and ethidium bromide staining assessed the integrity of the adipocyte RNA samples. The RNA samples were then diluted appropriately to equalize concentrations, and stored at −70°C until use. RT and amplification of complementary deoxyribonucleic acid (cDNA) was carried out by PCR. RT-PCR was performed with the Titan one-tube RT-PCR kit. Using avian myeloblastosis virus for first-strand synthesis and the Expand High-Fidelity enzyme blend (Roche), which consisted of Taq DNA polymerase and Pwo DNA polymerase for the PCR part, a one-step reaction system was performed. In addition, the system included a single optimized RT-PCR buffer, control RNA from a human cell line (K562), and control primers for human β-actin messenger RNA (mRNA). Master mix 1 was composed of deoxyribonucleotide triphosphate mix 0.2 nM (each), dithiothreitol solution 5 mM, ribonuclease inhibitor 5 U, control primer mix 0.4 μM (each), downstream leptin primer 0.4 μM (each), upstream leptin primer 0.4 μM, control RNA 10 pg, template RNA 600 ng, and sterile water for a volume of 25 μL. Master mix 2 was composed of 5× RT-PCR buffer, enzyme mix (1 μL), and sterile water for a volume of 25 μL. Then, 25 μL each of master mixes 1 and 2 was added to a 0.2 mL thin-walled PCR tube on ice. The sample was mixed and collected at the bottom of the tube, and was briefly centrifuged and overloaded with 30 μL mineral oil.
The PCR primers used were: leptin, sense 5′-CAT TGG GGA ACC CTG TGC GGA-3′ and antisense 5′-TGG CAG CTC TTA GAG AAG GCC-3′; β-actin, sense 5′-CCA AGG CCA ACC GCG AGA AGATGA C-3′ and antisense 5′-AGG GTA CAT GGT GGT GCC GCC AGA C-3′. PCR products of leptin and β-actin generated fragments of 260 bp and 587 bp, respectively, when they were amplified. The β-actin was used as the housekeeping gene and amplified with leptin as internal control. Samples were placed in a Delta Cycler System P/W TCX80 (San Diego, CA, USA), equilibrated at 50°C, and incubated for 30 minutes for the RT. The cDNA synthesis reaction PCR was accomplished in 37 cycles; 1 × denature template at 94°C for 1 minute, 10 × denaturation at 94°C for 30 seconds, annealing at 60°C for 30 seconds, and elongation at 72°C for 2 minutes; 25 × denaturation at 94°C for 1 minute, annealing at 60°C for 30 seconds, and elongation at 72°C for 2 minutes; elongation at 72°C (2 minutes) plus five seconds for each cycle (eg, cycle 11 added 5 seconds, cycle 12 added 10 seconds, cycle 13 added 15 seconds); 1x of elongation time at 72°C lasted 7 minutes. The products of the amplification were resolved by electrophoresis in 2% agarose gel. The band densities were quantified using the RFLPscan 2.1 software (Scan analytics, Billerica, MA, USA).
Measurement of leptin
Leptin levels in the culture medium were measured by RIA using a human leptin RIA kit (Linco Research, St Charles, MO, USA). The limit of sensitivity was 0.05 ng/mL. The intra- and interassay coefficients of variation for concentrations of 0.58 ng/mL and 0.53 ng/mL were 1.8% and 4.9% and 3.6% and 6.6%, respectively.
Statistical analysis
Results from six experiments are expressed as means ± standard error. Statistical tests were performed using the SPSS, version 18 for Windows (IBM, Armonk, NY, USA). The Kolmogorov–Smirnov one-sample test was used to test for normal distribution of data. Student’s t-test was used for comparisons of the means of the values of the clinic variables and leptin release of the cultured adipocytes from obese hypertensive and nonobese normotensive patients. One-way analysis of variance followed by Tukey’s post hoc test was used to compare mean values of leptin release and OB gene expression under different treatments, with P<0.05 considered statistically significant.
Results
The clinical characteristics of the subjects are shown in . At baseline, significant differences between the groups were found in body weight, BMI, and systolic, diastolic, and mean blood pressure.
Table 1 Clinical characteristics of obese hypertensive patients and nonobese normotensive patients who provided adipose tissue samples for cultured adipocytes
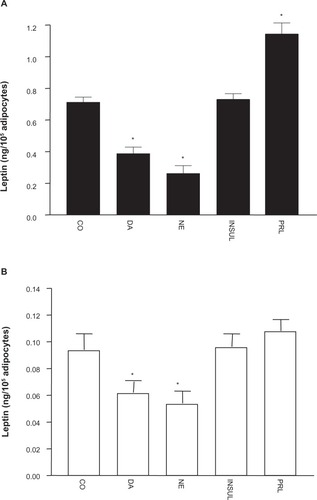
illustrates changes in leptin release elicited by the different treatments on cultured adipocytes. A significant reduction of leptin was observed when adipocytes were under DA, NE, and NE plus propranolol treatments, whereas there was a significant increase of leptin release under prolactin treatment compared to leptin release in untreated adipocytes. The changes observed in values of leptin in culture medium were not significantly different under DA plus metoclopramide, or insulin treatments compared to the control. The data for leptin release in the two groups are depicted in . Leptin release from cultured adipocytes from obese hypertensive patients was fivefold higher than cultured adipocytes from the nonobese normotensive patients (P<0.0001) under control conditions. shows a significant reduction in leptin release obtained in cultured adipocytes from obese hypertensive patients exposed to 1 μmol/L DA (by 0.450 ± 0.325 ng/mL, P=0.04) and 1.0 μmol/L NE (by 0.300 ± 0.226 ng/mL, P=0.001) and a significant increase with 1.0 μmol/L prolactin (by 0.862 ± 0.366 ng/mL, P=0.04), whereas only a significant reduction in leptin release was observed in cultured adipocytes from non-obese normotensive patients exposed to 1.0 μmol/L DA (by 0.062 ± 0.016 ng/mL, P=0.008) and 1.0 μmol/L NE (by 0.054 ± 0.016 ng/mL, P=0.005). These results are shown in . Insulin (0.1 μmol/L) and prolactin (1.0 μmol/L) treatments were ineffective.
Figure 1 Effects of different treatments on leptin release in cultured human adipocytes from obese hypertensive patients. Values (means ± standard error) are expressed as leptin concentrations in the culture medium. Control (CO), regular medium alone; dopamine (DA; 1.0 μmol/L); DA (1.0 μmol/L) plus metoclopramide (MET; 1.0 μmol/L); norepinephrine (NE; 1.0 μmol/L); NE (1.0 μol/L) plus propranolol (PROPR; 20 μg/mL); insulin (INSUL; 0.1 μmol/L); and prolactin (PRL; 1.0 μmol/L).
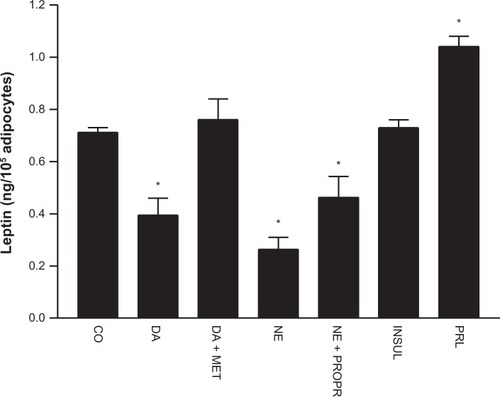
Figure 2 Values (means ± standard error) of leptin release from cultured adipocytes from nonobese normotensive patients, and from cultured adipocytes from obese hypertensive patients. Note the significantly higher values of leptin release from adipocytes from obese hypertensive patients in both control and treatment conditions.
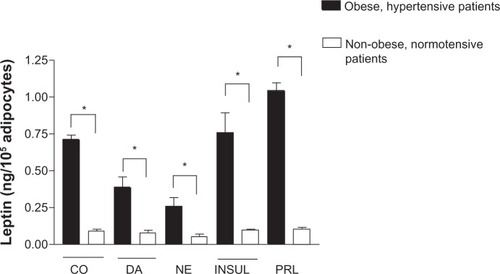
Figure 3 (A and B) Values (means ± standard error) of leptin release from cultured adipocytes under DA (1.0 μmol/L), NE (1.0 μmol/L), INSUL (0.1 μmol/L), and PRL (1.0 μmol/L) treatments. Leptin release from cultured adipocytes from obese hypertensive patients (A), and from nonobese normotensive patients (B). Note the different values on ordinates.
Abbreviations: CO, control; DA, dopamine; NE, norepinephrine; INSUL, insulin; PRL, prolactin.
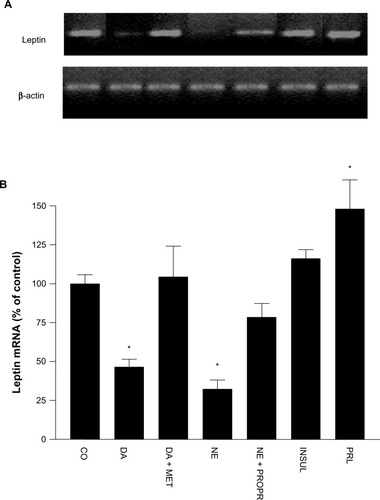
illustrates percentage changes in the content of OB gene mRNA expression of cultured adipocytes under the different treatments in comparison to leptin mRNA band density in cultured adipocytes not exposed to any treatment (100%). A significant reduction of OB gene mRNA expression was observed under 1.0 μmol/L of DA (to 54% ± 4%, P=0.02), while the effect under DA plus metoclopramide treatment was not statistically significant. In addition, NE elicited a significant reduction of OB gene mRNA expression (to 68% ± 6%, P=0.001), which was not completely reversed by propranolol. Insulin treatment did not induce significant modifications in OB gene mRNA expression of cultured adipocytes. Nevertheless, prolactin treatment elicited a significant increase of OB gene mRNA expression (to 48% ± 18%, P=0.04).
Figure 4 (A and B) Effects of the different treatments on leptin messenger ribonucleic acid (mRNA) resulting from OB leptin gene expression in culture from obese and hypertensive patients. (A) Representative bands of OB gene mRNA, using β-actin as internal control. (B) Percentage values (means ± standard error) of OB gene mRNA in reference to control conditions.
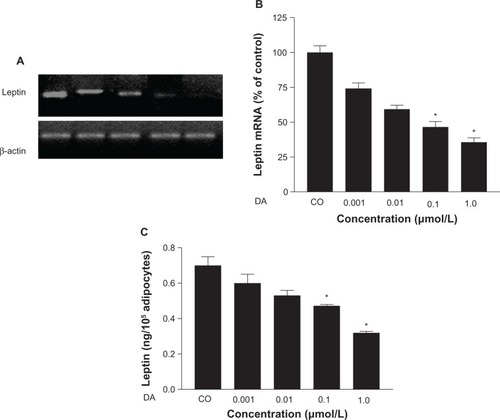
In addition, when cultured adipocytes of obese hypertensive patients were exposed to different concentrations of DA, a dose-dependent reduction of OB gene mRNA expression was observed, with significant reductions attained using DA 0.1 μmol/L and DA 1.0 μmol/L (52% ± 2.4%, P<0.05, and 63% ± 1.2%, P=0.01, respectively), and leptin release (from 0.71 ± 0.329 ng/mL to 0.47 ± 0.116 ng/mL, P=0.01, and from 0.71 ± 0.329 ng/mL to 0.32 ± 0.08 ng/mL, P<0.0001, respectively) (–).
Figure 5 (A–C) Dose-dependent reduction of OB gene messenger ribonucleic acid (mRNA) and leptin release induced by dopamine (DA) in cultured human adipocytes of obese, hypertensive patients. (A) Representative bands of OB gene mRNA. (B) Percentage values (means ± standard error) of leptin mRNA in reference to control conditions. (C) Leptin release under different concentrations of DA in reference to control.
Discussion
Our data confirm that leptin release was fivefold higher in cultured adipocytes obtained from obese hypertensive patients compared to nonobese normotensive patients. Moreover, this study demonstrates that whereas DA and NE exert inhibitory effects on leptin release and OB gene expression, prolactin increases leptin release and OB gene expression in cultured adipocytes from both obese hypertensive patients and nonobese normotensive patients. Thus, our results suggest that DAergic deficiency may contribute at least in part to metabolic disorders linked to hyperleptinemia in obese hypertensive patients.
The finding that NE reduced OB gene expression is in agreement with results from previous studies in cultured 3T3-LI adipocytesCitation16 and in cultured adipocytes from obese patients.Citation19 Moreover, NE addition to the culture resulted in a significant reduction of leptin release from cultured adipocytes from obese hypertensive patients, which was partially prevented by propranolol administration, in agreement with a previous report.Citation16 The partial reduction of the NE effects induced by propranolol could be due to the participation of the β3-adrenergic receptor, because propranolol is known to be an antagonist for the β1- and β2-adrenergic receptors.Citation20 Thus, our results support the hypothesis of noradrenergic involvement in cellular mechanisms resulting in leptin release and OB gene expression, suggesting that leptin release is modified in parallel with OB gene expression.
The chief finding of the present study was the DAergic effect on leptin release and OB gene expression in cultured adipocytes, similar to that induced by NE. In fact, DA elicited a dose-related reduction of both leptin release and OB gene expression in cultured adipocytes, possibly mediated by DA2 receptors, since metoclopramide administration resulted in abolishment of the DA effect. Involvement of G (Gi/Go) proteins, adenylate cyclase, and phospholipase C has been proposed, accounting for DA2-mediated DA effects.Citation21 Since DA and NE have negative effects on leptin release and OB gene expression, it appears that increments in body fat and as a consequence leptin overproduction precede sympathetic activity. This finding suggests that interactions between sympathetic overactivity and hyperleptinemia in obese hypertensive patients are dependent primarily on increments in body fat.
Although we did not test the effect of leptin on DA or NE production, circulating leptin has been suggested to contribute to increased blood pressure in obesity by activation of the sympathetic nervous system.Citation22 As leptin-binding sites have been found in regions of the brain that are important in cardiovascular control,Citation23 and chronic leptin infusion exerts long-term effects on cardiovascular and renal function,Citation12,Citation24 it seems conceivable that leptin could modify cardiovascular function through central nervous system effects. Evidence suggests that endogenous DA modulates NE synthesis and secretion in the noradrenergic neuronsCitation25 and – at least in part – leptin release and OB gene expression in adipose tissue. As DAergic activity is reduced in subjects with hypertension and obesity,Citation3 this could explain in part that obesity,Citation26 sympathetic hyperactivity,Citation27 and hyperleptinemiaCitation28 are associated with hypertension. We did not find effects of insulin on leptin release and OB gene expression in cultured adipocytes. These results are in accordance with previous reports published on primary cultures of adipocytes.Citation28 However, other studies have demonstrated that insulin causes an increase in leptin release and OB gene expression both in vivoCitation29 and in vitro.Citation13 There are at least three possible explanations for this discrepancy. One is the type of insulin used. In this study, NPH human insulin was used with pharmacokinetic properties of onset of action of 1–2 hours, maximum action of 6–12 hours, and duration up to 18–24 hours. However, we measured leptin at 24, 48, and 72 hours, so the effect might have been able to be observed before 24 hours. Another explanation is that cultured cells require a longer stimulation period; however, in the present study, this is not a probable explanation, since we kept the cells in culture for 72 hours. A third explanation may be that insulin causes an increase in leptin release and OB gene expression only in vivo.
Although prolactin is a peptide hormone produced mainly in the anterior pituitary, it is also synthesized in extrapituitary sites,Citation30 including adipocytes. Hyperprolactinemia, suggesting decrease of DAergic activity, is found in patients with hypertension,Citation31 obesity,Citation32 and chronic kidney disease,Citation33 ie, conditions associated with hyperleptinemia. We confirm that prolactin increases leptin release and OB gene expression in adipocytes cultured from subcutaneous fat of humans. However, results of recent studies suggest that the response is reciprocal in both directions, since on the one hand it has been found that leptin regulates DA in response to sustained stress and eating behavior in humans, implicating involvement of DAergic pathways in this response,Citation34,Citation35 and on the other hand a study in an experimental model showed that prolactin inhibits lipolysis and leptin release.Citation36 These discrepancies may be due to several factors, such as doses of DA and prolactin, experimental design, species, or sex.
Summary and conclusion
In the current study, DA and NE were found to decrease leptin release and OB gene expression in cultured adipocytes from subcutaneous fat tissue of obese hypertensive patients and nonobese normotensive patients, while there was an opposite effect of prolactin in cultured adipocytes from obese hypertensive patients. The clinical significance of these findings remains to be clarified in future studies; however, our observations support links between hyperprolactinemia, fat mass, hyperleptinemia, and hypertension. While recognizing that the investigated interactions are much more complex in vivo in the setting of numerous interrelated pathways interacting simultaneously, and likely to result in a variable response, the in vitro study of the dose-dependent response of these pathways under controlled situations, such as in the current study, could be a useful step to further our understanding of the much more complex mechanism in vivo in a sequential manner.
Acknowledgments
This investigation was supported by the Instituto Mexicano del Seguro Social, and by CONACYT/FOSIMORELOS grant 9903-02-028. We thank the patients who donated adipose tissue for these studies. We also gratefully acknowledge the support of staff of surgery and anesthesia of the General Regional Hospital Number 1, IMSS, Morelia, Michoacán, Mexico. Baxter Novum is the result of a grant to the Karolinska Institutet from Baxter Healthcare Corporation. Baxter Healthcare Corporation employs Bengt Lindholm.
Disclosure
The authors report no conflicts of interest in this work.
References
- FerraniniECushmanWCDiabetes and hypertension: the bad companionsLancet2012380984160161022883509
- LandsbergLPathophysiology of obesity-related hypertension: role of insulin and the sympathetic nervous systemJ Cardiovasc Pharmacol199423Suppl 1S1S87519690
- KuchelOGKuchelGAPeripheral dopamine in pathophysiology of hypertension. Interaction with aging and lifestyleHypertension19911867097211683857
- KollochRKobayashiKDeQuattroVDopaminergic control of sympathetic tone and blood pressure: evidence in primary hypertensionHypertension1980243903947399622
- ZieglerMGLakeCRWilliamsACTeychennePFShoulsonISteinslandOBromocriptine inhibits norepinephrine releaseClin Pharmacol Ther1979252137142759066
- KokPRoelfsemaFFrölichMvan PeltJMeindersAEPijlHActivation of dopamine D2 receptors lowers circadian leptin concentrations in obese womenJ Clin Endocrinol Metab20069183236324016705078
- PijlHOhashiSMatsudaMBromocriptine: a novel approach to the treatment of type 2 diabetesDiabetes Care20002381154116110937514
- ZhangYProencaRMaffeiMBaroneMLeopoldLFriedmanJMPositional cloning of the mouse obese gene and its human homologueNature199437265054254327984236
- PelleymounterMACullenMJBakerMBEffects of the obese gene product on body weight regulation in ob/ob miceScience199526952235405437624776
- ConsidineRVSinhaMKHeimanMLSerum immunoreactive-leptin concentrations in normal-weight and obese humansN Engl J Med199633452922958532024
- Alvarez-AguilarCMondragón-JiménezLIRamírez-EnríquezJGómez-GarcíaAPaniagua-SierraRAmatoDHiperleptinemia como factor de riesgo en hipertensión arterial asociada a obesidad [Hyper-leptinemia as a risk factor in obesity-related hypertension]Med Clin (Barc)200412320766769 Spanish15607067
- ShekEWBrandsMWHallJEChronic leptin infusion increases arterial pressureHypertension19983114094149453337
- BradleyRLCheathamBRegulates of ob gene expression and leptin secretion by insulin and dexamethasone in rat adipocytesDiabetes199948227227810334301
- MasuzakiHOgawaYHosodaKGlucocorticoid regulation of leptin synthesis and secretion in humans: elevated plasma leptin levels in Cushing’s syndromeJ Clin Endocrinol Metab1997828254225479253331
- GualilloOLagoFGarcíaMProlactin stimulates leptin secretion by rat white adipose tissueEndocrinology1999140115149515310537143
- KosakiAYamadaKKuzuyaHReduced expression of the leptin gene (ob) by catecholamine through a G(S) protein-coupled pathway in 3T3-L1 adipocytesDiabetes19964512174417498922360
- GalicSOakhillJSSteinbergGRAdipose tissue as an endocrine organMol Cell Endocrinol2010316212913919723556
- RodbellMMetabolism of isolated fat cells. I. Effects of hormones on glucose metabolism and lipolysisJ Biol Chem1964239237538014169133
- CarulliLFerrariSBertoliniMTagliaficoEDel RioGRegulation of ob gene expression: evidence for epinephrine-induced suppression in human obesityJ Clin Endocrinol Metab19998493309331210487703
- MantzorosCSQuDFrederichRCActivation of beta(3) adrenergic receptors suppresses leptin expression and mediates a leptin-independent inhibition of food intake in miceDiabetes19964579099148666142
- HussainTLokhandwalaMFRenal dopamine receptor function in hypertensionHypertension19983221871979719042
- HaynesWGMorganDAWalshSAMarkALSivitzWIReceptor-mediated regional sympathetic nerve activation by leptinJ Clin Invest199710022702789218503
- TartagliaLADembskiMWengXIdentification and expression cloning of a leptin receptor, OB-RCell1995837126312718548812
- HaynesWGSivitzWIMorganDAWalshSAMarkALSympathetic and cardiorenal actions of leptinHypertension19973036196239322991
- MannelliMIanniLLazzeriCIn vivo evidence that endogenous dopamine modulates sympathetic activity in manHypertension199934339840210489384
- HallJEBrandsMWDixonWNSmithMJObesity-induced hypertension. Renal function and systemic hemodynamicsHypertension19932232922998349321
- EslerMSympathetic nervous system: contribution to human hypertension and related cardiovascular diseasesJ Cardiovasc Pharmacol199526Suppl 2S24S288642801
- MacDougaldOAHwangCSFanHLaneMDRegulated expression of the obese gene product (leptin) in white adipose tissue and 3T3-L1 adipocytesProc Natl Acad Sci U S A19959220903490377568067
- BodenGChenXKolaczynskiJWPolanskyMEffects of prolonged hyperinsulinemia on serum leptin in normal human subjectsJ Clin Invest19971005110711139276727
- Ben-JonathanNMershonJLAllenDLSteinmetzRWExtrapituitary prolactin: distribution, regulation, functions, and clinical aspectsEndocr Rev19961766396698969972
- StumpeKOKollochRHiguchiMKrückFVetterHHyperprolactinaemia and antihypertensive effect of bromocriptine in essential hypertension. Identification of abnormal central dopamine controlLancet1977310803121121469827
- FerreiraMFSobrinhoLGSantosMASousaMFUvnäs-MobergKRapid weight gain, at least in some women, is an expression of a neuroendocrine state characterized by reduced hypothalamic dopaminergic tonePsychoneuroendocrinology1998238100510139924749
- HovSHGrossmanSMolitchMEHyperprolactinemia in patients with renal insufficiency and chronic renal failure requiring hemodialysis or chronic ambulatory peritoneal dialysisAm J Kidney Dis1985642452494050782
- BurghardtPRLoveTMStohlerCSLeptin regulates dopamine responses to sustained stress in humansJ Neurosci20123244153691537623115175
- ZessenRPlasseGAdanRAContribution of the mesolimbic dopamine system in mediating the effects of leptin and ghrelin on feedingProc Nutr Soc201271443544522800867
- BrandebourgTDBownJLJonathanNBProlactin upregulates its receptors and inhibits lipolysis and leptin release in male rat adipose tissueBiochem Biophys Res Commun2007357240841317433256