
Abstract
The purpose of this study was to conduct a retrospective analysis of serum phosphate level variability in patients new to hemodialysis (HD) and to identify patient characteristics associated with this variability. The medical records of 47,742 incident HD patients attending US outpatient dialysis centers between January 1, 2006 and March 31, 2009 were analyzed. Monthly mean serum phosphate levels determined over a 6-month evaluation period (months 4–9 after HD initiation) were assigned to one of three strata: low (<1.13 mmol/L [<3.5 mg/dL]); target (1.13–1.78 mmol/L [3.5–5.5 mg/dL]); or high (>1.78 mmol/L [>5.5 mg/dL]). Patients were classified into one of six serum phosphate variability groups based on variability among monthly mean phosphate levels over the 6-month evaluation period: consistently target; consistently high; high-to-target; high-to-low; target-to-low; or consistently low. Only 15% of patients (consistently target group) maintained monthly mean serum phosphate levels within the target range throughout the 6-month evaluation period. Age, Charlson comorbidity index, serum phosphate, and intact parathyroid hormone levels prior to HD initiation were strongly associated (P<0.001) with serum phosphate levels after HD initiation. Overall patient-reported phosphate binder usage increased from 35% at baseline to 52% at end of study. The low proportion of patients achieving target phosphate levels and low rates of phosphate binder usage observed during the study suggest that alternative strategies could be developed to control serum phosphate levels. Possible strategies that might be incorporated to help improve the management of hyperphosphatemia in incident HD patients include dietary modification, dialysis optimization, and earlier and sustained use of phosphate binders.
Introduction
High serum phosphate levels are associated with increased mortality in patients with chronic kidney disease (CKD).Citation1,Citation2 In addition, hyperphosphatemia increases the risk of vascular calcification and heart disease,Citation3 and contributes to the disruption of bone metabolism associated with renal osteodystrophy.Citation3 In response to epidemiological data, National Kidney Foundation Disease Outcomes and Quality Initiative (K/DOQI) guidelines state that, for patients with CKD who are being treated with dialysis, serum phosphate levels should be maintained within a target range of 1.13–1.78 mmol/L (3.5–5.5 mg/dL).Citation4 This is supported by the Kidney Disease: Improving Global Outcomes (KDIGO) guidelines, which recommend lowering phosphate levels toward the normal range (0.8–1.4 mmol/L [2.5–4.5 mg/dL]).Citation5
Serum phosphate levels in patients with CKD are managed by a combination of dietary modification, dialysis, and the use of phosphate binders.Citation4 Dietary modification aims to limit the absorption of both organic and inorganic phosphate by restricting the consumption of animal proteins and processed foods rich in phosphate-containing preservatives and additives.Citation5 Noori et alCitation6 have recommended a dietary phosphate:protein ratio of less than 10 mg/g/day for patients with CKD. However, in patients receiving hemodialysis (HD), long-term dietary phosphate restriction may induce protein energy malnutrition,Citation7–Citation10 which is strongly associated with increased mortality.Citation11–Citation14 Therefore, in addition to dietary phosphate restriction, the K/DOQI guidelines recommend that phosphate binders be used to help achieve target phosphate levels.Citation4 The main phosphate-binding agents currently in use for patients receiving dialysis are the calcium-based compounds calcium carbonate and calcium acetate, and the calcium-free phosphate binders sevelamer hydrochloride/carbonate and lanthanum carbonate.Citation15
Despite measures taken to control phosphate levels in patients receiving dialysis, individual patients still have large circadian and interdialytic fluctuations in serum phosphate levels.Citation16–Citation18 Previous studies have assessed the association between serum phosphate levels and mortality in patients incident to HD.Citation17,Citation19–Citation21 To date, however, no large-scale study has been published that assesses the variability of phosphate control on a granular monthly basis or identifies factors associated with this variability in patients new to HD. This retrospective analysis of incident HD patients was conducted in order to evaluate the degree of variability in serum phosphate levels over the 6 months of the evaluation period (months 4–9 after initiation of HD), and to assess whether baseline patient characteristics at HD initiation are associated with phosphate levels following the initiation of HD.
Materials and methods
A retrospective analysis was performed using the medical records of adult patients (age ≥18 years) who received their first HD treatment, according to dialysis center data, between January 1, 2006 and March 31, 2009. National data on all dialysis patients treated by a large US dialysis provider were obtained via a licensing agreement. To be included in the study, a patient’s first dialysis date was required to be no more than 30 days prior to the date of the first dialysis session with this provider (to allow for initiation of dialysis elsewhere). In addition, only patients whose dialysis sessions were recorded during the first 9 months of HD with an interruption of no more than 30 days between sessions and who had at least 4 monthly mean serum phosphate levels available during months 4 to 9 since starting HD were eligible for inclusion.
Quality control procedures to eliminate data entry errors/outlier values were implemented. Acceptable ranges were serum phosphate 0.03–6.5 mmol/L (0.1–20 mg/dL); intact parathyroid hormone (PTH) 0–2,000 pg/mL; equilibrated fractional clearance of body water of urea (eKt/V) 0–3; predialysis weight 30–200 kg. Erroneous or out-of-range values were set to missing. The date of HD initiation was considered the index date. Dialysis sessions were conducted in morning, afternoon, and evening shifts; dialysis patients are typically seen during the same shift from visit to visit. Monthly serum phosphate levels were obtained per dialysis provider protocol (predialysis, mid-week, nonfasting) and were collected approximately at the same time of day for each patient.
Preindex (baseline) data were available as part of the provider’s database for patient demographics (sex, race, and age) and comorbidities (myocardial infarction, congestive heart failure, peripheral vascular disease, cerebrovascular disease, chronic obstructive pulmonary disease, diabetes mellitus with and without complications, cancer, acquired immune deficiency syndrome, liver disease), and Charlson comorbidity index as well as the primary cause of CKD (urological disease, tubulointerstitial disease, cystic kidney disease, diabetes mellitus, hypertension, glomerulonephritis, or other). Baseline medications and laboratory test results were those recorded within 30 days prior to the index date, with the exception of serum phosphate and intact PTH: baseline was defined as the values closest to the index date in the period from 1 month pre- to 2 weeks postindex date; albumin: baseline was defined as the values closest to the index date in the period from 1 month pre- to 3 weeks postindex date; eKt/V: baseline was defined as the average over the first 90 days of HD; dry weight: baseline was defined as the average over the last week of the 90-day period following the index date; body surface area and body mass index (BMI): baseline values were calculated based on baseline dry weight, height, and weight; phosphate binder and vitamin D usage: baseline was defined over the first 90 days following the index date. The percentages of subjects using phosphate binders and vitamin D supplements were calculated.
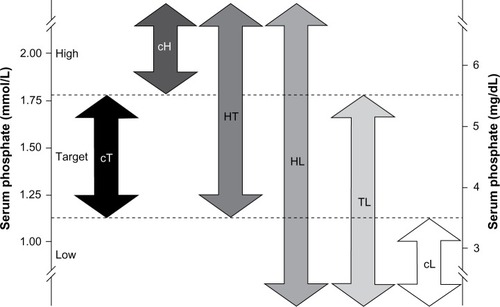
Monthly mean serum phosphate levels were calculated for 6 months, from day 91 (start of month 4) to day 270 (end of month 9) of dialysis. Phosphate levels were not analyzed for the first 90 days after HD initiation due to large fluctuations expected during this period while patients become stabilized on HD.Citation22 Monthly mean phosphate levels were assigned to one of three ranges: low (<1.13 mmol/L [<3.5 mg/dL]); target (1.13–1.78 mmol/L [3.5–5.5 mg/dL]); or high (>1.78 mmol/L [>5.5 mg/dL]). Based on the range and variability of their serum phosphate levels, patients were classified into one of six phosphate variability groups (). The consistently target (cT), consistently high (cH), and consistently low (cL) groups comprised patients whose monthly mean phosphate levels were all in the target, high or low range, respectively. The high-to-target (HT) group described patients with at least one high reading and one target reading with no readings in the low range. Patients in the high-to-low (HL) group had at least one phosphate reading in each of the high and low ranges. The target-to-low (TL) group contained patients with at least one monthly mean phosphate reading in the target range and at least one in the low range, with no readings in the high range. Baseline patient and treatment characteristics and trends over time (using bimonthly averages over the evaluation period for months 4–5, 6–7, and 8–9 postindex date) in serum phosphate, phosphate binder usage, BMI, albumin, and eKt/V are presented by phosphate variability groups.
Figure 1 Classification of hemodialysis patients into phosphate variability groups.
Abbreviations: cH, consistently high; cL, consistently low; cT, consistently target; HL, high-to-low; HT, high-to-target; TL, target-to-low.
Unless otherwise stated, values are expressed as mean ± standard deviation. Overall differences between phosphate variability groups were assessed using analysis of variance for continuous variables and a chi-squared test for categorical variables. Pairwise comparisons between the cT group and the other five phosphate variability groups were tested using two-sample Student’s t-tests for continuous variables and chi-square tests with one degree of freedom for categorical variables. To adjust for multiple comparisons, the Bonferroni correction was applied with a significance level of a=0.01. Analyses were performed using SAS® software version 9.1.3 (SAS Institute Inc., Cary, NC, USA).
Results
Patient distribution by phosphate variability group
A total of 87,835 patients started HD at outpatient dialysis centers between January 1, 2006 and March 31, 2009, of whom 47,742 met the inclusion criteria for the study. The main reasons for exclusion were patients receiving HD for fewer than 270 continuous days due to death (n=14,030) and dialysis interruption lasting longer than 30 days (n=25,064). shows that only 15% (n=7,301) of eligible patients consistently maintained serum phosphate levels within the target range (cT group). The largest individual group was the HT group, comprising 51% (n=24,469) of patients; the smallest group was the cL group, with just 0.3% (n=131) of patients.
Table 1 Baseline demographic and clinical characteristics
Baseline characteristics of the phosphate variability groups
Baseline patient and treatment characteristics by phosphate variability group are shown in and . The cT group had a mean age of 66.6±13.7 years, a mean serum phosphate level of 1.5±0.3 mmol/L (4.7±0.9 mg/dL), and a mean Charlson comorbidity index of 5.6±2.1 (). In comparison with the cT group, the cH, HT, and HL groups were significantly younger (cH, 52.5±14.7 years; HT, 60.6±14.7 years; HL, 63.7±14.8 years), had significantly higher baseline serum phosphate levels (cH, 2.3±0.5 mmol/L [7.2±1.5 mg/dL]; HT, 1.8±0.4 mmol/L [5.6±1.3 mg/dL]; HL, 1.7±0.5 mmol/L [5.2±1.4 mg/dL]), and a significantly lower Charlson comorbidity index (cH, 4.3±2.0; HT, 5.1±2.1; HL, 5.3±2.2). Conversely, the TL and cL groups were significantly older than the cT group (TL, 68.2±13.9 years; cL, 72.1±13.0 years), had significantly lower baseline serum phosphate levels (TL,1.4±0.3 mmol/L [4.2±1.0 mg/dL]; cL, 1.0±0.3 mmol/L [3.1±0.8 mg/dL]), and a significantly higher Charlson comorbidity index (TL, 5.7±2.1; cL, 6.3±2.1). The cH group had the lowest eKt/V level (1.17±0.23) as well as the highest BMI (30.0±6.3 kg/m2).
Figure 2 Baseline characteristics by phosphate variability group.
Abbreviations: cH, consistently high; cL, consistently low; cT, consistently target; HL, high-to-low; HT, high-to-target; PTH, parathyroid hormone; SD, standard deviation; TL, target-to-low.
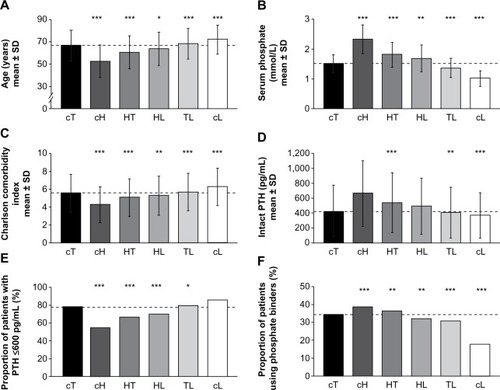
Table 2 Baseline disease and medication characteristics
Mean intact PTH levels at baseline were higher for patients in the cH (665.1±440.6 pg/mL), HT (541.6±399.6 pg/mL), and HL (494.5±376.6 pg/mL) groups than for those in the cT group (428.7±344.9 pg/mL); the difference was significant for the HT group (). Conversely, patients in the TL (410.4±340.5 pg/mL) and cL (373.9±302.3 pg/mL) groups had significantly lower baseline intact PTH levels than those in the cT group. The cH (54%), HT (66%), and HL (70%) groups had a smaller proportion of patients with PTH levels ≤600 pg/mL than the cT (77%) group (), whereas the TL (79%) and cL (86%) groups contained higher proportions of patients with intact PTH levels ≤600 pg/mL than the cT group. Baseline intact PTH levels were highly correlated with baseline phosphate levels (Pearson correlation coefficient, 0.97). Patients in the cT group had significantly higher mean baseline albumin levels (3.63±0.41 g/dL) compared with all other groups (3.48–3.58 g/dL). The proportion of patient-reported phosphate binder usage at baseline was significantly higher in the cH (38%) and HT (36%) groups than in the cT group (35%). Conversely, phosphate binder usage was significantly lower in the HL (32%), TL (31%), and cL (18%) groups than in the cT group ().
Trends in characteristics of the phosphate variability groups over time
Trends in phosphate patient-reported binder usage, serum phosphate, albumin, BMI, and eKt/V over time are presented in . Evaluating the study population as a whole, only 35% of patients new to HD received phosphate binder treatment at baseline (months 1–3). This increased to 52% at end of study (months 8–9), indicating that approximately half of the patients were not receiving a phosphate binder 9 months after the initiation of HD despite the majority of patients having inadequately controlled serum phosphate levels. Across the phosphate variability groups, the proportion of patients using a phosphate binder increased from baseline to end of study in all groups, except the cL group (). The proportion of patients on a binder in the cT group at end of study was 45%, representing a 10% increase from baseline. The largest increases from baseline to end of study in the proportion of patients using a phosphate binder and in the percentage of days on which a binder was used were observed in the cH, HT, and HL groups. Thus, these groups contained the highest proportions of patients using phosphate binders at end of study (cH, 59%; HT, 56%; HL, 51%). The lowest phosphate binder usage at end of study was seen in the cL group (16%).
Figure 3 Trends in characteristics of the phosphate variability groups over time.
Abbreviations: BMI, body mass index; cH, consistently high; CI, confidence interval; cL, consistently low; cT, consistently target; eKt/V, equilibrated fractional clearance of body water of urea; HL, high-to-low; HT, high-to-target; TL, target-to-low.
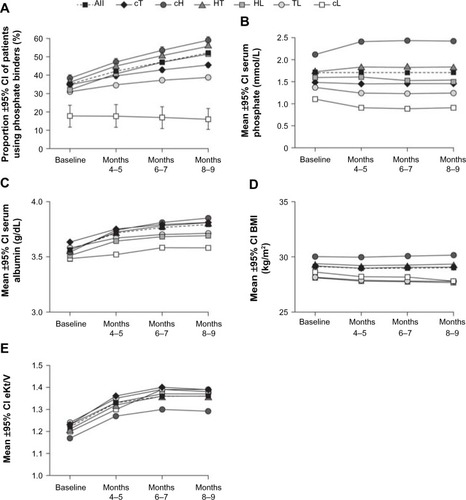
In the overall study population, mean serum phosphate levels were stable, increasing by 2.5% during the study period: baseline, 1.67 mmol/L (5.17 mg/dL); end of study, 1.71 mmol/L (5.30 mg/dL). Within each phosphate variability group, monthly mean phosphate levels remained steady during the 6-month evaluation period (). Ranges of bimonthly means were: cT, 1.45–1.46 mmol/L (4.50–4.51 mg/dL); cH, 2.40–2.42 mmol/L (7.43–7.49 mg/dL); HT, 1.81–1.83 mmol/L (5.61–5.65 mg/dL); HL, 1.51–1.60 mmol/L (4.67–4.96 mg/dL); TL, 1.24–1.25 mmol/L (3.84–3.88 mg/dL); and cL, 0.90–0.92 mmol/L (2.77–2.84 mg/dL). Mean albumin levels increased over time in all groups from a baseline of 3.5–3.6 g/dL. The highest mean albumin levels at end of study were observed in the cH group (3.8 g/dL) (). Mean BMI levels were consistently highest in the cH group, and next highest in the HT group. The lowest BMI levels were seen for the TL and HL groups (ranges of bimonthly means: TL, 27.8–27.9 kg/m2; HL, 27.7–27.8 kg/m2), with a slight decreasing trend over time. Mean BMI levels in the cT group were consistent over time at approximately 29.0 kg/m2 (). The adequacy of dialysis dose as measured by mean eKt/V improved by 0.1–0.2 (8.3%–16.7%) from baseline to end of study across the phosphate variability groups. The lowest eKt/V levels at baseline were in the cH group (1.17) ().
Discussion
In this retrospective analysis, we examined the variability of phosphate control in 47,742 patients new to HD to determine if predialysis clinical characteristics are associated with serum phosphate levels after HD initiation. This is the first large-scale study to assess both phosphate levels and patient-reported phosphate binder use throughout the 9 months following HD initiation. Only 15% of patients new to HD consistently maintained monthly mean serum phosphate levels within the K/DOQI target range. The finding that only a minority of patients were able to maintain phosphate control is in agreement with a previous study, which found that only 17% of patients remained within the target phosphate range for all four quarters of their second year on HD.Citation17 The previous study also demonstrated lower mortality in patients who remained within the target phosphate range for the first year of HD when compared to those with serum phosphate levels outside the target range.Citation17
Interestingly, patients in the three groups with mean baseline phosphate levels higher than those of the cT group (cH, HT, and HL groups) were significantly younger and had fewer comorbidities than those in the cT group, whereas patients in the low-phosphate groups (TL and cL groups) were older and had a greater number of comorbidities than those in the cT group. Our finding that older dialysis patients had lower serum phosphate levels than younger patients is consistent with previous studies.Citation23–Citation25 Older age is associated with higher levels of adherence to phosphate-binding medication,Citation26 which may be indicative of a closely supervised health care regimen.Citation27
An important additional factor associated with low phosphate levels in elderly patients receiving HD is a decreased appetite, leading to protein-energy malnutrition and cachexia.Citation28 An observation within the current dataset that may support this idea is that patients in the older and hypophosphatemic cL group showed a reduction in BMI from baseline to end of study. Conversely, BMI was highest in the cH group, and next highest in the HT group. Albumin levels were also highest in the cH group by months 6–7. This may be indicative of adequate or even excess protein intake, but normalized protein catabolic rate data were not available to support this contention. We found that eKt/V was lowest in the cH group, and therefore these patients may have received suboptimal dialysis. At baseline, eKt/V was less than 1.2 in the cH group but increased with time following the initiation of dialysis. Notwithstanding, eKt/V in the cH group remained lower than the eKt/V of the cT group throughout the duration of the study.
Baseline intact PTH levels were strongly associated with baseline serum phosphate levels. These findings are consistent with established clinical evidence that serum phosphate levels are correlated with PTH levels in patients with CKD.Citation29,Citation30 In the 2003 K/DOQI guidelines,Citation4 the recommended target range of serum intact PTH levels for patients with stage 5 CKD is 150–300 pg/mL. However, this is not supported by the available epidemiological evidence, which indicates that the inflection point above which PTH levels become significantly associated with increased all-cause mortality varies from 400 to 600 pg/mL.Citation31 Thus, the current consensus is for a wider PTH target range, as reflected in the 2009 KDIGO guidelines,Citation5 which suggest a target range of 130–600 pg/mL. The majority of patients new to HD in this study had mean intact PTH levels <600 pg/mL.
In the overall study population, approximately half (52%) of the patients were using phosphate binders at end of study. This is in contrast to a binder-usage rate of 88% that was recently reported in the Dialysis Outcomes and Practice Patterns Study (DOPPS).Citation32 The disparity in phosphate binder usage between the current study and DOPPS may be explained by noting that our data on binder usage were patient-reported and the patients in the current study were all new to HD, whereas in the DOPPS study, the mean duration of end-stage renal disease was 3.4 years, and that binder usage would be expected to increase over time. Indeed, following the initiation of HD in this study, phosphate binder usage increased in all groups except the cL group. The largest increases in binder usage occurred in the cH, HT, and HL groups, containing patients with the highest phosphate levels. However, the proportion of patients using phosphate binders in these groups was still relatively low (51%–59%), which may explain why phosphate levels remained high in these groups.
A limitation of the analysis is that data on type, dosage, and adherence to phosphate binder medication were not available. Our binder usage data are based on patient-reported information that may not be accurate or complete. Poor adherence to phosphate binders is known to be prevalent in patients with end-stage renal disease.Citation26,Citation27 Additionally, data presented are “real-world”, therefore phosphate binder titration protocols to specific targets were not rigidly enforced, as is the case in “treat-to-target” prospective clinical trials. As the only patients included were those who survived the first year of HD and had no interruption of dialysis in-clinic treatment for more than 90 days, results should not be generalized to a sicker patient population. In addition, the usual potential biases associated with retrospective data analysis apply to our results, including possible selection bias and variation in reporting standards and accuracy. However, given the large national sample used, we believe the results are representative of real-world practice.
The large proportion of incident HD patients with at least one high monthly mean serum phosphate level suggests that developing alternative strategies to control serum phosphate are needed. Such strategies may include the combination of dietary modification, adequate dialysis, and administration of phosphate binders to hyperphosphatemic patients upon initiation of HD to improve early phosphate control. With regard to binder usage in the early stage of HD, the use of phosphate binders during the first 90 days after initiation of HD has been shown to be associated with a reduction in mortality in HD patients.Citation19 Further studies are required to evaluate the utility of early, aggressive administration of phosphate binders for the management of hyperphosphatemia in patients with end-stage renal disease requiring HD.
In this retrospective analysis of patients new to HD, only 15% of patients maintained serum phosphate levels consistently within the K/DOQI target range, indicating that phosphate control is difficult to achieve in this patient population. Despite the majority of patients having higher-than-target monthly mean levels of serum phosphate for at least 1 month during the study, rates of phosphate binder usage were lower than those reported in previous studies. It is conceivable that earlier and sustained administration of phosphate binders to incident HD patients with attention to patient nutritional status and dialysis adequacy could help improve the management of serum phosphate levels in these patients.
Acknowledgments
Writing and editorial support was provided by Fernando Gibson and Rosalind Morley, employees of PharmaGenesis™ London, with funding from Shire Development LLC. Arthur Silverberg, an employee of Shire, provided statistical expertise.
Disclosure
Kimberly Farrand, J Brian Copley, Jamie Heise, Michael Keith, and Lynne Poole are employees of Shire. Moshe Fridman is a consultant to Shire. The results presented in this manuscript are derived from analysis of dialysis center data, obtained via a data licensing agreement. The analysis was funded by Shire Development LLC. The authors declare that the results presented in this paper have not been published previously in whole or part, except in abstract format. The authors report no other conflicts of interest in this work.
References
- BlockGAKlassenPSLazarusJMOfsthunNLowrieEGChertowGMMineral metabolism, mortality, and morbidity in maintenance hemodialysisJ Am Soc Nephrol20041582208221815284307
- KestenbaumBSampsonJNRudserKDSerum phosphate levels and mortality risk among people with chronic kidney diseaseJ Am Soc Nephrol200516252052815615819
- Cannata-AndiaJBRoman-GarciaPHruskaKThe connections between vascular calcification and bone healthNephrol Dial Transplant201126113429343622039012
- National Kidney FoundationK/DOQI clinical practice guidelines for bone metabolism and disease in chronic kidney diseaseAm J Kidney Dis2003424 Suppl 3S1S20114520607
- Kidney Disease: Improving Global Outcomes (KDIGO) CKD-MBD Work GroupKDIGO clinical practice guideline for the diagnosis, evaluation, prevention, and treatment of chronic kidney disease-mineral and bone disorder (CKD-MBD)Kidney Int Suppl2009113S1S130
- NooriNSimsJJKoppleJDOrganic and inorganic dietary phosphorus and its management in chronic kidney diseaseIran J Kidney Dis2010428910020404416
- ColadonatoJAControl of hyperphosphatemia among patients with ESRDJ Am Soc Nephrol200516Suppl 2S107S11416251245
- IkizlerTADietary protein restriction in CKD: the debate continuesAm J Kidney Dis200953218919119166797
- RufinoMde BonisEMartínMIs it possible to control hyperphosphataemia with diet, without inducing protein malnutrition?Nephrol Dial Transplant199813Suppl 365679568824
- ShinabergerCSGreenlandSKoppleJDIs controlling phosphorus by decreasing dietary protein intake beneficial or harmful in persons with chronic kidney disease?Am J Clin Nutr20088861511151819064510
- Kalantar-ZadehKSupasyndhOLehnRSMcAllisterCJKoppleJDNormalized protein nitrogen appearance is correlated with hospitalization and mortality in hemodialysis patients with Kt/V greater than 1.20J Ren Nutr2003131152512563619
- LacsonEIkizlerTALazarusJMTengMHakimRMPotential impact of nutritional intervention on end-stage renal disease hospitalization, death, and treatment costsJ Ren Nutr200717636337117971308
- PupimLBCaglarKHakimRMShyrYIkizlerTAUremic malnutrition is a predictor of death independent of inflammatory statusKidney Int20046652054206015496179
- RambodMBrossRZitterkophJAssociation of Malnutrition-Inflammation Score with quality of life and mortality in hemodialysis patients: a 5-year prospective cohort studyAm J Kidney Dis200953229830919070949
- CollinsAJFoleyRNChaversBUnited States Renal Data System 2011 Annual Data Report: Atlas of chronic kidney disease and end-stage renal disease in the United StatesAm J Kidney Dis2012591 Suppl 1A7e1e42022177944
- BeckerGJWalkerRGHewitsonTDPedagogosEPhosphate levels – time for a rethink?Nephrol Dial Transplant20092482321232419443650
- DaneseMDBelozeroffVSmirnakisKRothmanKJConsistent control of mineral and bone disorder in incident hemodialysis patientsClin J Am Soc Nephrol2008351423142918596117
- RingTSandenAKHansenHHHalkierPNielsenCFogLUltradian variation in serum phosphate concentration in patients on haemodialysisNephrol Dial Transplant199510159637724030
- IsakovaTGutiérrezOMChangYPhosphorus binders and survival on hemodialysisJ Am Soc Nephrol200920238839619092121
- GutiérrezOMMannstadtMIsakovaTFibroblast growth factor 23 and mortality among patients undergoing hemodialysisN Engl J Med2008359658459218687639
- MelamedMLEustaceJAPlantingaLChanges in serum calcium, phosphate, and PTH and the risk of death in incident dialysis patients: a longitudinal studyKidney Int200670235135716738536
- SelvarajahVPaseaLOjhaSWilkinsonIBTomlinsonLAPre-dialysis systolic blood pressure-variability is independently associated with all-cause mortality in incident haemodialysis patientsPLoS One201491e8651424489735
- PelletierSRothHBouchetJLDruekeTLondonGFouqueDFrench Phosphorus and Calcium Observatory investigatorsMineral and bone disease pattern in elderly haemodialysis patientsNephrol Dial Transplant20102593062307020237058
- YavuzAErsoyFFPassadakisPSPhosphorus control in peritoneal dialysis patientsKidney Int Suppl2008108S152S15818379539
- YoungEWAlbertJMSatayathumSPredictors and consequences of altered mineral metabolism: the Dialysis Outcomes and Practice Patterns StudyKidney Int20056731179118715698460
- KaramanidouCClatworthyJWeinmanJHorneRA systematic review of the prevalence and determinants of nonadherence to phosphate binding medication in patients with end-stage renal diseaseBMC Nephrol20089218237373
- ArenasMDMalekTGilMTMoledousAAlvarez-UdeFReig-FerrerAChallenge of phosphorus control in hemodialysis patients: a problem of adherence?J Nephrol201023552553420119931
- LeckerSHGiven the science on malnutrition, how does the clinician respond? Practical lessons for and application to the dialysis patientClin J Am Soc Nephrol20094Suppl 1S64S7019996008
- PiresAAdragãoTPaisMJVinhasJFerreiraHGInferring disease mechanisms from epidemiological data in chronic kidney disease: calcium and phosphorus metabolismNephron Clin Pract20091123c137c14719390214
- SlatopolskyEBrownADussoARole of phosphorus in the pathogenesis of secondary hyperparathyroidismAm J Kidney Dis2001371 Suppl 2S54S5711158862
- UhligKBernsJSKestenbaumBKDOQI US commentary on the 2009 KDIGO Clinical Practice Guideline for the Diagnosis, Evaluation, and Treatment of CKD-Mineral and Bone Disorder (CKD-MBD)Am J Kidney Dis201055577379920363541
- LopesAATongLThummaJPhosphate binder use and mortality among hemodialysis patients in the Dialysis Outcomes and Practice Patterns Study (DOPPS): evaluation of possible confounding by nutritional statusAm J Kidney Dis20126019010122385781