
Abstract
Introduction
Several anemia guidelines for hemodialysis patients have recommended a target hemoglobin (Hb) range of 10–12 g/dL. However, maintaining Hb values continuously within a narrow target has been difficult, and there has been no generally accepted anemia management algorithm for hemodialysis patients.
Methods
In our study, we created an anemia management algorithm that considers the length of erythrocyte lifetimes, focuses on the combination of erythropoiesis-stimulating agent management and iron administration, and prevents iron deficiency and overload. Our algorithm established a target Hb range of 10–12 g/dL.
Results
We evaluated our algorithm in 49 patients for 6 months. The mean Hb values were approximately 11 g/dL during our study period. The percentage of patients in the target Hb range of 10–12 g/dL increased from 77.6% (38 of 49) at baseline to 85.7% (42 of 49) at 4–6 months. Throughout monthly regular blood tests during 1–6 months after we introduced our algorithm, Hb values remained within the target range in 55.1% (27 of 49) of patients. The standard deviation of Hb values significantly decreased at 5 and 6 months (P=0.013 and P=0.047, respectively; 1 g/dL at 0 month, 0.7 g/dL at 5 months, and 0.7 g/dL at 6 months). Our algorithm also succeeded in suppressing cumulative doses of iron (≤800 mg) and decreasing the ferritin values significantly (P=0.011). There were no significant differences in erythropoiesis-stimulating agent doses between 0 and 6 months (P=0.357).
Conclusion
Our anemia management algorithm successfully increased the number of patients in the target Hb range, significantly decreased the Hb standard deviation, suppressed cumulative doses of iron, and decreased ferritin values. These results suggest a better prognosis for hemodialysis patients. Further studies are required to evaluate our algorithm.
Introduction
The use of erythropoiesis-stimulating agents (ESAs) and iron administration have enabled anemia control in hemodialysis patients without blood transfusions.Citation1–Citation3 However, hemoglobin (Hb) values that are too high or too low can worsen the prognosis.Citation4–Citation8 The European Renal Best Practice position statement recommends a target Hb range of 10–12 g/dL.Citation9 Similarly, the Japanese Society for Dialysis Therapy recommends a target Hb range of 10–11 g/dL and a target Hb range of 11–12 g/dL in relatively young active patients.Citation6 In the USA, the majority (66%) of hemodialysis patients had mean Hb levels in the range of 10–12 g/dL,Citation10 although the concept of a target Hb range had been removed.Citation11 However, maintaining Hb values continuously within a narrow target range has been described as difficult.Citation12,Citation13
Thus, there have been many attempts to create anemia management algorithms for hemodialysis patients.Citation14–Citation22 Nevertheless, there is no generally accepted algorithm.Citation14 A majority of algorithms do not consider the length of erythrocyte lifetimesCitation23 and mainly focus on ESA management without considering the combination of ESA management and iron administration. To appropriately manage the ESA dose, we believe that an anemia management algorithm should consider the length of erythrocyte lifetimes and focus on the combination of ESA management and iron administration. Further, we believe that an anemia management algorithm should prevent not only iron deficiency but also iron overload. Thus, we created an algorithm that addressed these issues and evaluated its control of Hb values and iron indices.
Materials and methods
Study design
The study population was drawn from 88 hemodialysis patients at the Yokkaichi Social Insurance Hospital (this hospital name was changed to Yokkaichi Hazu Medical Center in April 2014). The exclusion criteria included patients with chronic hepatitis, patients whose principal physicians wanted to control any anemia by themselves, hospital patients, patients who did not receive ESAs, patients who received continuous erythropoietin receptor activator, patients who declined consent, and patients who had started hemodialysis within the past 6 months (). Therefore, we introduced our anemia management algorithm to 53 patients from May 2013 to November 2013 and evaluated how our algorithm could control Hb values and iron indices.
Figure 1 The flow of patients.
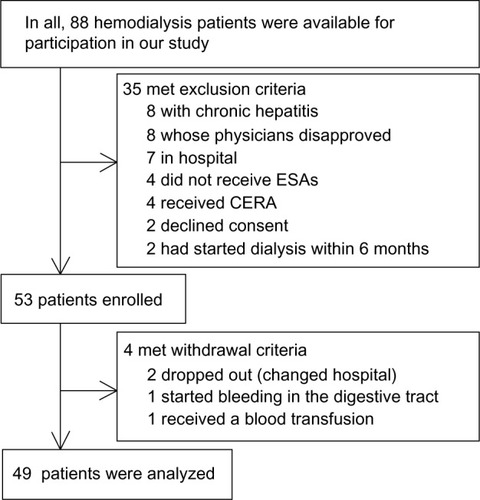
Withdrawal criteria included patients whose Hb values decreased to ≥1.5 g/dL from the last Hb results because of hemorrhage, patients who needed a blood transfusion, patients who dropped out from our algorithm because of a change in hospitals, and patients who died.
Our study was approved by the ethics committee of the Yokkaichi Social Insurance Hospital (now known as Yokkaichi Hazu Medical Center). All participating patients signed informed consent forms.
Blood test schedule
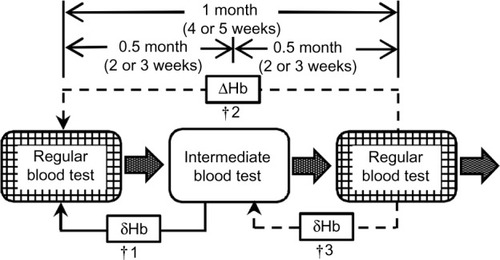
Blood tests were performed at the beginning of the first dialysis of the week, which had the longest interval from the last dialysis. At a regular blood test, which was a monthly blood test, Hb, serum iron, total iron-binding capacity, and albumin were measured. At an intermediate blood test, which was taken between two consecutive regular blood tests, Hb was measured (). Ferritin was measured once every three regular blood tests or at 0, 3, and 6 months after we introduced our algorithm. The transferrin saturation rate (TSAT) was calculated from serum iron and total iron-binding capacity (TSAT=100× serum iron/total iron-binding capacity).
Figure 2 Blood test schedule.
Anemia management algorithm
Our anemia management algorithm comprised an iron algorithm and an ESA algorithm. Our algorithm established a target Hb range of 10–12 g/dL. All decisions in our algorithm were evaluated by physicians. If a decision was approved by physicians, it was reflected in the treatment.
Iron algorithm
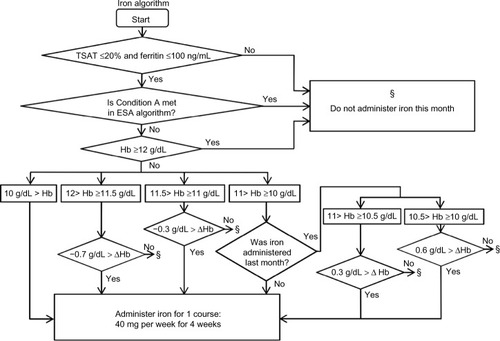
To prevent iron deficiency, the iron algorithm made decisions regarding iron administration at every regular blood test (). If ferritin was not measured during a month, the last ferritin result was used. If iron administration was selected, the patient received intravenous administration of saccharated ferric oxide (Fesin®; Nichi-iko Pharmaceutical Co, Ltd, Toyama, Japan) of 40 mg per week for 4 weeks, which was defined as one course. Criteria for TSAT and ferritin were compliant with the Japanese Society for Dialysis Therapy Anemia Guidelines.Citation6
Figure 3 Iron algorithm.
Abbreviations: Hb, hemoglobin (g/dL); ΔHb: Hb changes for 1 month (g/dL): ESA, erythropoiesis-stimulating agent.
ESA algorithm
The ESA algorithm comprised the processes shown in –. First, the flow chart in divided a case into six charts (Chart numbers 1–6; –). Second, according to Hb values and Hb changes, each chart then divided the case into seven conditions (Conditions A–G). Third, using the decision table (), the algorithm selected a treatment according to the state of iron administration. If an ESA dose was going to be changed, the dose per week was either increased or decreased step by step according to .
Figure 4 First flow chart of erythropoiesis-stimulating agent (ESA) algorithm.
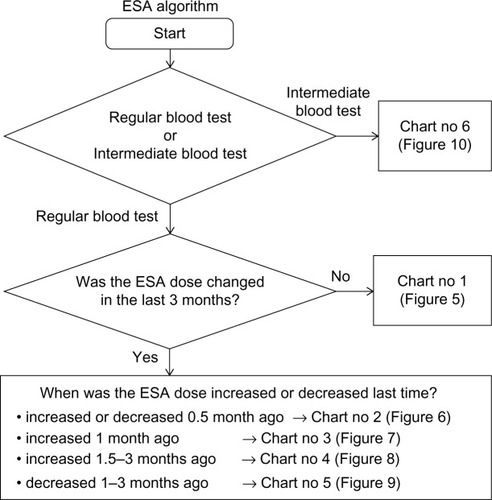
Figure 5 Chart number 1: The erythropoiesis-stimulating agent dose had not been changed for the last 3 months. Each chart (Chart nos 1–6; –) was more sensitive to hemoglobin (Hb) decreases than to Hb increases except when the Hb value was high, because other than deficiency of erythropoiesis-stimulating agent doses and iron, there may have been myriad causes that led to decreases in Hb values.
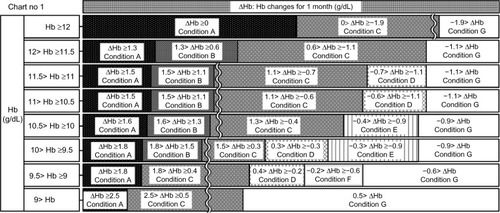
Figure 6 Chart number 2: The erythropoiesis-stimulating agent dose was increased or decreased 0.5 month ago. This chart was used to monitor hemoglobin (Hb) changes at the 0.5-month mark and was created for monitoring short-term Hb increases or decreases.
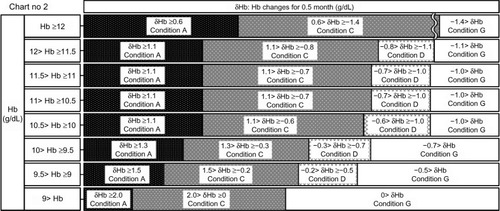
Figure 7 Chart number 3: The erythropoiesis-stimulating agent (ESA) dose was increased 1 month ago. Compared with Chart number 1 (), this chart was more sensitive to hemoglobin (Hb) decreases when the Hb value was ≥9 g/dL and more permissive to Hb increases when Hb values ranged from ≥9 to <11.5 g/dL, because the Hb value may increase partially because of an increase in ESA; however, our ESA algorithm could watch for unexpected Hb decreases.
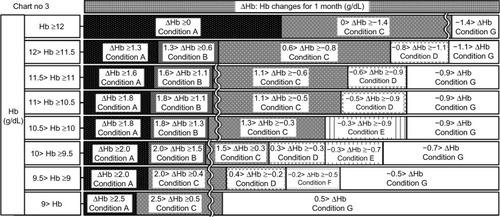
Figure 8 Chart number 4: The erythropoiesis-stimulating agent (ESA) dose was increased 1.5–3 months ago. Compared with Chart number 3 (), this chart was more sensitive to hemoglobin (Hb) decreases when Hb values ranged from ≥9 to <11 g/dL because the Hb value should increase fully because of an increase in ESA. Our ESA algorithm could watch for unexpected Hb decreases.
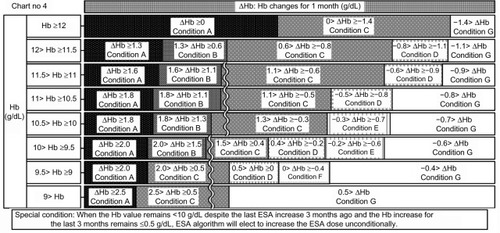
Figure 9 Chart number 5: The erythropoiesis-stimulating agent (ESA) dose was decreased 1–3 months ago. Compared with Chart number 1 (), this chart was more sensitive to hemoglobin (Hb) increases when Hb values ranged from ≥11 to <12 g/dL, more sensitive to Hb decreases when Hb values ranged from ≥9 to <11 g/dL, and more permissive to Hb decreases when Hb values ranged from ≥11.5 to <12 g/dL, because the Hb value should decrease because of a decrease in ESA. Our ESA algorithm could watch for unexpected Hb increases and excessive Hb decreases.
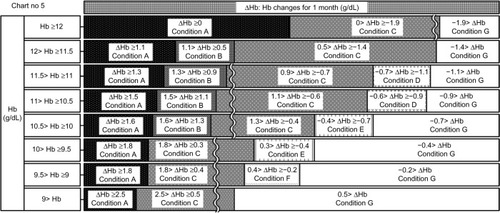
Figure 10 Chart number 6: Intermediate blood tests. This chart was used to monitor hemoglobin (Hb) changes at the 0.5-month mark and was created for monitoring short-term Hb increases or decreases.
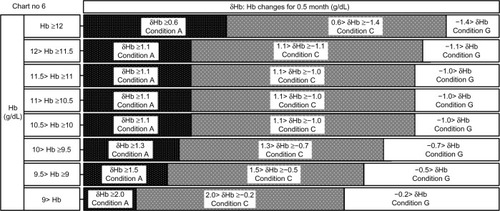
Figure 11 Decision table.
Abbreviation: ESA, erythropoiesis-stimulating agent.
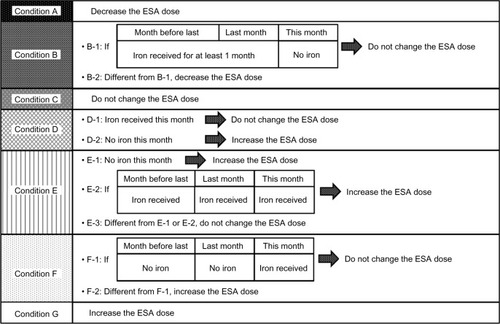
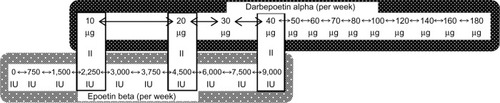
Figure 12 Erythropoiesis-stimulating agent dose adjustment worksheet.
Additionally, we created a special condition to prevent the stagnation of low Hb values. When the Hb value remained <10 g/dL despite the last ESA increase 3 months ago and the Hb increase for the last 3 months remained ≤0.5 g/dL, our ESA algorithm would elect to increase the ESA dose unconditionally ().
In our study, epoetin beta (EPOGIN®; Chugai Pharmaceutical Co, Ltd, Tokyo, Japan) and darbepoetin alpha (NESP®; Kyowa Hakko Kirin Co, Ltd, Tokyo, Japan) were used intravenously. The dose conversion ratio between epoetin beta and darbepoetin alpha was 225:1 in our ESA algorithm. Thus, doses of epoetin beta of 2,250, 4,500, and 9,000 IU were interchangeable with doses of darbepoetin alpha of 10, 20, and 40 μg, respectively, in our ESA algorithm (). After the ESA dose per week was determined, epoetin beta was mainly administered at each dialysis session, and darbepoetin alpha was administered once a week.
The way to use our algorithm in our study
Because our algorithm became somewhat complicated, we designed a program that could quickly make decisions based on our anemia management algorithm using Microsoft Office Excel® 2007 (Microsoft Corporation, Redmond, WA, USA); we used the program to make decisions in our study.
Statistical analysis
For comparisons between baseline data and data at the end of our study, the paired t-test was used. For comparisons of the Hb standard deviation between baseline and other time points after we introduced our algorithm, the F-test for two population variances with correlated observations was used.Citation24 All data were analyzed using Microsoft Office Excel® 2007. Differences were considered significant at P-values of <0.05.
Results
We enrolled 53 hemodialysis patients initially, but four patients dropped out during our study period: two patients who dropped out from our algorithm because of changing hospitals, one patient whose Hb values decreased to ≥1.5 g/dL because of bleeding in the digestive tract, and one patient who needed a blood transfusion (). No enrolled patient died during our study period. Therefore, in total, we analyzed 49 patients (). In addition, one patient refused to have blood drawn at every intermediate blood test, but our algorithm successfully managed the patient’s anemia according to results of regular blood tests. Therefore, for analytical use, we used data from regular blood tests because it contained complete data for these 49 patients. Moreover, although blood tests should be performed at the first dialysis of the week, which had the longest interval from the last dialysis, one patient did have blood drawn 2 days after the last dialysis once during 0 month and another patient did the same thing once during 1 month; however, no negative effect in their anemia control was recognized.
Table 1 Baseline characteristics
Regarding 49 analyzed patients, eleven had entered hospital during our study period: two for examination, two with infection, two with heart failure, two with bone fracture, one for parathyroidectomy, one for percutaneous peripheral intervention, and one with vertigo. No patient had myocardial or cerebral infarction.
In our study period, all decisions about our anemia management algorithm were approved by physicians. Each ESA was administered without fail. There were 34 ESA increases and 26 ESA decreases at regular blood tests (n=49), and seven ESA increases and six ESA decreases at intermediate blood tests (n=48). In contrast, there were 59 courses of iron administration (one course is 40 mg/week for 4 weeks). The amount of administered iron during our study period ranged from 0 to 800 mg, and the mean dose of iron during our study period was 193±179 mg. Using our iron algorithm, we decided not to administer iron 235 times, 149 times of which TSAT was >20%.
Mean Hb values were approximately 11 g/dL during our study period (). The percentage of patients in the target Hb range of 10–12 g/dL increased from 77.6% (38 of 49) at baseline to 85.7% (42 of 49) at 4–6 months (). Throughout regular blood tests during 1–6 months, Hb values remained within the target range in 55.1% (27 of 49) of patients. No patient had Hb values exceeding 12 g/dL continuously during our study period. The Hb standard deviation decreased over time and also decreased significantly at 5 and 6 months (P=0.013 and P=0.047, respectively: 1 g/dL at 0 month, 0.7 g/dL at 5 months, and 0.7 g/dL at 6 months; ) compared with the values at baseline. There were no significant differences in ESA doses and Hb values between baseline data and data at the end of study (P=0.357 and P=0.682, respectively; ), but there was a significant decrease in ferritin values (P=0.011; ). Regarding 15 patients who received high doses of epoetin beta (≥9,000 IU) or darbepoetin alpha (≥40 μg) at 0 month, their ESA doses did not significantly change at 6 months (P=0.625; 14,100±6,721 IU at 0 months and 14,850±10,339 IU at 6 months. Doses of darbepoetin alpha were converted to doses of epoetin beta according to the conversion ratio of 225:1).
Figure 13 Trend in mean hemoglobin values ± standard deviation at regular blood tests.
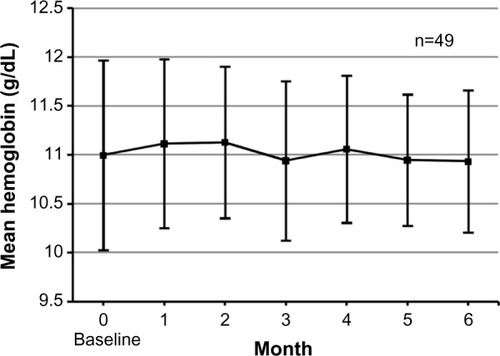
Figure 14 Percentage of patients in the target hemoglobin (Hb) range of 10–12 g/dL and the trend in the Hb standard deviation at regular blood tests.
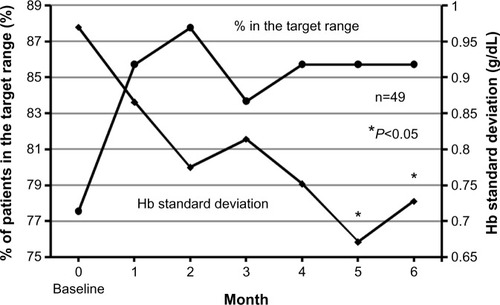
Table 2 Comparisons between baseline data (0 month) and data at the end of our study (6 months)
Discussion
Our anemia management algorithm, which comprised an iron algorithm () and an ESA algorithm (–), succeeded in controlling Hb values and iron indices in the following ways. First, our algorithm increased the number of patients in the target Hb range of 10–12 g/dL (). Second, our algorithm significantly decreased the Hb standard deviation (). We believe that the increase in the number of patients in the target Hb range was associated with the stability of mean Hb values at approximately 11 g/dL () and the decrease in the Hb standard deviation ( and ). Third, our iron algorithm suppressed cumulative doses of iron and significantly decreased ferritin values ().
These results imply a better prognosis for hemodialysis patients. First, the increase in the numbers of patients in the target Hb range implies better outcomes. Maintaining Hb values within a certain range is important because too high or too low Hb values have been shown to worsen prognosis.Citation4–Citation8 The Japanese Society for Dialysis Therapy reported that the 5-year survival rate of hemodialysis patients was best in the Hb range of 10–11 g/dL; in young hemodialysis patients, that was best in the Hb range of 11–12 g/dL.Citation6 Therefore, because the target Hb range of 10–12 g/dL in our study was associated with an improved prognosis, the increase in the number of patients within this range implies a better prognosis overall.
Second, the decrease in the amount of the Hb standard deviation suggests better outcomes. Pisoni et al had reported that the facility-level Hb standard deviation was strongly and positively associated with mortality.Citation25 Although further investigations are required for evaluating whether this result can be applied to a patient, Pisoni et al had also reported that facility-level Hb standard deviation was strongly associated with within-patient Hb variability,Citation25 which had been reported to be positively associated with mortality.Citation26 Therefore, a decrease in the Hb standard deviation may indicate a better prognosis.
Finally, suppressing cumulative doses of iron and decreasing ferritin values also possibly led to better outcomes. Kuo et al had reported that a cumulative intravenous iron dose of >800 mg for 6 months significantly increased risks of cardiovascular events and overall mortality in hemodialysis patients.Citation27 To this, our iron algorithm prevented excessive iron administration in patients with high Hb values and suppressed consecutive iron administration when Hb values ranged from ≥10 to <11 g/dL (). Consequently, no patient received a cumulative intravenous iron dose of >800 mg during our 6-month study period, suggesting a better prognosis. In addition, our iron algorithm also decreased ferritin values. Hasuike et al had reported that the high ferritin group (≥100 ng/mL; median ferritin, 161.9 ng/mL) was associated with a poor prognosis compared with the low ferritin group (<100 ng/mL; median ferritin, 37 ng/mL),Citation28 whose ferritin values were similar to those at the end of our study (). Therefore, decreased ferritin values also suggest a better prognosis. In contrast, we think that our algorithm also succeeded in preventing iron deficiency because there were no significant differences in ESA doses and Hb values between baseline data and data at the end of study ().
There have been many anemia management algorithms for hemodialysis patients.Citation14–Citation22 Kalicki and Uehlinger have argued that algorithms should take into account all information that includes at least one erythrocyte lifetime.Citation23 Using this concept, Lines et al reported about a predictive algorithm that considered the length of erythrocyte lifetimes and predicted Hb values at 90 days after the last ESA dose change.Citation21 However, we believe that their algorithm did not consider any short-term Hb changes and thus lost the flexibility to adapt to unexpected occurrences. In contrast, several algorithms incorporating iron indices have been reported,Citation14,Citation17,Citation19–Citation21 but we think that even with these algorithms, the combination of ESA management and iron administration was insufficient.
Our ESA algorithm incorporated two mechanisms that would lead to appropriate ESA management. One mechanism acknowledged the importance of the length of erythrocyte lifetimes, and the other incorporated the combination of ESA management and iron administration. Our successful anemia management was based on these two mechanisms.
By incorporating the mechanism related to the length of erythrocyte lifetimes, our ESA algorithm became particularly sensitive or permissive to Hb changes that were associated with recent ESA dose changes. Kalicki and Uehlinger also have argued that the time needed to achieve a steady state for hematocrit values after an increase in the ESA dose is equal to one erythrocyte lifetime,Citation23 which is approximately 60–90 days.Citation29,Citation30 Thus, our algorithm broadly classified ESA dose changes into the following cases: cases after a recent ESA increase (Chart numbers 3 and 4), a case after a recent ESA decrease (Chart number 5), and a case in a steady state (Chart number 1). Because of these classifications, our algorithm became sensitive or permissive to Hb changes so that our algorithm could appropriately manage the ESA doses. Moreover, Mizuguchi has argued that after an ESA dose change, it takes more than 1 week before there is a change in Hb values because an erythroid colony-forming unit, which ESA acts on, will need 1 week to develop into an erythrocyte.Citation31 Because of this delay in the Hb reaction, the Hb change at 1 month after an ESA increase will be relatively insufficient. Therefore, we made the chart at 1 month after the ESA increase (Chart number 3; ) more permissive to Hb decreases than the chart at 1.5–3 months after the ESA increase (Chart number 4; ). In contrast, we regarded a delay in the Hb reaction to an ESA decrease as ignorable because other than ESA decreases, there may have been myriad causes that led to decreases in Hb values.Citation21
Next, by incorporating the mechanism for the combination of ESA management and iron administration, we were able to use our ESA algorithm to appropriately manage ESA doses depending on the state of recent iron administration. In general, Hb values increase after iron administrationCitation32 and decrease in iron deficiency.Citation33 However, if Hb changes attributed to the iron status had been incorrectly categorized as Hb changes because of an excess or a deficiency in ESA doses, unnecessary ESA dose changes may be made and a stable control of Hb values will be difficult to achieve. Therefore, our ESA algorithm incorporated the management of ESA doses according to the state of iron administration for preventing unnecessary ESA dose changes. This combination mechanism was integrated in Conditions B and D–F.
Condition B was created for preventing unnecessary ESA decreases. With Condition B, when Hb values increased after recent iron administration without subsequent iron administration later, our ESA algorithm did not decrease ESA doses because this increase was probably due to iron administration and was probably transient. Nakanishi et al had estimated that if the Hb value increased by 0.2–0.3 g/dL, 30–50 mg of the intravenous iron had been used for erythropoiesis.Citation34 With this information, after 160 mg of intravenous iron (one course in our study) was administered, the Hb value may increase by 0.6–1.6 g/dL; this range was similar to that in Condition B ( and –). Thus, our ESA algorithm distinguished Hb increases after recent iron administration from Hb increases that were probably due to excessive ESA doses and prevented unnecessary ESA decreases.
Conversely, Conditions D–F were created for preventing unnecessary ESA increases. For Conditions D–F, if Hb values were stagnated or decreased because of insufficient iron administration and iron could be administered later, our ESA algorithm did not increase ESA doses because these Hb changes were likely due to iron deficiency. By doing so, our ESA algorithm prevented unnecessary ESA increases. However, for preventing additional Hb decreases, decisions to increase ESA doses were easier with Conditions E and F than with Condition D. Using Condition E, if iron had been administered for 3 consecutive months, our algorithm increased ESA doses because the Hb reaction to iron administration was poor (). Using Condition F, our algorithm increased ESA doses unless there was a plan to administer iron hereafter; if there had been no recent iron administration, the Hb reaction to iron administration may still be good ().
Our study has several limitations. First, our study evaluated a small sample size during a relatively short period, and it was not a randomized control trial. Although we indicated the possibility of our algorithm for a better prognosis, to evaluate whether our algorithm actually improves the prognosis of hemodialysis patients, we would require a larger sample size during a longer period. Additional studies will be required to evaluate our algorithm.
Second, the benefit from maintaining Hb values continuously within the target range remains unknown as it has been described as difficult and has been rarely achieved.Citation12,Citation13 For 6 months, we succeeded in maintaining Hb values continuously within the target range of 10–12 g/dL in more than half of the patients. Using our algorithm, the benefit from maintaining Hb values continuously may become clear.
Third, because our algorithm became somewhat complicated, a software program may be useful for supporting hemodialysis practices. Therefore, we designed and used such a program in our study.
Conclusion
Our anemia management algorithm successfully increased the number of patients in the target Hb range of 10–12 g/dL, significantly decreased the Hb standard deviation, suppressed cumulative doses of iron, and decreased ferritin values. These results suggest a better prognosis for hemodialysis patients.
Author contributions
All authors have contributed to the study. Kazuhiro Hara, Yasuhide Mizutani, Hitoshi Kodera, and Masato Miyake were the physicians in charge of patient care (including monitoring of Hb values), and they evaluated decisions made according to our anemia management algorithm. Yoshiki Yasuda and Sanae Ohara, clinical engineers, were in charge of supervising the implementation of our anemia management algorithm. Moreover, Yoshiki Yasuda and Sanae Ohara also contributed to the appropriate operation of the program that quickly made decisions based on our algorithm using Microsoft Office Excel® 2007. All coauthors contributed equally to the critical revisions of this manuscript.
Acknowledgments
The authors sincerely appreciate the advice and comments from Daijo Inaguma.
Disclosure
The authors report no conflicts of interest in this work.
References
- EschbachJWEgrieJCDowningMRBrowneJKAdamsonJWCorrection of the anemia of end-stage renal disease with recombinant human erythropoietin. Results of a combined phase I and II clinical trialN Engl J Med1987316273783537801
- EschbachJWAbdulhadiMHBrowneJKRecombinant human erythropoietin in anemic patients with end-stage renal disease. Results of a phase III multicenter clinical trialAnn Intern Med19891111299210002688507
- EschbachJWKellyMRHaleyNRAbelsRIAdamsonJWTreatment of the anemia of progressive renal failure with recombinant human erythropoietinN Engl J Med198932131581632747747
- MaJZEbbenJXiaHCollinsAJHematocrit level and associated mortality in hemodialysis patientsJ Am Soc Nephrol199910361061910073612
- LocatelliFPisoniRLCombeCAnaemia in haemodialysis patients of five European countries: association with morbidity and mortality in the Dialysis Outcomes and Practice Patterns Study (DOPPS)Nephrol Dial Transplant200419112113214671047
- TsubakiharaYNishiSAkibaT2008 Japanese Society for Dialysis Therapy: guidelines for renal anemia in chronic kidney diseaseTher Apher Dial201014324027520609178
- BesarabABoltonWKBrowneJKThe effects of normal as compared with low hematocrit values in patients with cardiac disease who are receiving hemodialysis and epoetinN Engl J Med199833995845909718377
- CotterDJStefanikKZhangYThamerMImproved survival with higher hematocrits: where is the evidence?Semin Dial200417318118315144538
- LocatelliFBárányPCovicAKidney disease: improving global outcomes guidelines on anaemia management in chronic kidney disease: a European Renal Best Practice position statementNephrol Dial Transplant20132861346135923585588
- USRDSorg [homepage on the Internet]Bethesda, MDNational Institutes of HealthNational Institute of Diabetes and Digestive and Kidney Diseases2014 Available from: http://www.usrds.org/adr.aspxAccessed March 29, 2015
- FDA.gov [homepage on the Internet]Rockville, MDThe US Food and Drug Administration2011 Available from: http://www.fda.gov/Drugs/DrugSafety/ucm259639.htmAccessed March 29, 2015
- PortolésJMde FranciscoALGórrizJLMaintenance of target hemoglobin level in stable hemodialysis patients constitutes a theoretical task: a historical prospective studyKidney Int200874111S82S87
- EbbenJPGilbertsonDTFoleyRNCollinsAJHemoglobin level variability: associations with comorbidity, intercurrent events, and hospitalizationsClin J Am Soc Nephrol2006161205121017699349
- ThakuriaMOfsthunNJMullonCDiaz-BuxoJAAnemia management in patients receiving chronic hemodialysisSemin Dial201124559760221999745
- BrierMEGawedaAEDaileyAAronoffGRJacobsAARandomized trial of model predictive control for improved anemia managementClin J Am Soc Nephrol20105581482020185598
- GawedaAEAronoffGRJacobsAARaiSNBrierMEIndividualized anemia management reduces hemoglobin variability in hemodialysis patientsJ Am Soc Nephrol201425115916624029429
- BrimbleKSRabbatCGMcKennaPLambertKCarlisleEJProtocolized anemia management with erythropoietin in hemodialysis patients: a randomized controlled trialJ Am Soc Nephrol200314102654266114514745
- HoWRGermainMJGarbJUse of 12×/month haemoglobin monitoring with a computer algorithm reduces haemoglobin variabilityNephrol Dial Transplant20102582710271420176613
- MurakamiKSuzukiTUchinoJThe influence that renal anemia management in the low ferritin (<60 ng/mL) gives to an anemia-related various factorsKidney and Dialysis2013743463467 [in Japanese]
- PattersonPAllonMProspective evaluation of an anemia treatment algorithm in hemodialysis patientsAm J Kidney Dis19983246356419774126
- LinesSWLindleyEJTattersallJEWrightMJA predictive algorithm for the management of anaemia in haemodialysis patients based on ESA pharmacodynamics: better results for less workNephrol Dial Transplant20122762425242922207330
- MiskulinDCWeinerDETighiouartHComputerized decision support for EPO dosing in hemodialysis patientsAm J Kidney Dis20095461081108819781831
- KalickiRMUehlingerDERed cell survival in relation to changes in the hematocrit: more important than you thinkBlood Purif200826435536018493121
- KanjiGKTest 17 F-Test for Two Population Variances (with Correlated Observations), in 100 Statistical Tests3rdLondon, UKSage20064647
- PisoniRLBragg-GreshamJLFullerDSFacility-level interpatient hemoglobin variability in hemodialysis centers participating in the Dialysis Outcomes and Practice Patterns Study (DOPPS): associations with mortality, patient characteristics, and facility practicesAm J Kidney Dis201157226627521251541
- YangWIsraniRKBrunelliSMJoffeMMFishbaneSFeldmanHIHemoglobin variability and mortality in ESRDJ Am Soc Nephrol200718123164317018003781
- KuoKLHungSCLinYPIntravenous ferric chloride hexahy-drate supplementation induced endothelial dysfunction and increased cardiovascular risk among hemodialysis patientsPLoS ONE2012712e5029510.1371/journal.pone.0050295 Available from: http://journals.plos.org/plosone/article?id=10.1371/journal.pone.0050295Accessed March 29, 201523227165
- HasuikeYNonoguchiHTokuyamaMSerum ferritin predicts prognosis in hemodialysis patients: the Nishinomiya studyClin Exp Nephrol201014434935520467772
- VosFESchollumJBCoulterCVDoyleTCDuffullSBWalkerRJRed blood cell survival in long-term dialysis patientsAm J Kidney Dis201158459159821715072
- SatoYMizuguchiTShigenagaSShortened red blood cell lifespan is related to the dose of erythropoiesis-stimulating agents requirement in patients on hemodialysisTher Apher Dial201216652252823190511
- MizuguchiTDosing regimens of erythropoiesis-stimulating agents in hemodialysis patients in terms of bone marrow hematopoiesisKidney and Dialysis2013751125132 [in Japanese]
- CoyneDWKapoianTSukiWFerric gluconate is highly effi-cacious in anemic hemodialysis patients with high serum ferritin and low transferrin saturation: results of the Dialysis Patients’ Response to IV Iron with Elevated Ferritin (DRIVE) StudyJ Am Soc Nephrol200718397598417267740
- ChungMChanJAMoorthyD [Investigators]Biomarkers for assessing and managing iron deficiency anemia in late-stage chronic kidney disease: future research needs: identification of future research needs from comparative effectiveness review no 83Future Research Needs PapersRockville, the United StatesAgency for Healthcare Research and Quality20131Report No: 13-EHC038-EF Available from: http://www.ncbi.nlm.nih.gov/books/NBK143610/Accessed March 29, 2015
- NakanishiTHasuikeYNagasawaYKuraganoTHow much intravenous iron is utilized for erythropoiesis?Am J Med201312611e2710.1016/j.amjmed.2013.05.028 Available from: http://www.amjmed.com/article/S0002-9343%2813%2900733-X/fulltextAccessed March 29, 201524157298