
Abstract
Purpose
This study was undertaken to investigate the impact of menopause duration on the risk factors and components of metabolic syndrome (MetS).
Patients and Methods
Women aged between 45 and 60 years participated in the study. Participants were split into two groups based on the duration of menopause. Women who had been menopausal for 1 to ≤5 years constituted Group 1, while women with 6–10 years of menopause duration formed Group 2.
Results
Significant differences were observed between the two groups for various factors associated with MetS, including anthropometric measurements, biochemical markers, and blood pressure. The conicity index, weight-to-hip ratio, waist-to-height ratio, visceral adiposity index (VAI), and menopause duration were associated with increased risk of MetS. Our multivariate logistic regression model showed that women with elevated VAI had a 2.073-fold (95% CI: 1.73–2.48, p<0.001) increased risk of MetS, while women with menopause duration more than 5 years had a 6.44-fold (95% CI: 3.336–12.45, p<0.001) increased risk of MetS.
Conclusion
The duration of menopause was found to be linked to a higher risk of MetS. Our results emphasize the importance of monitoring and managing metabolic health in women during the menopausal period, particularly those with extended menopause duration.
Introduction
Menopause is defined as the end of female reproductive capacity and occurs at approximately 45–55 years of age.Citation1 Estrogen declines during menopause, resulting in changes in the body that may include bone loss, increased abdominal fat, and a more unfavorable cardiovascular risk profile, although not all women experience obvious symptoms. Menopausal status also significantly increases the likelihood of developing cardiovascular diseases, type 2 diabetes mellitus, and metabolic syndrome (MetS).Citation2 MetS is also known as Reaven syndrome, insulin resistance syndrome, and syndrome X. It is defined according to various parameters specified by organizations including the World Health Organization (WHO), National Cholesterol Education Program Adult Treatment Panel III (NCEP-ATP III), and International Diabetes Federation (IDF).Citation3 Hypertension, hypertriglyceridemia, central obesity, hyperglycemia, and low high-density lipoprotein cholesterol (HDL-C) are among the diagnostic criteria for MetS.Citation4
Menopause is also accepted as an indicator of MetS in women regardless of age. The risk of developing MetS increases with years after menopause, but the full impact of duration of menopause remains unclear.Citation5 The prevalence of MetS also varies according to the characteristics of the population such as genetic profile, eating habits, and lifestyle. The MetS prevalence among postmenopausal women in Turkey was reported as 15.5%.Citation6
In postmenopausal women, weight gain and obesity are particularly effective in increasing the prevalence of MetS. Due to the increase in visceral fat, the functions of the adipose tissue deteriorate, resulting in chronic low-grade inflammation and lipotoxicity. The inflammation and altered circulating adipokines promote angiogenesis and have been implicated as risk factors for colorectal, endometrial, and postmenopausal breast cancer. Furthermore, adipocyte-cancer cell crosstalk leads to morphological and functional changes in adipose tissue, resulting in the proliferation, invasion, and metastasis of tumor cells.Citation7
Central obesity is characterized by increased visceral adipose tissue and contributes more to MetS risk than general adiposity.Citation8 Increased visceral fat and waist circumference (WC) are powerful independent predictors of metabolic change.Citation9 Furthermore, the waist-to-height ratio (WHtR), visceral adiposity index (VAI), and conicity index (C-index) are commonly applied parameters that have significant correlations with central obesity. The VAI is a mathematical index for evaluating visceral fat and the C-index is used for assessing the distribution of body fat, both of which are reliable predictors of MetS risk.Citation10,Citation11 Considering the impact of the aforementioned parameters, this study was conducted to evaluate the relationship between MetS and the duration of menopause.
Patients and Methods
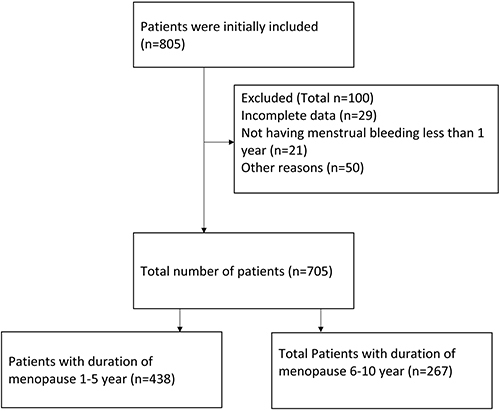
The study included 705 women aged between 45 and 60 years. The study design was cross-sectional and the participants were volunteers selected from the general population of women in Turkey in 2020–2021. Ethical approval of the study protocol was granted by the local ethics committee of Ankara Medipol University (08.27.2021/31). Menopause was defined as the lack of menstrual periods for more than 1 year.Citation1 Participants were split into two groups based on the duration of menopause; women who had been menopausal for 1 to ≤5 years constituted Group 1 (n=438), while women with 6–10 years of menopause formed group 2 (n=267). Women who were undergoing hormone replacement therapy, experienced surgical menopause, underwent chemotherapy or radiotherapy, or had liver disease, kidney disease, or a history of cardiac failure or thyroid surgery were excluded from the study. Participants were informed about the research protocol and they provided their informed consent. The questionnaire used in this study was administered to the participants in face-to-face interviews.
This questionnaire was specifically designed to collect relevant data from postmenopausal women; a validated scale was not used in this study.
The questionnaire was organized within the following sections:
Demographic Characteristics
This section was intended to obtain data related to the participant’s age, education level, occupation, and general health status.
Anthropometric Measurements
The body composition, height, body weight, hip circumference (HC), and WC of all participants were measured by a researcher. Body mass index (BMI) was calculated as weight (kg)/height squared (m2). BMI values of ≥30.0 kg/m2 were considered as signifying obesity, while BMI values of 25–29.9 kg/m2 were categorized as overweight, 18.5 to 24.9 kg/m2 as normal or healthy weight, and <18.5 kg/m2 as underweight.Citation12 The weight-to-hip ratio (WHR) was calculated as WC/HC. A previous study confirmed that women were at high risk of MetS in the event of WC of ≥88 cm or WHR of >0.85. In the present study, WHR, WHtR, VAI, and C-index values were calculated to facilitate the evaluation of central obesity.Citation13,Citation14 The following equations were applied:
MetS
MetS was identified according to the NCEP-ATP III and IDF criteria. For that purpose, systolic blood pressure and diastolic blood pressure were measured after participants had rested for 10 min in a sitting position. Three consecutive measurements of blood pressure were taken from both arms. Blood tests included fasting blood glucose (FBG), total cholesterol (TC), HDL-C, low-density lipoprotein cholesterol (LDL-C), and TG.Citation15,Citation16
The primary outcome of the study was determining the association between duration of menopause and MetS. The secondary outcome of the study was defining the predictive power of anthropometric measurements for MetS.
Statistical Analysis
All statistical analyses conducted in this study were performed using IBM SPSS Statistics 20.0 (IBM Corp., Armonk, NY, USA). Continuous variables were described as means and standard deviations, and categorical variables were presented as frequencies and percentages. Independent samples t-tests and chi-square tests were performed for comparisons of the groups. Receiver operating characteristic (ROC) curve analysis was performed to evaluate the predictive power of the variables for MetS. A multivariate logistic regression model was established. Values of p<0.001 were accepted as significant with 95% confidence intervals.
Results
presents the comparisons of anthropometric measurements, biochemical data, and MetS components between the groups. There were no differences in BMI values or HDL-C levels between the groups.
Table 1 Comparison of Descriptive Statistics and Anthropometric Measurements of the Groups
Looking at the prevalences of metabolic abnormalities and MetS among the participants, there were differences between the groups in terms of FBG, WC, elevated blood pressure, and MetS. Group 2 had a higher frequency of abnormalities in FBG, higher WC values, and elevated blood pressure compared to Group 1 (44.9% vs 31.4%, 94.3% vs 87.1%, and 48.7% vs 35.1%, respectively; p<0.001). The number of women who met the criteria for MetS was higher in Group 2 than in Group 1 (87 vs 137 participants; p=0.001) ().
Table 2 Prevalence of Metabolic Abnormalities and MetS Among Groups
Univariate logistic regression analysis revealed that WHR, WHtR, C-index, VAI, and menopause duration were associated with an increased risk of MetS. Multivariate logistic regression analysis was then performed, and it was found that women with elevated VAI values had a 2.073-fold (95% CI: 1.73–2.48, p<0.001) increased risk of MetS, while women with menopause duration more than 5 years had a 6.44-fold (95% CI: 3.336–12.45, p<0.001) increased risk of MetS ().
Table 3 Univariate and Multivariate Logistic Regression Analysis of the Variables for MetS
A flowchart of this study is shown in . The study comprised 805 patients initially, with the final analysis conducted on 705 women.
Figure 1 Flow Chart of the Study.
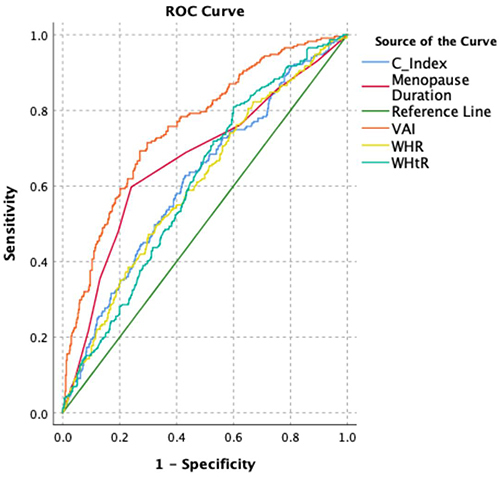
demonstrates the ROC analysis results for the ability of WHR, WHtR, C-index, VAI, and menopause duration to predict MetS. The ROC analysis revealed that although all of these variables had statistical significance, the area under the curve (AUC) value was highest for the VAI, followed by menopause duration.
Figure 2 ROC analysis of C-index, Menopause Duration, VAI, WHR and WHtR for predictability of MetS (AUC of C-index:0.612, cut off point: 1.632 sensitivity:60.6%, specificity:58.1%; AUC of VAI:0.755, cut off point:2.19, sensitivity:71.4%, specificity:70.3%, AUC of WHtR:0.607, cut off point:0.61, sensitivity:57.1%, specificity:56.8%, AUC of WHR:0.755, cut off point:0.89, sensitivity:58%, specificity:57.1%, AUC of Menopause Duration: 0.667, cut off point:5, sensitivity:68.8%, specificity:62.4%).
Discussion
The occurrence of MetS varies between 10% and 84% worldwide according to the diagnostic criteria that are applied.Citation17,Citation18 These diagnostic criteria include various physiological, biochemical, clinical, and metabolic factors, together with anthropometric measurements. Advanced age is a crucial risk factor for developing MetS, as reported by the NHANES III study conducted with data from 2011–2016, which showed a 39.4% risk in the age group of 40–59 years and a 48.6% risk in the age group of >60 years.Citation19
In our study, in Group 2, abnormalities in FBG, higher WC values, and elevated blood pressure were found more frequently. While WHR, WHtR, C-index, VAI, and menopause duration were all associated with an increased risk of MetS, the AUC value of the VAI was highest, followed by menopause duration.
Central obesity is associated with increased rates of insulin resistance, hypertension, diabetes, impaired lipid profile, and elevated blood glucose. It is also a cornerstone of MetS and leads to increased cardiometabolic risk.Citation20 In our study, both Group 1 and Group 2 had significantly higher TG and FBG levels and lower HDL-C levels among overweight women compared to those with normal body weight. Bhosale et al reported no difference in HDL-C levels between the control and MetS groups, but they determined significant differences for TG, LDL-C, and FBG.Citation21 In the present study, we found that women in Group 2 had higher FBG, TC, TG, and LDL-C values than those in Group 1 (p<0.001). The severity of overweight was associated with an increased risk of MetS. Overweight women with metabolic disorders have twice the risk of developing cardiovascular diseases and diabetes compared to individuals with normal body weight without MetS. Furthermore, individuals with normal weight and MetS have a threefold increased risk of cardiovascular diseases and fourfold increased risk of diabetes.Citation22 Excessive abdominal weight, which is more closely related to central obesity than BMI,Citation16 is a pivotal factor contributing to MetS.Citation17 Changes in body fat mass occur during menopause. A one-year follow-up study revealed a significant increase in women’s WC, fat mass, and fat percentage values after menopause, while lean mass decreased considerably.Citation23 Another 5-year study reported substantial increases in total fat mass, body fat percentage, body fat mass, and visceral fat values in postmenopausal women.Citation24 Recently, WHtR has been suggested as a better indicator of MetS than BMI and WC.Citation25 WHR and WC are parameters used to measure visceral and abdominal fat distribution, providing better results than BMI.Citation26 Previous studies evaluating MetS have shown that WHtR values above 0.5 are associated with increased cardiometabolic risk, surpassing BMI and WHR in terms of its power as a discriminating marker.Citation27,Citation28 In a study conducted with young adults in the United States, a WHtR cutoff point of 0.58 was found to predict the presence of MetS.Citation29 In our study, we found that the WHR, WHtR, VAI, and C-index were valuable in predicting the presence of MetS, consistent with the relevant literature indicating increased body mass and BMI values in menopausal women.
The emergence of metabolic risk factors in the postmenopausal period may directly result from estrogen deficiency and ovarian failure.Citation30 Ovarian hormones have cardioprotective effects, and decreased levels of endogenous estrogen, especially in cases of early menopause, may lead to imbalanced lipid profiles and a higher risk for the development of cardiovascular diseases.Citation31
Estrogen is involved in processes of gluteofemoral fat deposition, and its loss during menopause is associated with increased abdominal fat. In addition, the loss of ovarian function causes negative changes in lipoprotein profile, glucose and insulin metabolism, vascular endothelial dysfunction, and body fat distribution.Citation32
In our study, the most important risk factor for MetS was found to be the duration of menopause. Yu et al found that women with menopause duration of more than 20 years were more likely to experience MetS and increased blood pressure compared to those with menopause duration of less than 10 years.Citation33 Cho et al showed that the risk of developing MetS increased with the duration of menopause in postmenopausal women. They also found that it reached peak levels at 10–14 years.Citation34 Zhou et al obtained similar results in a Chinese population. They revealed a relationship between years since menopause and MetS, and the highest risk of MetS was reported for patients with menopause duration of 5–9 years.Citation35 Variations in the impact of menopause duration among these studies may be attributed to differences in ethnic backgrounds. Regarding the metabolic abnormalities associated with MetS, our study showed that women who had been menopausal for more than 5 years had a significantly higher risk of MetS than women who had been menopausal for ≤5 years.
There are several limitations of this study that need to be considered. First, the participants were volunteers selected from the general population of women in Turkey. The non-random sampling method may have introduced selection bias and the results may not be generalizable to the extended population or other ethnic groups. Furthermore, the study relied on self-reported data, including information on nutritional habits and behaviors, which may have affected the accuracy of the data.
Conclusion
This study highlights the impact of menopause on metabolic health in women. The duration of menopause emerged as a significant risk factor, indicating the progressive nature of metabolic changes during this period. Targeting alterable risk factors such as central obesity may potentially mitigate the risk of MetS and its associated complications. Larger studies are warranted to explore the underlying mechanisms of menopausal MetS and develop tailored interventions for this high-risk population.
Institutional Review Board Statement
The study was conducted in accordance with the Declaration of Helsinki, and the protocol was approved by the Ethics Committee of Ankara Medipol University (08.27.2021/31).
Author Contributions
All authors made significant contributions to the work reported, whether in the conception, study design, execution, acquisition of data, analysis and interpretation, or all of these areas; took part in drafting, revising, or critically reviewing the article; gave final approval of the version to be published; agreed on the journal to which the article has been submitted; and agreed to be accountable for all aspects of the work.
Disclosure
The authors report no conflicts of interest in this work.
References
- Santoro N, Roeca C, Peters BA, et al. The menopause transition: signs, symptoms, and management options. J Clin Endocrinol Metab. 2021;106(1):1–15. doi:10.1210/clinem/dgaa764
- Honour JW. Biochemistry of the menopause. Ann Clin Biochem. 2018;55(1):18–33. doi:10.1177/0004563217739930
- Saklayen MG. The global epidemic of the metabolic syndrome. Curr Hypertens Rep. 2018;20(2):12. doi:10.1007/s11906-018-0812
- Mumusoglu S, Yildiz BO. Metabolic syndrome during menopause. Curr Vasc Pharmacol. 2019;17(6):595–603. doi:10.2174/1570161116666180904094149
- Jeong HG, Park H. Metabolic disorders in menopause. Metabolites. 2022;12(10):954. doi:10.3390/metabo12100954
- Yoldemir T, Garibova N, Atasayan K. The association between sexual dysfunction and metabolic syndrome among Turkish postmenopausal women. Climacteric. 2019;22(5):472–477. doi:10.1080/13697137.2019.1580256
- Cozzo AJ, Fuller AM, Makowski L. Contribution of adipose tissue to development of cancer. Compr Physiol. 2017;8(1):237–282. doi:10.1002/cphy.c170008
- Misra A, Soares MJ, Mohan V, et al. Body fat, metabolic syndrome and hyperglycemia in South Asians. J Diabetes Complications. 2018;32(11):1068–1075. doi:10.1016/j.jdiacomp.2018.08.001
- Uruska A, Zozulinska-Ziolkiewicz D, Niedzwiecki P, et al. TG/HDL-C ratio and visceral adiposity index may be useful in assessment of insulin resistance in adults with type 1 diabetes in clinical practice. J Clin Lipidol. 2018;12(3):734–740. doi:10.1016/j.jacl.2018.01.005
- Gadelha AB, Myers J, Moreira S, et al. Comparison of adiposity indices and cut-off values in the prediction of metabolic syndrome in postmenopausal women. Diabetes Metab Syndr. 2016;10(3):143–148. doi:10.1016/j.dsx.2016.01.005
- Leite NN, Cota BC, Gotine AREM, et al. Visceral adiposity index is positively associated with blood pressure: a systematic review. Obes Res Clin Pract. 2021;15(6):546–556. doi:10.1016/j.orcp.2021.10.001
- Schetz M, De Jong A, Deane AM, et al. Obesity in the critically ill: a narrative review. Intensive Care Med. 2019;45(6):757–769. doi:10.1007/s00134-019-05594-1
- Motamed N, Perumal D, Zamani F, et al. Conicity index and waist-to-Hip ratio are superior obesity indices in predicting 10-year cardiovascular risk among men and women. Clin Cardiol. 2015;38(9):527–534. doi:10.1002/clc.22437
- Freedman DS, Thornton JC, Pi-Sunyer FX, et al. The body adiposity index (Hip circumference ÷ height(1.5)) is not a more accurate measure of adiposity than is BMI, waist circumference, or Hip circumference. Obesity. 2012;20(12):2438–2444. doi:10.1038/oby.2012.81
- Cheal KL, Abbasi F, Lamendola C, et al. Relationship to insulin resistance of the adult treatment panel III diagnostic criteria for identification of the metabolic syndrome. Diabetes. 2004;53(5):1195–1200. doi:10.2337/diabetes.53.5.1195
- Grundy SM, Cleeman JI, Daniels SR, et al. Diagnosis and management of the metabolic syndrome: an American heart association/National heart, lung, and blood institute scientific statement. Circulation. 2005;112(17):2735–2752. doi:10.1161/CIRCULATIONAHA.105.169404
- Fahed G, Aoun L, Bou Zerdan M, et al. Metabolic syndrome: updates on pathophysiology and management in 2021. Int J Mol Sci. 2022;23(2):786. doi:10.3390/ijms23020786
- Aguilar M, Bhuket T, Torres S, et al. Prevalence of the metabolic syndrome in the United States, 2003-2012. JAMA. 2015;313(19):1973–1974. doi:10.1001/jama.2015.4260
- Hirode G, Wong RJ. Trends in the prevalence of metabolic syndrome in the United States, 2011-2016. JAMA. 2020;323(24):2526–2528. doi:10.1001/jama.2020.4501
- Tchernof A, Després JP. Pathophysiology of human visceral obesity: an update. Physiol Rev. 2013;93(1):359–404. doi:10.1152/physrev.00033.2011
- Bhosale VV, Singh S, Srivastava M, et al. A case control study of clinical and biochemical parameters of metabolic syndrome with special attention among young and middle aged population. Diabetes Metab Syndr. 2019;13(4):2653–2659. doi:10.1016/j.dsx.2019.07.031
- Meigs JB, Wilson PW, Fox CS, et al. Body mass index, metabolic syndrome, and risk of type 2 diabetes or cardiovascular disease. J Clin Endocrinol Metab. 2006;91(8):2906–2912. doi:10.1210/jc.2006-0594
- Razmjou S, Abdulnour J, Bastard JP, et al. Body composition, cardiometabolic risk factors, physical activity, and inflammatory markers in premenopausal women after a 10-year follow-up: a MONET study. Menopause. 2018;25(1):89–97. doi:10.1097/GME.0000000000000951
- Abdulnour J, Doucet E, Brochu M, et al. The effect of the menopausal transition on body composition and cardiometabolic risk factors: a Montreal-Ottawa new emerging team group study. Menopause. 2012;19(7):760–767. doi:10.1097/gme.0b013e318240f6f3
- Yang H, Xin Z, Feng JP, et al. Waist-to-height ratio is better than body mass index and waist circumference as a screening criterion for metabolic syndrome in Han Chinese adults. Medicine. 2017;96(39):e8192. doi:10.1097/MD.0000000000008192
- Hajian-Tilaki K, Heidari B. Is waist circumference a better predictor of diabetes than body mass index or waist-to-height ratio in Iranian adults?. Int J Prev Med. 2015;6:5. doi:10.4103/2008-7802.151434
- Ashwell M, Gibson S. Waist-to-height ratio as an indicator of ‘early health risk’: simpler and more predictive than using a ‘matrix’ based on BMI and waist circumference. BMJ Open. 2016;6(3):e010159. doi:10.1136/bmjopen-2015-010159
- Kawamoto R, Kikuchi A, Akase T, et al. Usefulness of waist-to-height ratio in screening incident metabolic syndrome among Japanese community-dwelling elderly individuals. PLoS One. 2019;14(4):e0216069. doi:10.1371/journal.pone.0216069
- Bohr AD, Laurson K, McQueen MB. A novel cutoff for the waist-to-height ratio predicting metabolic syndrome in young American adults. BMC Public Health. 2016;16:295. doi:10.1186/s12889-016-2964-6
- Jesmin S, Islam AM, Akter S, et al. Metabolic syndrome among pre- and post-menopausal rural women in Bangladesh: result from a population-based study. BMC Res Notes. 2013;6:157. doi:10.1186/1756-0500-6-157
- Kim SH, Sim MY, Park SB. Association between duration of reproductive lifespan and Framingham Risk Score in postmenopausal women. Maturitas. 2015;82(4):431–435. doi:10.1016/j.maturitas.2015.07.011
- Ko SH, Kim HS. Menopause-associated lipid metabolic disorders and foods beneficial for postmenopausal women. Nutrients. 2020;12(1):202. doi:10.3390/nu12010202
- Yu W, Hu X, Yang L, et al. Duration of reproductive years and time since menopause were associated with metabolic syndrome in postmenopausal parous women of Chinese ancestry. Menopause. 2020;27(2):216–222. doi:10.1097/GME.0000000000001445
- Cho GJ, Lee JH, Park HT, et al. Postmenopausal status according to years since menopause as an independent risk factor for the metabolic syndrome. Menopause. 2008;15(3):524–529. doi:10.1097/gme.0b013e3181559860
- Zhou Y, Guo X, Sun G, et al. Exploring the link between number of years since menopause and metabolic syndrome among women in rural China: a cross-sectional observational study. Gynecol Endocrinol. 2018;34(8):670–674. doi:10.1080/09513590.2018.1441400