
Abstract
Background
Allergic rhinitis (AR) is the most prevalent form of non-infectious rhinitis and is characterized by an immune response mediated by immunoglobulin E (IgE).
Aim
This study aims to compare the levels of biochemical markers and other parameters in individuals with AR, non-allergic rhinitis(n-AR), allergic rhinitis accompanied by symptoms of the lower respiratory tract(AR-SLRT), and healthy controls.
Study Design
Case control study.
Methods
Blood samples from the three study groups, AR (n = 22), n-AR (n=20), AR-SLRT group (n = 21), and the control group (n = 18), were analyzed to ascertain the levels of total IgE, specific IgE, periostin, pendrin, vitamin D, thyroid-stimulating hormone (TSH), free triiodothyronine (Ft3), free thyroxine (Ft4), anti-thyroid peroxidase (TPO), and eosinophilic cationic protein (ECP), as well as the leukocyte formula and hemogram.
Results
The AR and n-AR groups had significantly higher hematocrit values in comparison to the control group(p<0.05). Further, eosinophil counts were significantly higher in the AR and AR-SLRT groups than in the control group(p<0.05). Total IgE levels were significantly higher in the AR-SLRT group than in the AR, n-AR, and control groups (p<0.05). The AR group had higher total IgE values compared to the control group and the n-AR group(p<0.05). The values of ECP, periostin, pendrin, Ft3, Ft4, TSH, anti-TPO, and vitamin D did not differ significantly between the groups(p>0.05).
Conclusion
All the investigated groups did not differ in ECP, periostin, pendrin, Ft3, Ft4, TSH, anti-TPO, or vitamin D parameters. The groups with positive AR and AR-SLRT had higher eosinophil counts than the control group. The group with AR-SLRT had higher total IgE concentrations than the other groups.
Introduction
Allergic rhinitis (AR) represents a global health concern and is the most prevalent form of chronic rhinitis, afflicting 10–20% of the population and exhibiting an upward trend in prevalence.Citation1,Citation2 Seidman et alCitation3 found that the prevalence of AR among adults peaks in the second to fourth decade of life and then progressively declines. It is the most typical type of rhinitis that is not caused by an infection. It is caused by an immune response to allergens in the air that is mediated by immunoglobulin E (IgE).Citation2,Citation3 AR, caused by inflammation of the nasal mucosa, is characterized by nasal symptoms such as anterior or posterior nasal obstruction, sneezing, and/or a runny nose. AR is frequently associated with ocular symptoms such as red, watery, and irritated eyes.Citation4,Citation5 Additionally, the extent of exposure to the causative agent may have an impact on the severity of AR symptoms.Citation6
As a public health concern, allergic diseases are on the rise. In both developed and developing nations, the prevalence of allergic diseases has increased in recent decades. This global epidemic has become a significant public health concern,Citation7,Citation8 with treatment costs that are substantial and increasing.Citation9 The effect of AR on labor productivity is estimated to cost between €30 billion and €50 billion per year in the European Union.Citation9 The economic impact of AR is frequently underestimated due to the high indirect costs.
Clinical allergy symptoms and diagnostic assays, such as skin tests and serum-specific IgE levels, are used to diagnose AR.Citation10 Several studies have demonstrated that a number of biochemical parameters and inflammatory mediators are altered in AR. Regarding the function of periostin and pendrin in the pathophysiology of AR, many recent studies have reported conflicting results.Citation11,Citation12 Other studiesCitation13,Citation14 point to the importance of vitamin D3 (25-hydroxyvitamin D) in allergic diseases. Arshi et alCitation14 found that the prevalence of severe vitamin D deficiency was significantly higher in patients with AR than in the normal population, suggesting a correlation between vitamin D levels and AR status.
There is evidence that IgE and mast cells also play an important role in the long-term pathophysiological changes and tissue remodeling that come with asthma and other conditions with chronic allergic inflammation.Citation15 Abd El-Aziz et alCitation16 discovered a correlation between autoimmune thyroid diseases and AR. The determination of the eosinophilic cationic protein (ECP) level is essential,Citation17 as is the evaluation of inflammation and the severity of the disease. In other words, variances in the levels of analyzed biochemical markers and parameters have been reported among patients with allergic rhinitis as compared to the control group in different populations. This study’s goal is to examine the levels of biochemical markers (periostin, anion transporter pendrin/SLC26A4, vitamin D, anti-TPO, and ECP) and other factors in patients with AR, non-allergic rhinitis (n-AR), allergic rhinitis accompanied by symptoms of the lower respiratory tract (AR-SLRT), and a healthy control group.
Materials and Methods
Our investigation included 81 patients recruited prospectively from the Allergy and Immunology Clinic in Prishtina, Kosova. The diagnosis of AR was based on the Allergic Rhinitis and Its Impact on Asthma (ARIA) guideline, whereas for the definition of n-AR we relies to current definition of Non-Allergic Rhinitis which excludes an allergic mechanism mediated by IgE.Citation18,Citation19 This study was conducted over a two-year period.
Patients with AR (n = 22), patients with non-allergic rhinitis (n-AR, n = 20), and patients with allergic rhinitis accompanied by symptoms of the lower respiratory tract (AR-SLRT, n = 21) made up the three study groups. For comparison, there were 18 participants in the healthy control group who had negative allergy results. Study inclusion criteria were patients with an allergy immunologist-confirmed diagnosis of AR; patients with AR complicated with lower respiratory tract symptoms; patients with clinical symptoms of AR; an age range of 18 to 65; and patients of both sexes. Of note, patients receiving immunotherapy, glucocorticoids administered orally or parenterally in the last six months, various anti-inflammatory medications, vitamin D supplements, post-myocardial infarction conditions lasting less than three months, organ transplant recipients, and individuals of other chronic diseases were excluded from the study. Beside these exclusion criteria, the control group had no rhinitis symptoms, negative specific IgE tests, no acute or chronic illness within the previous three months, and no medication.
During the study, all the patients were informed in writing about the study’s goals, how it would be carried out, and how their information would be kept private, and they gave their written permission. The results of total IgE, specific IgE, periostin, pendrin, vitamin D, TSH, Ft3, Ft4, anti-TPO, eosinophilic cationic protein (ECP), hemogram, and leukocyte formula were found by taking a 10 mL sample of venous blood. The samples were taken in the morning, after the individuals had gone 12 hours without eating. After taking the blood samples, they were kept frozen in a cooler at a temperature of −20 °C. Everyone who took part in the study did so freely. Before venipuncture, all the patients had a general clinical examination to assess individual patients. Periostin, pendrin, and eosinophilic cationic protein (ECP) were determined by the ELISA method (enzyme-linked immunosorbent assay) according to the manufacturer’s guide of specific kits (Cloude-clone Corp.), while the level of vitamin D 25(OH)D (25-hydroxy vitamin D), TSH, FT3, Ft4, and anti-TPO in serum was evaluated by the ECLIA method (electrochemiluminescence immunoassay ECLIA, Elecsys, Cobas E411-Roche, Germany). The Beckman-Coulter automatic cell counter was used to determine erythrocytes, leukocytes, hematocrit, and hemoglobin. Total immunoglobulin IgE and serum specific IgE (sIgE) to prevalent aeroallergens were measured using the AllergyScreen test (Mediwiss Analytic GmbH, Moers, Germany) per the manufacturer’s instructions.Citation20
We measured the levels of IgE in the serum that was reacting to aeroallergens like dermatophagoides peteronyssinus, dermatophagoides farina, alder, brich, hazel, mugwort, ribwortin planatain, mixed grasses, cat epithel, dog epithel, Penicillium, Alternaria, Aspergillus, and Cladosporium herbarum. To determine the presence or absence of an atopic predisposition, specific IgE results were utilized. The AllergyScreen® algorithm classified IgEs into seven levels: level 0 (0.35 IU/mL), level 1 (0.35–0.70 IU/mL), level 2 (0.70–3.50 IU/mL), level 3 (3.5–17.5 IU/mL), level 4 (17.5–50 IU/mL), level 5 (50–100 IU/mL), and level 6 (>100 IU/mL). IgE levels >0.35 IU/mL were regarded as positive, and the significant reference range for total serum IgE was >100 IU/mL.Citation21 When patients were sensitized to one or more aeroallergens, it was deemed that they had an atopic disposition. The study fully complies with the Declaration of Helsinki, and the protocol was approved by the Ethics Committee of the Faculty of Medicine, University of Prishtina “Hasan Prishtina” (ethical approval number 5244/18).
Categorical variables are presented with frequency (n) and percentage (%), while continuous variables are presented with mean, standard deviation (SD), median, and interquartile range (IRQ). Using the Shapiro–Wilk and Kolmogorov–Smirnov tests, the normal distribution for continuous variables was analyzed. According to the normality distribution of the continuous variables, we used for the comparative analyses the Kruskal–Wallis H-test, ANOVA, and post hoc Tukey’s tests. Version 21 of the statistical package for the social sciences (SPSS) was used to analyze the data. It was regarded as statistically significant at p<0.05. The sample size was analyzed post hoc using the G*Power program; for a total sample of 81 participants divided into 4 groups, with an effect size of = 0.4 and an α err prob of 0.05, the power (1-β err prob) was calculated to be statistically accepted (0.850).
Results
represents the gender and age distribution of the participants in the three study groups: AR (n = 22), n-AR (n = 20), AR-SLRT (n = 21), and the control group (n = 18).
Table 1 Sociodemographic Data of Study Participants According to Groups
The ANOVA analysis revealed a statistically significant difference in erythrocyte values between the groups. The Tukey post hoc analysis revealed that the control group had significantly fewer erythrocytes than the n-AR group (p<0.05) (). The number of leukocytes and the amount of hemoglobin did not significantly differ between the groups (p>0.05). However, statistically significant differences in hematocrit values were observed between the groups. demonstrates that the groups with allergic and n-AR have higher hematocrit values than the control group (p<0.05). The groups also differed in terms of their average platelet volume and platelet count ( and ). demonstrates that the groups with AR, n-AR, and AR-SLRT had lower platelet volumes than the control group (p<0.05).
Table 2 Comparison of the Hematological Parameters of the Participants According to Groups
Table 3 Comparison of the Leucocyte Formula of the Participants According to Groups
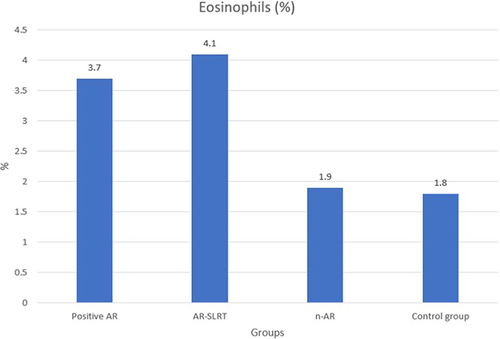
shows that the group with n-AR had a significantly higher number of platelets than the other groups (p<0.05). Monocytes varied between the groups, but there was a significant difference between certain groups. reveals that the group with AR-SLRT had significantly higher levels of monocytes than the group with n-AR and the control group (p<0.05). There was also a statistically significant difference in eosinophil values between the groups (). As shown in , the groups with positive AR and AR-SLRT had significantly higher eosinophil counts than the control group (p<0.05).
Figure 1 The percentage (%) of Eosinophils according to study groups.
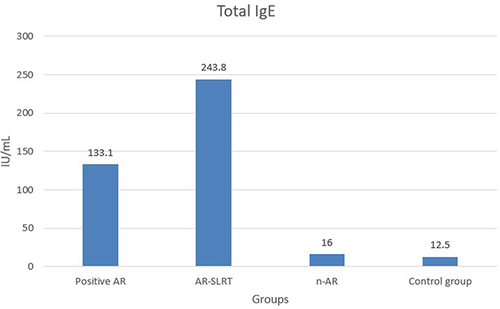
There were statistically significant differences in the levels of total IgE between groups (). The group with AR-SLRT has significantly higher total IgE levels than the groups with AR, n-AR, and the control group (p<0.05). In addition, the group with AR has significantly higher total IgE levels than the group with n-AR and the control group (p<0.05) (). There were no statistically significant differences in the levels of ribonuclease A3, periostin, pendrin, free T3, free T4, TSH, anti-TPO, and vitamin D between the groups (p>0.05) ().
Table 4 Comparison of the Total IgE, Periostin, Ft3, Ft4, TSH, Anti-TPO and Vitamin D Parameters of the Participants According to Groups
Figure 2 Total IgE (UI/mL) median values according to study groups.
Discussion
Our key results show that there is a statistically significant difference in total IgE levels between the study groups (AR, n-AR, AT-SLRT, and the control group). However, biochemical indicators like ribonuclease A3, periostin, SLC26A4, Ft3, Ft4, TSH, anti-TPO, and vitamin D did not differ significantly between the study groups. Hematological indicators such as erythrocyte count, hematocrit, platelet count, monocyte count, and eosinophil count were also shown to have statistically significant differences across the groups.
Serum IgE concentrations and total eosinophil counts are known to accurately reflect AR.Citation22,Citation23 In addition, the eosinophil cationic protein level and eosinophil count were found to be substantially correlated in AR patients who had positive skin tests for house dust mite, animal, and pollen allergens.Citation24 The groups with AR and AR-SLRT had higher eosinophil levels than the control group. The AR-SLRT had higher total IgE levels than the AR, n-AR, and control groups. In addition, the AR group had higher total IgE levels than the n-AR and control groups.In their study, Kant and Terzioğlu found that AR patients had significantly higher levels of absolute eosinophils, eosinophil-to-neutrophil ratio, and eosinophil-to-lymphocyte ratio, and significantly lower levels of neutrophil-to-lymphocyte ratio than healthy controls.Citation25 Similar to our study, it has been reported that the mean values of serum log IgE and eosinophil levels were higher in AR patients compared to healthy controls.Citation26 In other reports, the median level of total IgE in asthma and AR patients was significantly higher than in controls, but there was no statistically significant difference between AR and asthma patients.Citation27 In line with our study, it has been reported that the number of serum eosinophils was significantly higher in the eosinophilic chronic rhinosinusitis groups than in the non-eosinophilic chronic rhinosinusitis groups.Citation28 However, in contrast to our study, other authors reported no significant difference in blood eosinophils between AR and non-AR patients.Citation29 This discrepancy in reports regarding eosinophils may be due to genetic or other population-specific differences.
In our study, the levels of ribonuclease A3, periostin, and SLC26A4 did not differ significantly between the groups with AR, n-AR, and AR-SLRT and the control group. Incompatible with our study, another study by Ishida et al, reported that patients with AR and chronic rhinosinusitis produced significantly more pendrin and periostin than controls.Citation30 Ito et al, in their study concluded that people with eosinophilic chronic rhinosinusitis have more pendrin expression in the epithelial surface layer of their nasal polyps than people with non-eosinophilic chronic rhinosinusitis.Citation28 Moreover, according to Hashino et al,Citation31 an enhancement in the rhinoconjunctivitis quality of life questionnaire score was related to serum periostin levels. Gabri et al, revealed in their study that serum periostin level in children with bronchial asthma were significantly higher compared to healthy controls.Citation32 In addition, Kimura et alCitation33 demonstrated that serum periostin and BMI were negatively correlated in both healthy and asthmatic subjects. Therefore we can say that serum periostin level may have limited utility as a biomarker of allergic disease and as a predictor of allergic asthma.
Vitamin D levels were not significantly different among our study groups. However, 100% (n = 18) in the control group and 81.8% (18/22) in the AR group showed vitamin D deficiency (20 ng/mL), as did 95.0% (20/21) in the n-AR group and 95.2% (19/20) in the AR-SLRT. Other authors reported similar results. Along with others, 93% of AR patients had a vitamin D deficiency, and 56% of this group had a severe deficiency, according to the findings of a study.Citation23 In addition, Arshi et alCitation14 discovered that patients with AR had a significantly higher prevalence of severe vitamin D deficiency than the general population. Another study by Tamašauskienė et al,Citation34 reported no statistically significant differences in vitamin D levels between allergic and non-allergic asthma groups, while the research conducted by Bukhari et al,Citation35 demonstrated that patients with vitamin D deficiency had elevated serum eosinophil levels. It has been reported that when AR is caused by a lack of vitamin D, taking vitamin D supplements can help relieve symptoms and may lower the total nasal symptom score and total eosinophilic count.Citation36 In contrast, Forno et al, in their study, demonstrated that, in comparison to a placebo, vitamin D3 treatment did not appreciably reduce the time to a severe asthma exacerbation in children with persistent asthma.Citation37
In our study, there were no significant differences between the groups at the level of free T3, free T4, TSH, and anti-TPO. Similar to this, in their study Ismaeil et al, demonstrated that children suffering from bronchial asthma compared to healthy children did not differ significantly in the thyroid profile (FT3, FT4, TSH, anti-TPO, and anti-TG).Citation38 Kasumagic-Halilovic et al, on the other hand, demonstrated in their research that, in comparison to the healthy control group, the levels of anti-TG and anti-TPO were much greater in those who suffered from chronic urticaria.Citation39
Our findings are also limited by the study’s design and sample size. Because of the research strategy and the small sample size, the findings cannot be generalized to the entire population. The study took up to two years to collect data due to the difficulty in recruiting patients with the AR-SLRT and without asthma. Furthermore, the study design made it impossible to limit the environmental conditions to which the individuals were exposed. Even though specific seasons are associated with increased symptomatology due to allergens, we did not intend to collect additional samples from the group at various times of the year. No therapeutic intervention was intended to compare the hematological and biochemical marker responses between study groups. An additional limitation of the study is that we did not investigate the imaging evaluation of the nasal cavities and sinuses in the study groups to identify potential risks. Other studies with larger sample sizes that follow the different groups prospectively and minimize environmental influencing factors may provide a more complete picture of patients with AR and n-AR symptoms as well as hematological and biochemical parameters.
Conclusions
In conclusion, we saw that the parameters of ribonuclease A3, periostin, SLC26A4, Ft3, Ft4, TSH, anti-TPO, and vitamin D did not vary significantly between AR, n-AR, AR-SLRT and control groups. More research is required before drawing any conclusions regarding the thyroid profile of individuals who suffer from allergic diseases. Compared to the control group, the group with AR-SLRT had higher eosinophil counts. In comparison to the other groups, those with AR-SLRT had the highest total IgE levels. In each group, the majority of participants showed a deficiency in vitamin D. Consequently, alongside other hematological and biochemical parameters, it is important to monitor vitamin D levels in patients with AR and n-AR.
Ethics
The study complies fully with the Declaration of Helsinki, and the Ethical Committee of the Faculty of Medicine of University of Prishtina “Hasan Prishtina” has approved the study protocol (no. 5244/18).
Disclosure
All authors declare no conflicts of interest in this work.
Acknowledgment
The authors acknowledge the University of Prishtina and Dr. Bajram Abdullahu for supporting this project.
Data Sharing Statement
The data that support the findings of this study are available from the corresponding author upon reasonable request.
References
- Dykewicz MS, Hamilos DL. Rhinitis and sinusitis. J Allergy Clin Immunol. 2010;125(2):S103–S115. doi:10.1016/j.jaci.2009.12.989
- Brożek JL, Bousquet J, Baena-Cagnani CE, et al. Allergic rhinitis and its impact on asthma (ARIA) guidelines: 2010 revision. J Allergy Clin Immunol. 2010;126(3):466–476. doi:10.1016/j.jaci.2010.06.047
- Seidman MD, Gurgel RK, Lin SY, et al. Clinical practice guideline: allergic rhinitis. Otolaryngol Head Neck Surg. 2015;152:S1–S43. doi:10.1177/0194599814561600
- Small P, Frenkiel S, Becker A, et al. Rhinitis: a practical and comprehensive approach to assessment and therapy. J Otolaryngol. 2007;36:1.
- Shedden A. Impact of nasal congestion on quality of life and work productivity in allergic rhinitis: findings from a large online survey. Treat Respir Med. 2005;4:439–446. doi:10.2165/00151829-200504060-00007
- Rapiejko P, Jurkiewicz D, Pietruszewska W, Zielnik-Jurkiewicz B, Woroń J, Lipiec A. Treatment strategy of allergic rhinitis in the face of modern world threats. Otolaryngol Polsk. 2018;72(2). doi:10.5604/01.3001.0011.8057
- Platts-Mills TA. The allergy epidemics: 1870-2010. J Allergy Clin Immunol. 2015;136(1):3–13. doi:10.1016/j.jaci.2015.03.048
- Campbell DE, Mehr S. Fifty years of allergy: 1965–2015. J Paediatr Child Health. 2015;51(1):91–93. doi:10.1111/jpc.12806
- Zuberbier T, Lötvall J, Simoens S, Subramanian S, Church MK. Economic burden of inadequate management of allergic diseases in the European Union: a GA2LEN review. Allergy. 2014;69(10):1275–1279. doi:10.1111/all.12470
- Min Y-G. The pathophysiology, diagnosis and treatment of allergic rhinitis. Allergy Asthma Immunol Res. 2010;2(2):65–76. doi:10.4168/aair.2010.2.2.65
- Matsumoto H. Serum periostin: a novel biomarker for asthma management. Allergol Int. 2014;63(2):153–160. doi:10.2332/allergolint.13-RAI-0678
- Matsusaka M, Kabata H, Fukunaga K, et al. Phenotype of asthma related with high serum periostin levels. Allergol Int. 2015;64(2):175–180. doi:10.1016/j.alit.2014.07.003
- Bouillon R, Norman AW, Lips P. Vitamin D deficiency. N Engl J Med. 2007;357(19):1980–1981.
- Arshi S, Ghalehbaghi B, Kamrava S-K, Aminlou M. Vitamin D serum levels in allergic rhinitis: any difference from normal population? Asia Pacific Allergy. 2012;2(1):45–48. doi:10.5415/apallergy.2012.2.1.45
- Galli SJ, Tsai M. IgE and mast cells in allergic disease. Nature Med. 2012;18(5):693–704. doi:10.1038/nm.2755
- El-Aziz MF A, Rafaat MM, Sabry IM, Yousef M, Mandour A. Study of thyroid auto-antibodies in patients with bronchial asthma and allergic rhinitis. Thyr Sci. 2010;5(2):1.
- Moneret-Vautrin D-A. Le dosage de la protéine cationique des éosinophiles est-il un marqueur utile pour l’interniste? La Revue de médecine interne. 2006;27(9):679–683. doi:10.1016/j.revmed.2006.02.007
- Bousquet J, Khaltaev N, Cruz AA, et al. Allergic rhinitis and its impact on asthma (ARIA) 2008. Allergy. 2008;63:8–160. doi:10.1111/j.1398-9995.2007.01620.x
- Poddighe D, Gelardi M, Licari A, Del Giudice MM, Marseglia GL. Non-allergic rhinitis in children: epidemiological aspects, pathological features, diagnostic methodology and clinical management. World J Methodol. 2016;6(4):200. doi:10.5662/wjm.v6.i4.200
- Jiang R, Zhu M, Jia Y, Jiang Z. Measurement and analysis of serum specific IgE and total IgE in children with chronic eczema. Chin J Lab Diagn. 2009;13:935–937.
- Chang ML, Cui C, Liu YH, Pei LC, Shao B. Analysis of total immunoglobulin E and specific immunoglobulin E of 3721 patients with allergic disease. Biomed Rep. 2015;3(4):573–577. doi:10.3892/br.2015.455
- Hameed MK, Sharif A, Khizar M. Serum IgE levels and total eosinophil count in allergic rhinitis. J Islam Internat Med Coll. 2020;15(3):154–158.
- Alnori H, Alassaf FA, Alfahad M, Qazzaz ME, Jasim M, Abed MN. Vitamin D and immunoglobulin E status in allergic rhinitis patients compared to healthy people. J Med Life. 2020;13(4):463. doi:10.25122/jml-2020-0015
- Li Y, Wu R, Tian Y, Bao T, Tian Z. The correlation of serum eosinophil cationic protein level with eosinophil count, and total IgE level in Korean adult allergic rhinitis patients. Asian Pac J Allergy Immunol. 2016;34(1):33–37. doi:10.12932/AP0746
- Kant A, Terzioğlu K. Association of severity of allergic rhinitis with neutrophil-to-lymphocyte, eosinophil-to-neutrophil, and eosinophil-to-lymphocyte ratios in adults. Allergol Et Immunopathol. 2021;49(5):94–99. doi:10.15586/aei.v49i5.204
- Sharma M, Khaitan T, Raman S, Jain R, Kabiraj A. Determination of serum IgE and eosinophils as a diagnostic indicator in allergic rhinitis. Indian J Otolaryngol Head Neck Surg. 2019;71:1957–1961. doi:10.1007/s12070-018-1383-7
- Ahmed MB, Ad’hiah AH. Effects of age, gender and allergen type on immunoglobulin E level in asthma and allergic rhinitis patients. Iraqi J Sci. 2022;1498–1506. doi:10.24996/ijs.2022.63.4.10
- Ito T, Ikeda S, Asamori T, et al. Increased expression of pendrin in eosinophilic chronic rhinosinusitis with nasal polyps. Brazil J Otorhinolaryngol. 2019;85:760–765. doi:10.1016/j.bjorl.2018.07.005
- Luo Q, Zhou S, Yuan B, Feng Z, Tan G, Liu H. Blood eosinophil count in the diagnosis of allergic‐like rhinitis with chronic rhinosinusitis. Clin Otolaryngol. 2023;48(2):339–346. doi:10.1111/coa.13990
- Ishida A, Ohta N, Suzuki Y, et al. Expression of pendrin and periostin in allergic rhinitis and chronic rhinosinusitis. Allergol Int. 2012;61(4):589–595. doi:10.2332/allergolint.11-OA-0370
- Hoshino M, Akitsu K, Kubota K, Ohtawa J. Serum periostin as a biomarker for predicting clinical response to house dust mite sublingual immunotherapy in allergic rhinitis. J All Clin Immunol Pract. 2021;9(5):1864–1870. doi:10.1016/j.jaip.2020.11.046
- Gabri M, Sedik A, Ismail A, Sayed W, Aly H, Zaki E. Serum periostin level in children with bronchial asthma. Egypt J Pediat All Immunol. 2022;20(1):39–48. doi:10.21608/ejpa.2022.61587.1021
- Kimura H, Konno S, Makita H, et al. Serum periostin is associated with body mass index and allergic rhinitis in healthy and asthmatic subjects. Allergol Int. 2018;67(3):357–363. doi:10.1016/j.alit.2017.11.006
- Tamašauskienė L, Gasiūnienė E, Lavinskienė S, Sakalauskas R, Šitkauskienė B. Evaluation of vitamin D levels in allergic and non-allergic asthma. Medicina. 2015;51(6):321–327. doi:10.1016/j.medici.2015.11.003
- Bukhari AF, Felemban MJ, Alem H. The association between serum 25-Hydroxyvitamin D levels and patients with allergic rhinitis. Cureus. 2020;12(8). doi:10.7759/cureus.9762
- Agarwal S, Singh SN, Kumar R, Sehra R. Vitamin D: a modulator of allergic rhinitis. Indian J Otolaryngol Head Neck Surg. 2019;71:2225–2230. doi:10.1007/s12070-019-01697-9
- Forno E, Bacharier LB, Phipatanakul W, et al. Effect of vitamin D3 supplementation on severe asthma exacerbations in children with asthma and low vitamin D levels: the VDKA randomized clinical trial. JAMA. 2020;324(8):752–760. doi:10.1001/jama.2020.12384
- Ismaeil NY, Hemeda Moustafa A, Farouk Mosa M. Assesment of thyroid profile and auto antibodies in children with asthma at al-hussein university hospital. Al-Azhar J Pediat. 2020;23(3):1038–1047.
- Kasumagic-Halilovic E, Beslic N, Ovcina-Kurtovic N. Thyroid autoimmunity in patients with chronic urticaria. Medical Archives. 2017;71(1):29. doi:10.5455/medarh.2017.71.29-31