
 ?Mathematical formulae have been encoded as MathML and are displayed in this HTML version using MathJax in order to improve their display. Uncheck the box to turn MathJax off. This feature requires Javascript. Click on a formula to zoom.
Abstract
Background
Developing inhibitors is a rare event during the treatment of hemophilia A. The multifacets and uncertainty surrounding the development of inhibitors further complicate the process of estimating inhibitor rate from the limited data. Bayesian statistical modeling provides a useful tool in generating, enhancing, and exploring the evidence through incorporating all the available information.
Methods
We built our Bayesian analysis using three study cases to estimate the inhibitor rates of patients with hemophilia A in three different scenarios: Case 1, a single cohort of previously treated patients (PTPs) or previously untreated patients; Case 2, a meta-analysis of PTP cohorts; and Case 3, a previously unexplored patient population – patients with baseline low-titer inhibitor or history of inhibitor development. The data used in this study were extracted from three published ADVATE (antihemophilic factor [recombinant] is a product of Baxter for treating hemophilia A) post-authorization surveillance studies. Noninformative and informative priors were applied to Bayesian standard (Case 1) or random-effects (Case 2 and Case 3) logistic models. Bayesian probabilities of satisfying three meaningful thresholds of the risk of developing a clinical significant inhibitor (10/100, 5/100 [high rates], and 1/86 [the Food and Drug Administration mandated cutoff rate in PTPs]) were calculated. The effect of discounting prior information or scaling up the study data was evaluated.
Results
Results based on noninformative priors were similar to the classical approach. Using priors from PTPs lowered the point estimate and narrowed the 95% credible intervals (Case 1: from 1.3 [0.5, 2.7] to 0.8 [0.5, 1.1]; Case 2: from 1.9 [0.6, 6.0] to 0.8 [0.5, 1.1]; Case 3: 2.3 [0.5, 6.8] to 0.7 [0.5, 1.1]). All probabilities of satisfying a threshold of 1/86 were above 0.65. Increasing the number of patients by two and ten times substantially narrowed the credible intervals for the single cohort study (1.4 [0.7, 2.3] and 1.4 [1.1, 1.8], respectively). Increasing the number of studies by two and ten times for the multiple study scenarios (Case 2: 1.9 [0.6, 4.0] and 1.9 [1.5, 2.6]; Case 3: 2.4 [0.9, 5.0] and 2.6 [1.9, 3.5], respectively) had a similar effect.
Conclusion
Bayesian approach as a robust, transparent, and reproducible analytic method can be efficiently used to estimate the inhibitor rate of hemophilia A in complex clinical settings.
Background
Challenges in estimating the development of inhibitors
The development of inhibitory antibodies, usually IgG 4, is a natural response of the host immune system to exogenous factor VIII in patients with hemophilia, who are devoid of endogenous factor VIII and therefore not naturally tolerant to it. Some forms of immunological reaction are observed in more than half of the patients at the first exposure to factor VIII. In many cases, the antibodies are able to block factor VIII clotting activity, and their presence can be detected and quantitated using a specific test, the Bethesda assay. Inhibitory responses of more than five Bethesda units are called high responding antibodies. Approximately one-third of inhibitors disappear spontaneously, while others are persistent, making exogenous factor VIII ineffective and requiring the use of bypassing agents to stop bleeding or prolonged administration of high-dose factor VIII to eradicate the inhibitor (immune tolerance induction treatment).
Developing inhibitors against factor VIII concentrates is the most severe and costly complication of the treatment of hemophilia A.Citation1 Patients who develop inhibitors tend to have more severe bleeds, either because they are often treated on demand more than prophylactically, or because their bleeds are more difficult to stop. As to the utilization of factor concentrates, this might be lower, when patients are preferentially treated with bypassing agents, or higher, when low-titer or subclinical inhibitors are treated with factor VIII, usually requiring a neutralizing dose (formally calculated or empirically determined) in addition to the usual dose of concentrates required to prevent bleeding.
There are several reasons that complicate studying the determinants of inhibitor development.Citation2 The first is that the development of inhibitory antibodies is a combination of different events, more than a single one, with nothing as simple as black and white.Citation3–Citation6 The second is the uncertainty of explaining both known and unknown risk factors associated with the development of inhibitors.Citation7,Citation8 The third is the rarity of the disease, which hampers the opportunity to obtain substantial comparative data.Citation2
In this challenging scenario, it is important to determine the risk associated with specific brands or classes of factor concentrates, because the type of product is one of the few actionable risk factors in the field.Citation9,Citation10 Other characteristics of the treatment regimen such as dose, frequency, indication, and concomitant treatments or exposures also contribute to the risk of inhibitor development.Citation11–Citation13 Progress in this field requires a close collaboration with complementary expertise. Knowledge of immunology and basic science can help gain a broader and deeper understanding of the molecular and cellular mechanisms driving the development or breach of tolerance.Citation14–Citation17 Clinical investigators can work to dissect the common characteristics among the heterogeneous clinical manifestations of inhibitory responses. Epidemiologists and biostatisticians can develop more powerful and efficient ways of looking at the available data and generating new ones.
There are several unmet needs in the statistical models used to analyze observational data about inhibitor development, which relate to the rarity of adverse events in an already rare disease.Citation18–Citation24 The first critical issue is the scarcity of evidence, which emphasizes the need for incorporating external evidence to increase the power and the informative value of small and otherwise weak cohorts.Citation19 A second issue is the need for an efficient way to analyze the intricate relationship between treatment, time, and the varying risk of events over time.Citation25 A third is the need to adjust for covariates (known risk factors) when performing multivariable exploration of, for example, inhibitor rates in previously untreated patients (PUPs). The fourth and last is the proper assessment and comparison of event rates generated by nonparallel cohorts.Citation26–Citation28 In the current article, we address the first and fourth issues.
A powerful approach to the abovementioned problems might be a Bayesian framework. The Bayesian approach to interpreting experimental data from a clinical study consists of modeling the logical process leading to a change in opinion from before to after the availability of new information (the evidence provided by a new observation).
The benefit of the Bayesian approach derives from the opportunity of making use of existing knowledge in the assessment of data that extends to either incorporating that knowledge in the final results or using it as a standard to quantify the comparison between the new evidence and the previous knowledge. That knowledge could be a similar measure in a similar unrelated trial, or a threshold of clinical importance.
The concepts behind Bayesian inference
Statistical inference is the process of fitting a probability model to a set of observed samples from a population to summarize the results by a probability distribution on the parameters of interests to make a general statement about the population and predictions for new observations. In the classical (frequentist) approach, the statistical modeling involves only fitting a probability distribution to the observed experimental data to model the likelihood of the observed experimental data for a given estimate of interest such as treatment effect and incidence rate. Unlike the classical approach, the Bayesian approach combines experimental and prior or external information via the Bayes theorem, to produce the posterior distribution that is used to make all inferences about the estimate of interest.
(1) where δ is the parameter of interest.
(2)
As shown in EquationEquations 1(1) and Equation2
(2) , p(δ) represents prior distribution of the parameter of interest (henceforth to be referred to as “the parameter”), ie, the prior or external information about the estimate of treatment effect, incidence rate, etc; p(data|δ), the likelihood function, specifies the statistical model of the observed experimental data given the parameter; and p(δ|data) is the posterior distribution of the parameter, which is essentially a combination of the evidence provided by the observed experimental data and prior relevant data from clinical experience or past research evidence.Citation29,Citation30 In many cases, the posterior distribution p(δ|data) is intractable, and therefore to make inferences about the parameter the Bayesian approach uses Monte Carlo Markov Chain to obtain samples from the posterior p(δ|data).Citation31 Monte Carlo Markov Chain is an iterative process, with each iteration yielding a realization or observation from the posterior distribution p(δ|data). Typically, investigators will conduct a large number of iterations or simulations: 1,000–10,000, or even more. These are used to inform posterior inferences about the parameter. For example, the posterior mean or median is used to estimate the parameter, while the 2.5th and 97.5th observations are used as the 95% credible interval (CrI) for the parameter. The probability of the point estimate less than a certain threshold is abstained by calculating the proportion of the cases lower than the threshold over the total number of the interactions. provides a brief summary of the comparison of main features of the frequentist and Bayesian approaches in clinical trials. The difference between Bayesian and frequentist statistical inference is presented in , and the definitions and descriptions of Bayesian terminologies used in this article are given in .
Table 1 Brief comparison of the frequentist and Bayesian approaches in clinical trials
Table 2 Definitions of Bayesian statistical inference
Objectives of this article
By using real clinically observed data from the recently published articles,Citation32–Citation34 we aimed to demonstrate the benefits or advantages of Bayesian approach in estimating the risk of developing inhibitors among patients with hemophilia A from the following aspects: increasing the credibility of the results and the understanding of the underlying mechanisms by incorporating external evidence; generating probabilities to be used in a physician-to-patient interaction.
Methods
Overall study design
This article is built around three case studies and uses a standardized multistep approach to show 1) how the Bayesian results compare with those based on the commonly used classical approach; 2) the impact of different sources of external information used to construct a Bayesian prior; 3) the use of different sources of external information as thresholds against which to benchmark Bayesian posterior estimates of risk; and 4) the impact of the size of information on the Bayesian posterior estimates. In this section, we describe the three case studies, the statistical details, and the data source we used for the simulation.
Case study scenarios and patient populations
Case 1: analyzing a rare adverse event in a single cohort
The first case was set to represent the analysis of a single study, where all patients were treated with the same FVIII product, aiming to assess the rate of inhibitor development in the cohort of patients with hemophilia A including previously treated patients (PTPs) and PUPs. For this case, we reanalyzed the same cohort already published by Oldenburg et al.Citation32 We used this case to explore and discuss the basics of the Bayesian approach and the pros and cons of choosing different priors.
Case 2: analyzing a rare adverse event by pooling a set of studies in a meta-analysis
The second case was conceived to represent a meta-analysis of studies assessing the rate of inhibitors in a set of independent but similar studies in comparable populations of patients with hemophilia A; for this case, we used an earlier article we published.Citation33 The main goal of this case was to show how the evidence synthesized from meta-analysis can be further enhanced using Bayesian approach by incorporating external information through priors.
Case 3: analyzing the inhibitor rate in a previously unexplored setting
The third case illustrates how Bayesian method can be used to explore a new clinical setting for which no obvious priors are available in the literature. Although the study design and data collection were similar to the second case, the patient population was defined as the patients with low-titer inhibitors at baseline or positive personal history of inhibitors, which was definitely different and not directly comparable to any existing ones.Citation34 The challenge presented in this case was how to properly choose priors to explore an unstudied population. In addition to that, the data used in this case were extremely sparse in a multicenter/meta-analytical setting, where no outcomes were observed in some centers/studies (the so-called zero event).
Source data and outcome
The individual data sets used to build our cases for illustration purposesCitation32–Citation34 were from the ADVATE post-authorization safety studies (PASS) program. The study population in PASS studies were hemophilia A patients undergoing treatment (prophylaxis or on-demand) with ADVATE in routine clinical use. The primary safety outcome in these studies is defined as inhibitor levels during the study period including de novo, recurrent, and persistent inhibitors. We adopted the cutoffs of inhibitor classification specified in the original PASS protocols: 1.0 Bethesda unit (BU) for US, EU, and Australian PASS; and 0.6 BU for Japan, Italian, Korean, and Taiwan PASS (studies adopting the Nijmegen modification).Citation32,Citation33 More detailed description of the data such as hemophilia severity and FVIII exposure history and the case-specific definitions of inhibitors are presented in .
Table 3 Information of study data and outcome
Setting basic models with noninformative priors
For all the three cases, Bayesian statistical models with non-informative priors were introduced first as the basic starting model. For Case 1, classical logistic and Bayesian logistic models were used. For Case 2 and Case 3, classical random-effects logistic and Bayesian hierarchical random-effects logistic models were adopted, through which the patients from the same study were treated as within the same cluster. The random-effects model was adopted as the most common choice for individual patient data (IPD) meta-analyses. As for noninformative prior for log odds, the normal distribution with mean equals to zero (equal odds between developing or not developing inhibitor) and precision equals to 0.00001 were specified. The uniform distribution was used to specify the prior for the between-study standard deviation in the random-effects logistic model. The details of prior specifications are presented in Table S1.
Choosing informative priors
As a second step, we replaced noninformative priors with information-rich priors to incorporate the preexisting external information or knowledge from earlier studies into the analysis of the current study data. Unlike noninformative priors, informative ones contribute information to the posterior estimates, which can be looked at as a “combination” of the preexisting evidence with evidence generated by the current experiment. To this scope, we sought relevant comparable priors and tested two different sets of informative priors. The first set 1) comprised the data obtained during the treatment with a certain molecule (eg, rAHF-PFM) in different studies; specifically i) estimates of inhibitor rates from the manufacturer’s pivotal studiesCitation35; ii) estimates of inhibitor rates from a meta-analysisCitation36; and iii) estimates of inhibitor rates from an independent prospective multicentric cohort.Citation37 The second set of informative priors 2) comprised pooled inhibitor rates for any FVIII concentrate, including: i) a meta-analysisCitation36 and ii) an independent prospective multicenter cohort.Citation37 The details of generating informative priors, published data, are presented in Table S1.
In this study, Case 3 was specifically chosen not to have a study on the same patient population already available; thus, no obvious informative priors can be located in the literature. Notwithstanding, we wanted to show the value of the Bayesian approach in exploring how the rate of inhibitor development in this population would change when the known rate in PTPs and that in PUPs is added in. Consequently, in addition to the informative priors used in the first two cases, we also added the inhibitor rates for PUPs reported in the European Hemophilia Safety Surveillance (EUHASS) studyCitation37 for 1) the specific molecule and for 2) all products. The key rationale was to assess the robustness or sensitivity of the posterior inhibitor rates seen when a prior based on a truly high-risk population is used, ie, the worst-case scenarios. The details of generating priors for Case 3 are presented in Table S1.
Calculating probabilities
To make this more evident and show another peculiar property of the Bayesian framework, we further calculated, for the third case, the Bayesian probabilities of the posterior inhibitor rates being lower than three specific clinically meaningful thresholds, two high rates (10/100 and 5/100)Citation38 recommended by International Society on Thrombosis and Haemostasis (ISTH), and the US Food and Drug Administration (FDA)-mandated cutoff rate in PTPs (1/86).Citation39,Citation40 The probability was calculated as the cumulated proportion of the posterior inhibitor rate less than the threshold over the total number of iterations, ie, the number of resamplings used in each Bayesian model.
Weighting prior information
We then moved to show the effect of scaling down or discounting the value of the prior information in Case 3, for which due to the inability to use a full consistent informative prior, one might want to assign less weight to the information carried by the selected priors. The weight of the prior was reduced in the following ways: 1) by decreasing the precision, ie, enlarging the variance of the priors depending on how relevant the particular piece of information is to the study we are assessing.Citation30,Citation41 In our third case, we discount the precision of the rates of inhibitor in PUPs in EUHASS for the specific molecule and for any factor VIII concentrate by 75% and 95% each, respectively. This is equal to the human process of any perceived information: “you told me that the rate of event is this, but I only 25% trust your information”; and 2) a second approach to obtain the same objective, ie, to undervalue the contribution of the priors, is scaling up the weight of the study data by increasing the precision assigned to the experimental data. One easy and understandable way to do this is to simulate the impact on posterior estimates of increasing the study sample size. Thus, we showed the effect of increasing the study data sample size by two and ten times for all three study cases. The increment of sample was performed in two ways: 1) for all the three cases, increasing the number of events and number of patients in each center proportionally, ie, multiplying the numbers of events and patients for each center by two or ten times; and 2) for Cases 2 and 3, increasing the numbers of centers by two or ten times while keeping the numbers of events and patients in each center as the same as in the original data. We reran the Bayesian model with noninformative priors using the purposely inflated data for all the three cases to test the idea and then further reanalyzed the effect of data inflation for Case 3 with all informative priors previously used.
Analysis and reporting
Throughout this study, posterior inhibitor rates (our results) were reported as percentage rates with 95% associated confidence interval (CI) in the case of classic statistics, or 95% CrI in the case of Bayesian statistics. Graphic, descriptive statistics and classical meta-analyses were performed using STATA 13.1 (StataCorp LP, College Station, TX, USA). Bayesian analyses were performed using WinBUGS software 1.4.3 (http://www.mrc-bsu.cam.ac.uk/bugs/). In every Bayesian analysis, two chains were run simultaneously, and the convergence of the Bayesian models was assessed based on the history trace, posterior density, and autocorrelation plots for parameters of interest. The codes of Bayesian models that detailed setups on the Bayesian simulations are presented in the Table S2.
Results
Raw inhibitor rates in three cases
For Case 1, six inhibitors (1.4%) were reported among 428 patients. For Case 2, five studies were included in the IPD meta-analysis, and 21 inhibitors (1.8%) were reported in 1,188 patients. For Case 3, IPD were extracted from seven PASS, and six inhibitors (2.7) were reported in 219 patients ().
Table 4 Inhibitor rate (on percentage scale) for three different cases
Comparing results from Bayesian approach to classical approach
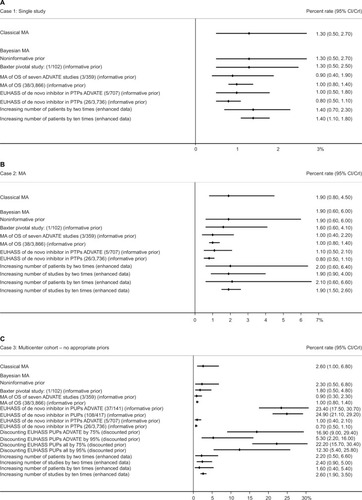
As expected, the results obtained from classical analytical approach and Bayesian statistical model using noninformative priors were similar for all the three cases. For the single cohort study (Case 1), the estimates were the same to one decimal place (percent rate [95% CI]: 1.3% [0.5, 2.7]; percent rate [95% CrI]: 1.3% [0.5, 2.7]). For the pooled analysis (Case 2), the Bayesian posterior estimates gave a slightly wider 95% CrI (1.9% [0.8, 4.5]) toward the lower end as compared to the estimate from the classical approach (1.9% [0.8, 4.5]). For the cohort of patients with previous/current inhibitor (Case 3), the posterior estimates from the Bayesian model showed a slightly lower percent rate and wider 95% CrI (2.3% [0.5, 6.8]) as compared to the estimate from classical approach (2.6% [1.0, 6.8]; , ).
Figure 1 Estimates of inhibitor rate obtained using classical or Bayesian approaches for three study cases A, B, C respectively.
Impact of using informative priors in Bayesian analysis
For Case 1 and 2, using external information as priors consistently narrowed the CrIs and lowered the central estimate of percentage rates. The range of the inhibitor percentage rates for the single cohort (Case 1) was 0.8%–1.3% and for the pooled analysis was 0.8%–1.9%. For the cohort of patients with previous/current inhibitor (Case 3), the posterior estimates of inhibitor percentage rates changed depending on the external information brought in by priors. The lowest percentage rates with narrowest 95% CrI was obtained using the informative prior generated from the EUHASS study of PTPs for all FVIII products: 0.7% (0.5, 1.1). The highest percentage rate was gained using the informative priors generated from the EUHASS study of PUPs for all FVIII products: 24.9% (21.1, 29.2; , ).
Comparing posterior inhibitor rates to thresholds
For the cohort of patients with previous/current inhibitor (Case 3), the posterior estimates of inhibitor rates were compared to the selected thresholds, and the probabilities of posterior inhibitor rates lower than the thresholds were then calculated. A probability of 1 means that the calculated rate of inhibitors is certainly below the threshold, and a probability of 0.5 means a 50% likelihood that the rate is below the threshold. Testing a threshold for the rate of inhibitors of 10%, six out of eight comparisons (when noninformative prior and informative priors were generated from the studies of PTPs) showed a probability >0.99. In contrast, when the EUHASS PUP study results were used as priors, the probabilities of a rate lower than 10% dropped dramatically to <0.001. Similar findings were obtained when the threshold was dropped to lower than 5%. When the threshold was dropped further to the FDA-approved rate for PTPs of 1/86, only the probability using priors for the EUHASS study in PTPs for all products was >0.9, but all estimations using PTPs as priors were still above 0.65 ().
Table 5 Probabilities calculated for the inhibitor rates lower than specific thresholds for Case 3
Impact of sample size of data
We found that increasing the number of patients narrowed the CrI for Case 1 (ie, the mimic of single-center studies), but had little impact on the posterior estimates of Cases 2 and 3, which represented multicenter study settings. However, when more centers were added to get the same sample size, the CrIs noticeably narrowed. Another interesting observation is that when the number of patients was increased in each center while the number of centers remained the same, the posterior inhibitor rates decreased for Case 3, in which three of seven centers reported no inhibitor event in the original data (; more exploratory results are found in Table S2).
Discussion
In this study, we used three cases from the real-world data to examine the abilities of the Bayesian approach in analyzing and interpreting rare events observed in a rare population. In comparison of the frequentist (or classical) approach, the advantages of Bayesian framework majorly lay on the following three points.
First, unlike the classical frequentist statistics, Bayesian approach provides a way to dynamically update the evidence around a certain event using all the available information. In fact, posterior estimates are weighted averages based on prior and current experimental evidence/data, with the weights determined by the precision of the corresponding evidence. As in our study cases, we updated the estimate of the inhibitor rate that is represented by the posterior distribution by combining the information on the inhibitor rate contained in our data and the knowledge on the inhibitor rate found in the external study. This nature leads to the continuous updates of the evidence upon the availability of new data. The most informative example of using the Bayesian framework is where the inhibitor rate among patients with low-titer inhibitor at baseline or personal history of the inhibitor had been given little consideration to date. Therefore, comparing the posterior estimates of the inhibitor rate obtained from the study data commonly used as clinical thresholds will provide clinicians with meaningful ways to interpret the results.
Second, the Bayesian posterior probability is fundamentally different from the P-value used for frequentist hypothesis test. For instance, when testing “the inhibitor rate (in our population) is <10%” in our case, the P obtained from the frequentist test tells us the probability of wrongly rejecting the null hypothesis – “the inhibitor rate equals to 10%” in our case. This P-value reflects the type I error. In addition, thus the statistically significance from frequentist approach is built on an arbitrary cutoff for tolerating this type I error, say 0.05.Citation42 In our example, if the “probability” of “the inhibitor rate is ≥10%” is <0.05, we conclude that this hypothesis can be rejected. However, this probability is not in fact a probability directly related to the acceptance of the testing hypothesis, but a level of confidence that the chance of mistakenly rejecting the null hypothesis is low. In fact, when P<0.05, we can reject the null hypothesis, but we are never able to say that the probability of “the inhibitor rate being <10%” is truly 0.95. On the other hand, the Bayesian probability is a quantity of the testing hypothesis, ie, the “degree of truth” of the study hypothesis. The Bayesian can really test the probability that the rate of inhibitor in our sample is <10%. If P=0.95, we are confident that the probability of “the inhibitor rate being <10%” is actually 0.95.
Third point is the different interpretations between the CI in classical approach and CrI in Bayesian approach. Back to our example, the 95% CI is interpreted as “the estimates of the inhibitor rate will fall in between these two boundaries 95% of the time if the data can be repeated infinitely”. It cannot be used to make an assertion about the current test based on a single sample set without the assumption of the infinite repetition. In comparison, the 95% CrI tells us a straightforward story, “given the data and the model, the chance of the true inhibitor rate fall in this interval is 95%”.
Some further considerations are hopefully of value. For Cases 1 and 2, the Bayesian models with noninformative priors yielded results comparable to the classical approach. For third study case, the point estimate of inhibitor rate obtained from the Bayesian random-effects logistic model was lower than that obtained from the classical random-effects logistic model. The reason is that the data used for this example are extremely sparse. In three out of seven pooled studies, there were no inhibitors observed. The classical logistic model directly takes event as outcome and thus fails to generate the estimates when no event is in the data. Therefore, when classical random-effect logistic was used to pool the data from seven individual studies, the three studies without outcomes were ignored, and the inhibitor rate was estimated from the four studies with observed inhibitor. Unlike the classical model, the Bayesian model resamples the data for certain times (eg, 100,000) based on the information provided by the current data and then generates the estimates in accordance before reporting the posterior estimates, which usually are the median of the entire estimates. In our example, when data reported no event, the Bayesian model resampled the data using the probability of event sampled around zero. By doing so, the Bayesian model was able to incorporate those studies reporting no inhibitor into the posterior estimates and thus gave a lower inhibitor rate. On the other hand, for the same example, the 95% CrIs were wider than the 95% CIs. This is because the Bayesian model introduced more random uncertainty through noninformative priors that had very large variance. When the study data are not large enough, random uncertainty will be added in the posterior estimates. In our example, we had seven studies that were not even able to provide saturated information for estimating the between-study variance. Therefore, the model borrowed information from noninformative priors that only added uncertainty to estimate the between-study variance.
The Bayesian approach provides a very useful tool for exploring our Case 3 data, which presents the unexplored patient population with no existing evidence. We modeled the effect of observing six inhibitors in ~200 patients from the unlikely expectation that the inhibitor rate would have been as in Research Of Determinants of INhibitor (RODIN) studyCitation11, to the optimistic expectation that the rate would have not been different from that in PTPs. We also showed how we could model the “strength” of this belief, by “discounting” the previous information. Critics of the Bayesian approach would certainly say that by adding “discounts” you may play with data until you show what you want. We would object that this would be the case if you were only using one set of priors (maybe even discounted). If you instead show the results produced by using a whole range of priors, you explore the relevance of your previous beliefs and assumptions. Along the same lines, we found that Bayesian modeling can be used to simulate the effect by increasing the number of patients in the same centers or by increasing the number of centers. The information found through thes attempts can be easily used on estimating the sample size for the future studies. All of this richness of information is completely unavailable when using the frequentist approach. The reader needs to be aware, at this point, that most of the modeling of the impact of health care interventions on economics of health care systems or quality of life of patient population is generally obtained via Monte Carlo chain simulations which are, in essence, Bayesian probability applications.Citation30,Citation43
Bayesian estimates can be used to inform clinical decisions in patient management in complex clinical settings. The success of integrating all relevant evidence through a Bayesian approach depends on two aspects: 1) how to properly choose the clinically relevant priors, and 2) how to statistically formulate the clinical knowledge. These tasks need the joint force of clinicians and statisticians. Properly implementing the Bayesian results in the clinical decision making depends on the comprehensive understanding of the evidence, in particular, for the findings obtained from the first-time-ever exploration regarding new study settings or populations.
In regard to the purpose of serving as case studies for conducting Bayesian analysis in hematology area to analyze and generate evidence for rare events among rare study populations, we chose to use Bayesian random-effect logistic regression throughout the entire project for three scenarios for simplicity. We are aware that other statistical models such as random-effect Poisson regress may be a better choice for rare event data with zero outcomes. It is worth noting that properly setting up priors can be challenging because it depends on the types of outcomes and Bayesian models.
To come back to the clinical ground, we showed how the Bayesian posterior distribution can be interrogated to get, for example, the posterior probability that the rate of inhibitors in a population like the one we studied (eg, patients with previous history of inhibitors) was above or below a given (clinically meaningful) threshold. This is what, in our opinion, is needed for clinical decisions, and, indirectly, for policy-making decisions like taking into account the 30% of patients with a previous history of developing inhibitors in the proportion of population to be suitable to switch concentrate as a result of a tender process.
Conclusion
The Bayesian estimates of the inhibitor rate of patients undergoing treatment with ADVATE provide a broader understanding for the clinicians, which can be utilized to inform clinical decisions in the management of patients with hemophilia A. Bayesian approach as a robust, transparent, and reproducible analytic method can be efficiently used to answer the complex clinical questions through updating, enhancing, and exploring the evidence by incorporating all the available information. Furthermore, the Bayesian probability can be directly used by clinicians to quantify individual patient’s risk on developing certain conditions.
Author contributions
JC, AI, MM, VR, and LT designed the study and drafted the manuscript. JC conducted the statistical analysis. AI, MM, VR, and JKM provided the clinical expertise. JC, AI, MM, EMP, and LT provided input on statistical concept. All authors contributed toward data analysis, drafting and critically revising the paper and agree to be accountable for all aspects of the work. All authors revised the manuscript for important clinical and statistical contents and approved the final manuscript.
Acknowledgments
The authors would like to acknowledge Jessica Fowler (Baxter Healthcare, Deerfield, Illinois, USA) for editorial services in reviewing the manuscript. This work was supported by a research contract agreement between Baxter Healthcare and St Joseph’s HealthCare Hamilton.
Supplementary materials
Figure S1 Bayesian codes
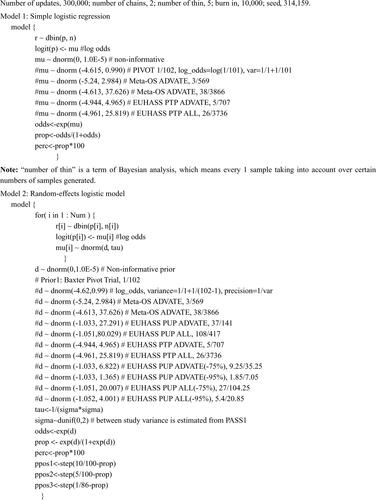
Table S1 Analysis methods and the choice of priors
Table S2 Assessing the impact of sample size change and choice of priors on the Bayesian posterior estimates
References
- SpiegelhaterDJAbramsKRMylesJPBayesian Approaches to Clinical Trials and Health-Care Evaluation1st edChichester, West Sussex, EnglandJohn Wiley & Sons Ltd2004
- LunnDJThomasABestNSpiegelhalterDWinBUGS – a Bayesian modelling framework: concepts, structure, and extensibilityStat Comput200010325337
- RomanovVMarcucciMChengJThabaneLIorioAEvaluation of Safety and Effectiveness of factor VIII treatment in Hemophilia A patients with low titer inhibitors or a personal history of inhibitorThromb Haemost20151141566426017627
Disclosure
JC, MM, EMP, and JKM report no conflicts of interest in this work. AI has worked as a consultant for and held research contracts sponsored by Bayer AG, Biogen Idec, Novo Nordisk A/S, and Pfizer, Inc. VR is an employee of Baxter Healthcare. LT has worked as a consultant for and held research contracts sponsored by many pharmaceutical companies including GlaxoSmithKline plc, AstraZeneca plc, Serono Canada Inc, Hoffman-La Roche Ltd., Pfizer, Inc., Theralase Inc, CanReg Inc, and Merck Frosst – Schering Pharmaceuticals and Proctor and Gamble Pharmaceuticals Canada Inc.
References
- W CollinsPChalmersEHartDDiagnosis and management of acquired coagulation inhibitors: a guideline from UKHCDOBr J Haematol2013162675877323889317
- IorioAEpidemiology of inhibitors in hemophiliaLeeCABerntorpEEHootsWKTextbook of HemophliaOxfordJohn Wiley & Sons, Ltd20145358
- CaramCde SouzaRGde SousaJCThe long-term course of factor VIII inhibitors in patients with congenital haemophilia A without immune tolerance inductionThromb Haemost20111051596521057702
- HayCRMPalmerBChalmersEUnited Kingdom Haemophilia Centre Doctors’ Organisation (UKHCDO)Incidence of factor VIII inhibitors throughout life in severe hemophilia A in the United KingdomBlood2011117236367637021471523
- StieltjesNTorchetMFMisrahiLEpidemiological survey of haemophiliacs with inhibitors in France: orthopaedic status, quality of life and cost – the “Statut Orthopédique des Patients Hémophiles” avec Inhibiteur studyBlood Coagul Fibrinolysis200920141120527720
- GringeriAMonziniMTagarielloGOccurrence of inhibitors in previously untreated or minimally treated patients with haemophilia A after exposure to a plasma-derived solvent-detergent factor VIII concentrateHaemophilia2006122128132
- AstermarkJAltisentCBatorovaAEuropean Haemophilia Therapy Standardisation BoardNon-genetic risk factors and the development of inhibitors in haemophilia: a comprehensive review and consensus reportHaemophilia201016574776620398077
- CoppolaASantoroCTagliaferriAFranchiniMDI MinnoGUnderstanding inhibitor development in haemophilia A: towards clinical prediction and prevention strategiesHaemophilia201016suppl 11319
- IorioAPuccettiPMakrisMClotting factor concentrate switching and inhibitor development in hemophilia ABlood2012120472072722692511
- LeeCALillicrapDAstermarkJInhibitor development in hemophiliacs: the roles of genetic versus environmental factorsSemin Thromb Hemost200632suppl 2101416804830
- GouwSCvan den BergHMFischerKPedNet and Research of Determinants of INhibitor development (RODIN) Study GroupIntensity of factor VIII treatment and inhibitor development in children with severe hemophilia A: the RODIN studyBlood2013121204046405523553768
- GouwSCvan den BergHMThe multifactorial etiology of inhibitor development in hemophilia: genetics and environmentSemin Thromb Hemost200935872373420169509
- GouwSCvan der BomJGMarijke van den BergHTreatment-related risk factors of inhibitor development in previously untreated patients with hemophilia A: the CANAL cohort studyBlood2007109114648465417289808
- PavlovaADelevDLacroix-DesmazesSImpact of polymorphisms of the major histocompatibility complex class II, interleukin-10, tumor necrosis factor-alpha and cytotoxic T-lymphocyte antigen-4 genes on inhibitor development in severe hemophilia AJ Thromb Haemost20097122006201519817985
- AstermarkJLacroix-DesmazesSRedingMTInhibitor developmentHaemophilia200814suppl 33642
- Saint-RemyJ-MReipertBMMonroeDMModels for assessing immunogenicity and efficacy of new therapeutics for the treatment of haemophiliaHaemophilia201218suppl 4434722726082
- MatinoDLillicrapDAstermarkJSwitching clotting factor concentrates: considerations in estimating the risk of immunogenicityHaemophilia201420220020624533949
- KesselheimASMyersJAAvornJCharacteristics of clinical trials to support approval of orphan vs nonorphan drugs for cancerJAMA2011305222320232621642684
- IorioAMarcucciMClinical trials and haemophilia : does the Bayesian approach make the ideal and desirable good friends ?Haemophilia200915490090319473413
- ChowS-CChangMAdaptive design methods in clinical trials – a reviewOrphanet J Rare Dis200831118454853
- HonkanenVESiegelAFSzalaiJPBergerVFeldmanBMSiegelJNA three-stage clinical trial design for rare disordersStat Med200120203009302111590629
- LilfordRJThorntonJGBraunholtzDClinical trials and rare diseases: a way out of a conundrumBMJ19953117020162116258555809
- BeheraMKumarASoaresHPSokolLDjulbegovicBEvidence-based medicine for rare diseases: implications for data interpretation and clinical trial designCancer Control200714216016617387301
- Committee on Strategies for Small-Number-Participant Clinical Research Trials, Board on Health Sciences Policy Committee on Strategies for Small-Number-Participant Clinical Research Trials B on HSPSmall Clinical Trials: Issues and ChallengesWashington, DCNational Academy Press2001
- HarrellFELeeKLMarkDBMultivariable prognostic models: issues in developing models, evaluating assumptions and adequacy, and measuring and reducing errorsStat Med19961543613878668867
- VandenbrouckeJPWhen are observational studies as credible as randomised trials?Lancet200436394221728173115158638
- HornbergerJWroneEWhen to base clinical policies on observational versus randomized trial dataAnn Intern Med19971278 pt 26977039382383
- Von ElmEAltmanDGEggerMSTROBE InitiativeThe strengthening the reporting of observational studies in epidemiology (STROBE) statement: guidelines for reporting observational studiesEpidemiology200718680080418049194
- KalilACSunJBayesian methodology for the design and interpretation of clinical trials in critical care medicineCrit Care Med2014422267227725226118
- SpiegelhaterDJAbramsKRMylesJPBayesian Approaches to Clinical Trials and Health-Care Evaluation1st edChichester, West Sussex, EnglandJohn Wiley & Sons Ltd2004
- LunnDJThomasABestNSpiegelhalterDWinBUGS – a Bayesian modelling framework: concepts, structure, and extensibilityStat Comput200010325337
- OldenburgJGoudemandJValentinoLPostauthorization safety surveillance of ADVATE [antihaemophilic factor (recombinant), plasma/albumin-free method] demonstrates efficacy, safety and low-risk for immunogenicity in routine clinical practiceHaemophilia201016686687720579113
- IorioAMarcucciMChengJPatient data meta-analysis of post-authorization safety surveillance (PASS) studies of haemophilia A patients treated with rAHF-PFMHaemophilia201420677778325039809
- RomanovVMarcucciMChengJThabaneLIorioAEvaluation of safety and effectiveness of factor VIII treatment in hemophilia A patients with low titer inhibitors or a personal history of inhibitorThromb Haemost201511335664
- TarantinoMDCollinsPWHayCRMRAHF-PFM Clinical Study GroupClinical evaluation of an advanced category antihaemophilic factor prepared using a plasma/albumin-free method: pharmacokinetics, efficacy, and safety in previously treated patients with haemophilia AHaemophilia200410542843715357767
- XiMMakrisMMarcucciMSantagostinoEMannucciPMIorioAInhibitor development in previously treated hemophilia A patients: a systematic review, meta-analysis, and meta-regressionJ Thromb Haemost20131191655166223802542
- FischerKLassilaRPeyvandiFEUHASS ParticipantsInhibitor development in haemophilia according to concentrate four-year results from the European haemophilia safety surveillance (EUHASS) projectThromb Haemost2015113596897525567324
- DimicheleDMLacroix-DesmazesSPeyvandiFSrivastavaARosendaalFRDesign of clinical trials for new products in hemophilia: communication from the SSC of the ISTHJ Thromb Haemost201513587687925728341
- AledortLMHarmonization of clinical trial guidelines for assessing the risk of inhibitor development in hemophilia A treatmentJ Thromb Haemost20119342342721143382
- Department of Health and Human Services Food And Drug Administration, Center For Biologics Evaluation And Research, Lister Hill Center National Institutes of HealthWorkshop on Factor Viii InhibitorsNovember 21, 2003Miller Reporting Co., IncWashington DC
- SalpeterSRChengJThabaneLBuckleyNSSalpeterEEBayesian meta-analysis of hormone therapy and mortality in younger postmenopausal womenAm J Med2009122111016.e1022.e19854329
- GreenlandSPooleCLiving with P valuesEpidemiology2013241626823232611
- LindleyDVAn introduction to Bayesian inference and decisionJ Oper Res Soc1974252336337