 ?Mathematical formulae have been encoded as MathML and are displayed in this HTML version using MathJax in order to improve their display. Uncheck the box to turn MathJax off. This feature requires Javascript. Click on a formula to zoom.
Abstract
The feasibility of the noninvasive assessment of blood ‘coagulability’ (the tendency to coagulate) has been tested by using a novel device, the Thrombo-Monitor. It monitors, by using the principles of near infra-red (NIR) dynamic light scattering, the tendency of blood to create clots. The Thrombo-Monitor observes the very initial changes of blood viscosity, which occurs due to the temporarily induced stasis of capillary blood of the finger. One hundred and fifteen patients aged >65 years (matched by age and sex) participated in the study. Patients were initially divided into four groups based on the patient’s medical therapy. The study groups were: warfarin, enoxaparin, aspirin and/or clopidogrel, and a control group. The medications were given according to the patient’s comorbidities (eg, atrial fibrillation [AF], status post pulmonary embolism [S/p PE], status post cerebrovascular accident [S/p CVA]). The Thrombo-Monitor Index (TMI) is a noninvasive index, derived on the basis of laboratory test results of international normalized ratio (INR) and prothrombin time (PT) values. For the group of patients who were treated only with warfarin, TMI was adjusted by using the jackknife statistical approach to create maximum correlation and linearity with INR and PT values that ranged from 1.1 to 5.0. For all warfarin patients (N = 35) the TMI was found to have a good correlation with INR and PT values (R2 = 0.64, P < 0.00001); mean TMI = 1.86 (SD = 0.91); mean INR and PT = 2.3 (SD = 0.91). The calibration curve thus generated was used to calculate the TMI for all other groups: aspirin group, mean TMI = 1.3 (SD = 0.14, N = 23), corresponding approximately to INR and PT values of 1.036; enoxaparin group (N = 24), mean TMI = 1.34 (SD = 0.304), corresponding to mean INR and PT values of 1.07 (SD = 0.3); control group, INR and PT ≥ 1 (N = 32), mean TMI = 1.24 (SD = 0.32). R2 of all control and warfarin patients (N = 67) was 0.55 (P < 0.00001). In summary, the newly introduced TMI index is significantly correlated with INR and PT values.
Introduction
The use of international normalized ratio (INR) and prothrombin time (PT) laboratory tests is widespread in geriatric practice. However, the consistent use of these tests leads to physical inconvenience for the patient, especially in the elderly. Therefore, the development of a noninvasive device for the measurement of INR and PT values, as well as other blood tests, would be groundbreaking for practical daily medicine, particularly with geriatric patients. Apart from yielding immediate results, the noninvasive measurement of blood coagulability parameters will reduce the pain, the inconvenience, and the risk of infection associated with obtaining the patient’s blood sample for analysis.
Near infrared (NIR) spectroscopy has become a popular technology in the biomedical field, in particular in noninvasive pulse oximeters.Citation1 Elfi-Tech’s (Elfi-Tech Ltd, Rehovot, Israel) noninvasive approach is based on a similar technology. The new device, the Thrombo-Monitor (model ELFI-3), uses the principles of NIR dynamic light scattering to measure changes in the blood plasma viscosity caused by the stage of the local blood stasis of capillary blood of the finger. It monitors the tendency of blood to create clots by observing the very initial changes of blood viscosity, due to the temporarily induced stasis. In order to create the blood stasis condition, over-systolic pressure is applied in the vicinity of the measurement site, commonly a finger.Citation2 This procedure resembles a manipulation that is commonly used for blood pressure measurement.
Experimental
Patient selection
One hundred and fifteen consecutive patients ≥65 years of age participated in the study. All were hospitalized in the Geriatric Department for rehabilitation after a stroke, orthopedic surgery (hip fractures, hip, or knee replacements), or deconditioning after severe illness requiring long hospitalization. They included 74 females (age range: 67–98 years) and 48 males (age range: 68–97 years).
Patients were initially divided into four groups based on the current medical treatment of the patient: warfarin, enoxaparin, aspirin/clopidogrel, and a control group, and were matched for age and sex. The reasons for anticoagulation therapy were: atrial fibrillation, pulmonary embolism, and prevention of deep vein thrombosis postorthopedic surgery such as total knee replacement. Anti-aggregation therapy was prescribed for patients suffering from ischemic heart disease (IHD), s/p ischemic stroke, and so on.
Patient statistics
Thirty-five patients received warfarin (2.5–7.5 mg/day); 24 received enoxaparin (60–120 mg/day); 18 received aspirin (75–100 mg/day); four received clopidogrel (75 mg/day); and two received aspirin and clopidogrel; 32 control patients received other drugs, which are not specified as blood thinning. Seven patients who were treated with both anticoagulation and anti-aggregation therapy were excluded from the study: three patients aspirin and enoxaparin; two patients aspirin and warfarin; one patient warfarin and clopidogrel; one patient clopidogrel and enoxaparin.
Noninvasive device
The Thrombo-Monitor is completely noninvasive (see appendix for the physics principles of the device).
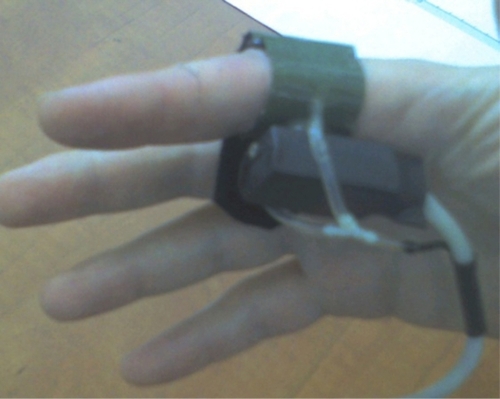
The sensor probe is placed on the fingernail bed. The probe consists of two elements: an illuminating and stimulating NIR light source–coherent light source (low power laser diodes), illuminating the skin, and a photo-detector collecting the scattered light from the object (). A sphygmomanometer cuff is automatically inflated by the device prior to starting the measurement session, in order to change the blood flow status at the measurement location area (2). Over-systolic pressure is applied to the finger for 25 seconds to detect the temporary changes in local plasma viscosity. We used the maximal pressure in the cuff (240 mmHg), since we assumed that this value exceeds the systolic value for all patients. The pressure in the cuff is automatically regulated, and once an operator pushes the start button, the pneumatic inflation of cuffs is automatically initiated and the predefined pressure is reached in about 1 second. This pressure is kept constant throughout the measurement session. The time-dependent character of these changes is driven by the tendency of the blood to coagulate. We performed each measurement six times in order to ensure a stable result, and there was a single operator during the trial. The device does not require any special training.
Figure 1 The noninvasive device.
It should be emphasized that the Thrombo-Monitor Index (TMI) methodology does not measure bulk flow viscosity. By analyzing the speckle pattern of the reflected light, the dynamics of red blood cell (RBC) Brownian movement are determined. The speckle pattern is used to calculate the diffusion coefficient of the moving RBCs. This diffusion coefficient is expressed in terms of the mean free path. Formally speaking, this diffusion coefficient is a function of the particle size (single RBC) and viscosity of the surrounding media (plasma). However, this viscosity is not entirely equivalent to the rheological plasma viscosity. All factors governing the Brownian movement of RBCs contribute to the so-called effective viscosity. Therefore, the optically measured movement pattern of the RBC can be expressed in terms of the effective viscosity. It is very likely that one of the most significant effects on RBC movement in the capillary vessels is an interaction between the RBCs and the vessel walls. Actually, in endothelial cells, flow-induced shear stress stimulates numerous responses. In an extreme case of zero shear stress, stationary RBCs induce a negative charge on mucosal capillary endothelium. In addition, under hypoxia, which is induced during the stasis stage, the endothelial cells are submitted to high levels of stress, resulting in changes of charge. It is clear that electrical forces significantly change the movement of the RBCs in close vicinity to the endothelial surface. Therefore, RBC movement depends on endothelium, fibrinogen, and other factors affecting the hemostasis. All these factors being taken together can be expressed in terms of effective plasma viscosity.
Methods
Blood was drawn from the patients for measurement of INR and PT values, using routine laboratory test procedures (Sysmex Lab). Within 1 hour after this procedure, the same patients were monitored using the noninvasive device. The results of both tests were then compared.
Statistical analysis
The jackknife statistical approach was applied for data analysis.Citation3 This well-known resampling-based method assesses standard error, correlation, and bias for relatively small data sets. Each point of the calculated data set was obtained by leaving out one observation from the original data set. The original data set, excluding one point, was used for the calibration. Based on this calibration, according to laboratory INR and PT values data, the noninvasive equivalent TMI index was calculated for the excluded data point. This procedure was repeated for all data points. By using this approach all data points were included for further statistical analysis. This data set consists of both laboratory data of INR and PT values and corresponding TMI values. These data were further analyzed for standard deviation (SD) and correlation coefficient based on one-factor ANOVA analysis.
Results
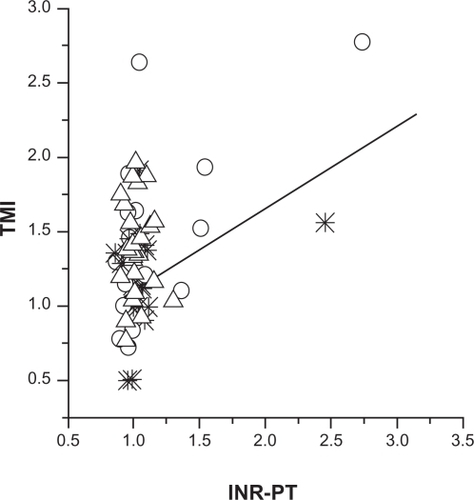
A new noninvasive index, TMI, was used. This index was derived from lab test values of INR and PT for the warfarin-only group of patients. This index was adjusted by using the jackknife’s statistical approachCitation3 to create maximum correlation and linearity with INR and PT values, which ranged from 1.1 to 5.0. The results were plotted as a calibration curve (). For all warfarin patients (N = 35), TMI was found to be strongly correlated with INR and PT values (R2 = 0.64, P < 0.00001); mean TMI = 1.86 (SD = 0.91), and mean INR and PT = 2.3 (SD = 0.91).
Figure 2 Calculated calibration curve for the warfarin-only patient group (N = 35): TMI (Thrombo-Monitor Index) vs international normalized ratio (INR) and prothrombin time (PT) values.
In the second stage of the analysis, the TMI was calculated for all other groups, based on calibration with the warfarin group. For the aspirin patients, mean TMI was 1.3 (SD = 0.14, N = 23), including patients administered aspirin and other drugs (except warfarin). This TMI value corresponds approximately to INR and PT values of 1.036.
For the enoxaparin group (N = 24) mean TMI was 1.34 (SD = 0.304), corresponding to mean INR and PT values of 1.07 (SD = 0.3). For the control patient subgroup with INR and PT values ≥ 1 (N = 32) mean TMI was 1.24 (SD = 0.32). The R2 of all control and warfarin patients (N = 68) was 0.55 (P < 0.00001).
Discussion
The feasibility of the noninvasive assessment of blood coagulability has been tested by using a novel device, the Thrombo-Monitor. The rationale for this technique is as follows. It is assumed that during the stasis session, and for up to 25 seconds, at least two elements of Virchow’s triad are activated in the area located under the pressurizing cuff.Citation4 Thus, the first element of the Virchow’s triad, namely local blood flow disturbance (entire blood flow cessation) is achieved. Second, blood vessel walls are stressed under the applied pressure. This is another of Virchow’s elements. The blood flow and blood pressure regulate endothelial-related vascular reactivity and confine platelet adhesion and aggregation, as well as fibrin formation, to sites of endothelial injury. Thus, the very initial pre-conditions to start the blood clotting process are met. As a direct result of the activation of the clotting process, the steady state equilibrium is disturbed and the plasma viscosity gradually increases. The time-dependence of the above-mentioned biochemical and physical parameters is actually the rate of thrombus formation.
A NIR reflection measurement technique enables detection of these time-dependent changes. The calculated characteristic is the so-called ACF (autocorrelation function). This characteristic is normalized and dependent on the intensity of the light. So any attenuation factors of skin and tissue, depth of penetration, and other local characteristics does not affect the ACF. The ACF depends only on the single scattering characteristics of the red blood cells and their movement pattern. Following analysis of our data by conventional statistical techniques, the correlation obtained with INR and PT values for the group of warfarin patients is excellent and although there is also a remarkable sensitivity to one other anticoagulant and one anti-aggregation drug, namely enoxaparin and aspirin, further investigation needs to be performed to prove its accuracy in these tests. However, the Thrombo-Monitor seems a promising tool to reflect the general status of coagulability.
Acknowledgments
Financial support from Elfi-Tech Ltd is acknowledged.
Disclosure
The authors report no conflicts of interest in this work.
References
- MendelsonIPulse oximetry: theory and applications for noninvasive monitoringClin Chem199238160116071525987
- FineIGlucose correlation with light scattering patternsTuchinVVHandbook of Optical Sensing of Glucose in Biological Fluids and TissuesBoca Raton, FLTaylor and Francis Group, LLC CRC Press2009237275
- EfronABootstrap methods: another look at the jackknifeAnn Stat19797126
- MakinASilvermanSHLipGYHPeripheral vascular disease and Virchow’s triad for thrombogenesisQJM20059519921011937646
Appendix
System description and physics
The TMI system consists of the data acquisition probe, processing system, and display. The probe unit includes the diode laser, the pressurizing assembly, detector, and amplifier. The cuff can be controlled by the processing unit. The measurement process starts when, by means of a pneumatic cuff, over-systolic pressure is applied and blood flow cessation for 20 seconds is set. The over-systolic pressure is applied in the vicinity of the measurement location such that blood perturbation or stasis is induced. This action is facilitated by a pressurizing cuff, which is located at the finger root. This cuff provides local squeezing of the arterioles resulting in blood flow cessations at the area of measurement. After 20–30 seconds, pressure application is temporarily deactivated and free blood flow is allowed. This procedure resembles a manipulation which is commonly used for blood pressure measurement. During the stasis session, lasting up to 30 seconds, at least two elements of Virchow’s triad are activated at the area located under the pressurizing cuff. In terms of Virchow’s triad, local blood flow disturbances entire blood flow cessation is induced achieved. This is the first element of Virchow’s triad. Second, blood vessels walls are stressed under the applied pressure. This is another Virchow’s element. This blood flow and blood pressure regulates endothelial-related vascular reactivity and confines platelet adhesion and aggregation as well as fibrin formation to sites of endothelial injury. The secretion and release of endothelial defenses such as nitric oxide (NO), prostacyclin (PGI2), and tissue plasminogen activator (t-PA) are shear-dependent. In addition, the oxygen supply deficiency leads to the pre-ischemic conditions which may trigger the endothelium to start releasing pro-clotting proteins and to stop releasing some others.
Once blood flow cessation is established, a process of RBC aggregation evolves which induces another change in blood conditions. Therefore, at least two Virchow’s triad elements are activated, namely, blood vessel wall stress and abnormality of blood flow stasis. Thus, the very initial preconditions to start blood hemostasis process are met. As a direct result of activation of a clotting process, the effective plasma viscosity increases.
The physical background
When a coherent source of light having a known frequency is directed at the moving particles, the light is scattered, but at a different frequency. The shift is termed a Doppler shift or broadening, and the concept is the same for light when it interacts with small moving particles. For the purposes of particle measurement, the shift in light frequency is related to the relative movement of the particles causing the shift. The DLS technique is widely used to measure hydrodynamic sizes, polydispersities, and aggregation effects of protein samples. Actually, DLS measures the translational diffusion of particles due to Brownian motion; therefore, the DLS measurement of particle size is strongly influenced by viscosity, both in the calculation and in how the sample behaves.
In this simple case the movement of RBC is expressed in terms of the mean free path 〈Δr2(τ)〉,
This parameter can be expressed by:
where T is the temperature of plasma, KB the Boltzmann constant, DB diffusion coefficient, η is viscosity of the plasma, and d is the size of the particle.
The DLS technique enables evaluation of the mean free path of the moving particle by studying the time-dependent pattern of the scattered light. By knowing the mean free path and by using the viscosity of the surrounding media, particle size can be evaluated.
In the experiments the following quantity is conveniently measured:
where I is the intensity of measured optical signal.
In case of the single scattering from the uncorrelated Brownian particles we have:
A is dependent on the geometry and the mean light intensity and q is defined by:
λ0- is the wavelength in the vacuum, n is the refractive index of the surrounding medium, and θ is the angle between the incident light and the detection axis. In our further estimations, we took n = 1.33, T = 310K, η = 0.015 Psec (for 37°C)
So the diffusion coefficient DB can be determined by using optical measurement.