
Abstract
Purpose
The effects of phosphatidylinositol glycan anchor biosynthesis, class C (PIGC), in the progression of liver cancer are unknown. In this study, we attempted to clarify the clinical significance and mechanism of PIGC in hepatocellular carcinoma (HCC).
Patients and Methods
To explore the expression profiles, DNA methylation, mutation status, clinical relevance, and prognostic value of PIGC in patients with HCC, a series of bioinformatic databases and websites were searched. Moreover, numerous vitro experiments were performed to investigate the mechanism of PIGC in the regulation of cancerous liver cells.
Results
Expression of PIGC mRNA and protein was upregulated in cancerous liver specimens compared with normal liver tissues. High expression of PIGC mRNA was related to higher tumor grade, lymphatic metastasis, advanced TNM stage, and TP53 mutation. High expression of PIGC mRNA predicted more unfavorable overall survival (OS) (HR=1.7, P=0.0028) and disease-free survival (DFS) (HR=1.5, P=0.0067) in patients with liver cancer. The mutation rate of PIGC was 10%, and amplification was the most common mutant type. Expression of PIGC mRNA was negatively regulated by its DNA methylation (r=−0.398, P<0.0001). Moreover, silencing of PIGC in HepG2 cell line inhibited the proliferation and migration and led to cell cycle arrest at G0/G1 stage by reducing cyclinD1, CDK2, CDK4, and CDK6 expression, while overexpression of PIGC in Hcclm3 cell line revealed the opposite effect.
Conclusion
PIGC is related to aggressive clinical features, and overexpression of PIGC signifies worse survival in patients with HCC. PIGC promotes proliferation and migration of cancerous liver cells through the regulation of the cell cycle.
Introduction
Liver cancer is one of the most common malignancies of the digestive system, with an increasing incidence rate over the past few years.Citation1 Liver cancer ranks fourth in terms of cancer-related deaths among all malignant tumors and only second to pancreatic cancer in gastrointestinal cancers.Citation2,Citation3 The mortality of liver cancer in the United States increased from 7.2 deaths per 100,000 to 10.3 deaths per 100,000 during 2000 and 2016.Citation4 Liver cancer poses a considerable health burden around the world, and China accounts for half of the mortality each year.Citation5 The overall prognosis of patients with liver cancer is generally poor, with a 5-year survival rate of 18%.Citation2 Although liver resection is effective, only 5–15% of early-stage liver cancer patients are eligible for surgical treatment.Citation6 Sorafenib, a kinase inhibitor, seems to be promising in treating liver cancer patients in the advanced stage. However, drug resistance of sorafenib is obvious within half a year of initiating the regimen.Citation7 Hepatocellular carcinoma (HCC) is a major type of liver cancer, and elucidating the exact molecular mechanism of HCC might be of substantial significance in the identification of novel therapeutical targets.
Phosphatidylinositol glycan anchor biosynthesis, class C (PIGC), a subunit of glycosylphosphatidylinositol (GPI)-GlcNAc transferase enzyme, is responsible for encoding endoplasmic reticulum related protein that is essential for the biosynthesis of GPI-anchor protein (GPI-AP).Citation7 GPI-AP is reported to be involved in the regulation of immune signals and the activation of tyrosine kinase signaling pathways.Citation9,Citation10 Knocking out of the PIGC gene will lead to the absence of GPI-AP in cells.Citation11 In a recent study, it was revealed that mutations in the PIGC gene resulted in defective biosynthesis of GPI-APs, manifested by mental retardation and seizure disorders.Citation12 Moreover, PIGC single nucleotide polymorphism is associated with a high risk for obesity.Citation13 A recent report demonstrated that the expression of PIGC is upregulated in triple-negative breast cancer, and this gene is regulated by miR-182.Citation8 However, the role of PIGC in HCC is still unknown.
In our study, we investigated the gene expression, DNA methylation, and mutation of PIGC in HCC based on the TCGA-LIHC dataset. Thereafter, we performed the gene enrichment analysis of PIGC-correlated genes to determine the potential pathways of PIGC in HCC. Furthermore, we overexpressed and silenced the PIGC gene in cancerous liver cell lines and investigated the biological functions of PIGC in cancerous liver cell in vitro assays, for the first time.
Patients and Methods
Bioinformatics Analysis
Oncomine databaseCitation14 (https://www.oncomine.org) was mined to determine the expression profiles of PIGC mRNA in human malignant tumors. Gene Expression Profiling Interactive AnalysisCitation15 (GEPIA) webpage (http://gepia.cancer-pku.cn/) was browsed to validate the expression profiles of PIGC mRNA based on the TCGA-LIGC dataset. The UALCAN websiteCitation16 (http://ualcan.path.uab.edu/index.html) was searched to investigate the relationship between the PIGC mRNA level and common characteristics in HCC. cBioPortal database was logged in to explore the mutation of PIGC in HCC, and the co-expressed genes with significant correlation was identified. UCSC XenaCitation17 (https://xenabrowser.net/) was utilized to study the potential correlation between the PIGC expression and DNA methylation. Kaplan–Meier plotterCitation18 (https://kmplot.com/analysis) was adopted to determine whether PIGC expression was a biomarker for survival in patients with HCC. The ClueGO section in the Cytoscape softwareCitation19 was used to analyze the biological pathways of PIGC co-expressed genes in HCC.
Collection of Cancerous Liver Tissues
We collected four pairs of cancerous liver specimens and adjacent normal tissues from the Department of Hepatobiliary Surgery, Renmin Hospital of Wuhan University between January 2021 and February 2021. All the fresh liver tissues were stored at −80°C for the Western blot analysis. This study was implemented under the Declaration of Helsinki. The Institutional Review Board of Renmin Hospital of Wuhan University reviewed and approved our study. All patients involved in this study provided the written informed consent.
Cell Culture and Transfection
Cancerous human liver cell lines (HepG2, Huh7, Hcclm3, and Hep3B) and a normal hepatocyte cell line (LO2) were obtained from China Center for Type Culture Collection (Wuhan, China). The above cell lines were cultured in Dulbecco’s modified Eagle’s medium (DMEM, HyClone, Logan, USA) mixed with 10% fetal bovine serum (FBS, Gibco, USA). The above cell lines were cultured in a humidified incubator filled with 95% air and 5% CO2 at 37 °C. Cell transfection was performed using vectors used in the cell transfection and was provided by the RiboBio company (Guangzhou, China), including overexpression of PIGC, negative control, siRNA of PIGC (Si-PIGC-1:GCCCTAGTCTTCATTACTT; Si-PIGC-2:CCCTGCATGCCTTCATCAT; Si-PIGC-3:GCCCTTCTGCTGATGTCTA) and siRNA negative control (Si-NC:GCCTCTTCGTATGCTA). Mock group was defined as cells transfected with only the transfection reagent.
Western Blot
The total protein of transfected cancerous liver cells was extracted through the extraction buffer for the total protein. After the protein (40 ug per hole) was separated by electrophoresis with 10% SDS-PAGE gel, the gels were then transferred to the PVDF membranes. The membranes were initially blocked with 5% nonfat milk and then incubated with the primary antibodies, including PIGC (novopro, 135229, dilution:1:1000), Cyclin D1 (CST, #55506, dilution:1:1000), CDK2 (CST, #18048, dilution:1:1000), CDK4 (Sanying, Wuhan, 11026-1-AP, dilution:1:1000), and CDK6 (Abcam, ab241554, dilution:1:1000) and finally incubated with specific secondary antibody (HRP-Goat anti Rabbit, ASPEN, AS1107, dilution:1:10000).
CCK-8 Assay
Transfected cancerous liver cells were seeded into 96-well plates at a density of 1×10⁴ cells per well. Cell Counting Kit-8 (Biyuntian biotechnology) reagent of 10 uL was added to each well after 0 and 2 h. Cell viability of the intervened cells was detected using a microplate reader (DiaTek) at 450 nm absorbance.
Transwell Migration Assay
In the upper layer of the transwell plates, 105 cells were seeded, whereas the below chambers contained 600 μL DMEM supplemented with 20% FBS. Cells that migrated to the bottom chambers were fixed with 70% ethanol for 20 min and then stained with crystal violet solution (AS1086, Aspen, Wuhan) for 10 min.
Flow Cytometric Assay
Transfected cells were collected and fixed in 70% ethanol for 30 min. Then, the fixed cells were stained with 50 μg/μL propidium iodide solution for 30 min. Finally, the stained cells were analyzed with the flow cytometry (BD Biosciences).
Statistical Analysis
All statistical analyses were conducted via SPSS23.0 software and GraphPad Prism 7. Categorical and continuous parameters were presented as numbers with percentages and means with standard deviations, respectively. Differences of categorical parameters were checked with the chi-square or Fisher’s exact test. Differences in the continuous parameters between the two groups were tested by student t or nonparametric method. Survival analyses were utilized to reveal the prognostic values of PIGC mRNA and methylation in HCC patients, and log rank test was applied to evaluate the survival difference. The correlation between PIGC mRNA expression and DNA methylation was evaluated by the Pearson correlation test. P value <0.05 was significant in all the statistical analyses.
Results
Expression and Clinical Relevance of PIGC mRNA in HCC
We extracted the Oncomine database to explore the expression profile of PIGC in human malignant cancers. As presented in , PIGC was highly expressed in the liver, brain and CNS cancers, myeloma, esophageal cancer, and cervical cancer, while lowly expressed in leukemia and kidney cancer. We also searched the GEAPIA website which was based on the TCGA database to validate the results from the Oncomine database. As shown in , expression of PIGC mRNA was upregulated in HCC, glioblastoma multiforme, lymphoid neoplasm diffuse large b-cell lymphoma, pancreatic adenocarcinoma, and thymoma. Collectively, PIGC mRNA was upregulated in cancerous liver tissues than the correspondingly normal tissues. As presented in and , data from TCGA-LIHC showed that PIGC mRNA expression is much higher in cancerous liver specimens than that in normal liver tissues (P<0.0001). To verify the different expressions of PIGC in HCC specimens and normal liver tissues, we collected four pairs of HCC specimens and precancerous lesions. As exhibited in Figure S1, levels of PIGC protein in HCC specimens were remarkably higher than its precancerous lesions.
Figure 1 Expression profiles of PIGC mRNA in human malignant tumors. (A) Oncomine database, (B) GEPIA website.
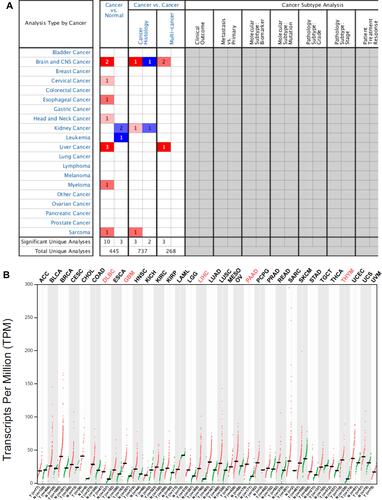
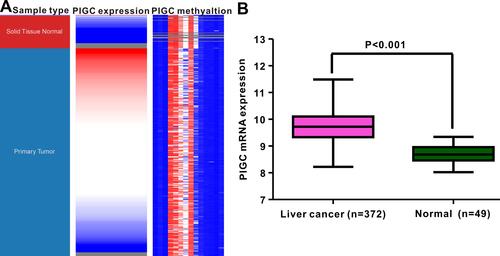
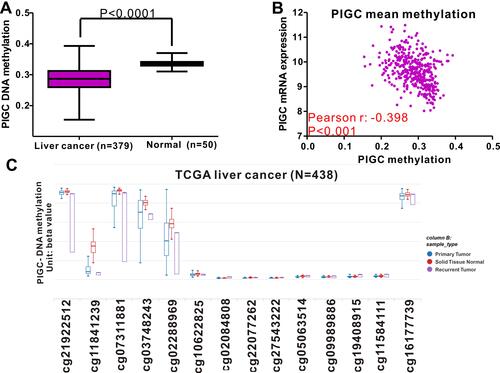
Figure 2 Correlation between PIGC mRNA expression and PIGC DNA methylation. (A) Heat map of PIGC expression and its DNA methylation in cancerous liver specimens and normal liver tissues. (B) PIGC mRNA expression is higher in cancerous liver tissues (N=372) than that in normal liver tissues (N=49).
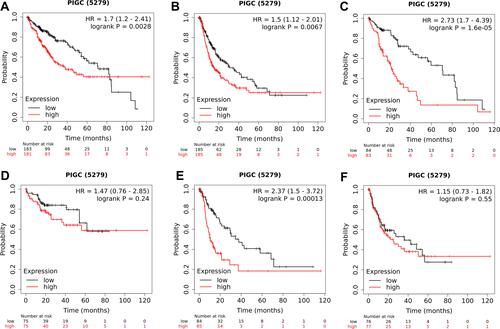
We utilized the UALCAN website to investigate the relationship between PIGC mRNA expression and clinical variables in HCC. As presented in , high levels of PIGC mRNA were associated with female patients (), young age (), high tumor grade (), lymph node metastasis (), advanced TNM stage (), and TP53 mutation (). We browsed the Kaplan–Meier plotter website to determine whether PIGC was a prognostic biomarker for patients with HCC. We selected the mean value of PIGC mRNA to divide HCC patients into the high PIGC group and low PIGC group. As exhibited in , HCC patients in high PIGC group experienced more discouraging overall survival (OS) time than patients in the low PIGC group (37.8 vs 71.0 months, ). HCC patients with high expression of PIGC possessed worse disease-free survival (DFS) compared to those with low PIGC expression (48.43 vs 68.57 months, ).
Figure 3 Association between expression of PIGC mRNA and clinical characteristics in liver cancer from the UALCAN database. (A) Gender, (B) age, (C) tumor grade, (D) N stage, (E) TNM stage, (F) TP53 mutation.
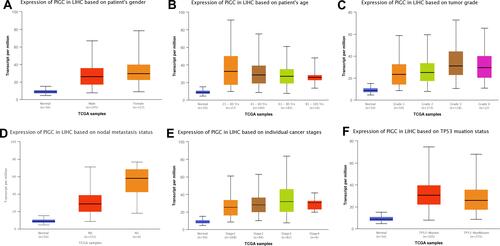
Figure 4 Association between PIGC expression and survival in patients with liver cancer. Overexpression of PIGC correlates with worse overall survival (A) and disease-free survival (B) in patients with liver cancer. PIGC overexpression is correlated with worse overall survival in patients without viral hepatitis (C), but not in patients with viral hepatitis (D). Overexpression of PIGC is correlated with worse disease-free survival in patients without viral hepatitis (E), but not in patients with viral hepatitis (F).
Significance of PIGC DNA Methylation in HCC
DNA methylation acts as the main epigenetic modification that is implicated in the transcriptional regulation of most genes, and abnormal DNA methylation is reported to be involved in the occurrence and progression of HCC.Citation20,Citation21 This study attempted to identify the association between PIGC mRNA expression and DNA methylation in HCC. The methylation levels of PIGC DNA in normal liver tissues were significantly higher than that in cancerous liver tissues (). We found a negative association between PIGC mRNA expression and PIGC DNA methylation (r=−0.398, P<0.0001, ), and this negative association could well explain the differential expressions of PIGC mRNA in cancerous liver specimens and normal tissues. Additionally, the methylation levels of 14 PIGC DNA CpG sites are listed in . Pearson correlation analysis was utilized to assess the relationship between PIGC mRNA expression and methylation levels of 14 PIGC DNA CpG sites (Table S1), and we found that a moderate correlation existed in cg03748243 (r=−0.479, P<0.0001, Figure S2A) and weak correlations in cg02288969 (r=−0.353, P<0.0001, Figure S2B), cg16177739 (r=−0.276, P<0.0001, Figure S2C), and cg11841239 (r=−0.278, P<0.0001, Figure S2D). However, the survival analysis did not find any association between PIGC hypermethylation and OS (HR=1.151, P=0.42, Figure S3A) or DFS (HR=1.235, P=0.281,Figure S3B) in patients with HCC.
Figure 5 Relationship between PIGC methylation and PIGC mRNA expression in liver cancer. (A) Levels of PIGC DNA methylation are lower in cancerous liver tissues (N=379) compared with that in normal liver tissues (N=50). (B) A negative correlation (r=−0.398, P<0.0001) is observed between PIGC DNA methylation and PIGC mRNA expression. (C) Distribution of 14 PIGC DNA CpG sites in liver cancer and normal tissues.
Correlation Between PIGC and Viral Hepatitis
Since most HCC in patients is attributed to viral hepatitis,Citation22,Citation23 so we specifically investigated the relationship between PIGC and viral hepatitis based on the TCGA-LIHC dataset. As clearly shown in Figure S4A, HCC patients with viral hepatitis (N=157) possessed much lower levels of PIGC mRNA (9.592±0.169 vs 9.841±0.054 log2 (norm_count+1), P<0.0001) than those without viral hepatitis (N=196). Then, we also checked the difference of PIGC DNA methylation between HCC patients with viral hepatitis and patients without viral hepatitis. However, no statistical difference was noticed between the two groups (0.403±0.003 vs 0.405±0.003 beta value, P=0.499, Figure S4B). Moreover, we mined the Kaplan–Meier plotter website to investigate the prognostic value of PIGC both in patients with viral hepatitis and individuals without viral hepatitis. The association between the overexpression of PIGC and poor OS or DFS only existed in HCC patients without viral hepatitis ( and ), while it was absent in patients with viral hepatitis ( and ).
PIGC Mutation in HCC
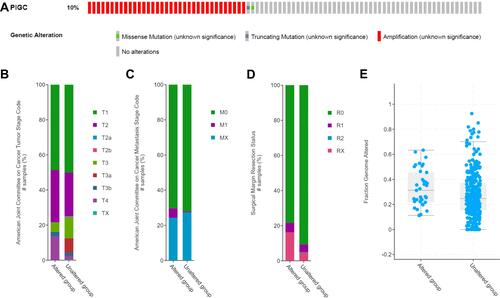
We logged on to the cBioPortal website to explore the mutation rate of PIGC. As shown in , the mutation rate of PIGC is 10% in patients with HCC based on the data from TCGA-LIHC. Moreover, statistical analysis was adopted to determine the possible association between the PIGC gene mutation and clinical features. As shown in , PIGC gene mutation was associated with T stage (), M stage (), surgical margin resection status (), and fraction genome alteration (), while no association was found between the PIGC mutation and AFP level, TNM stage, and Child–Pugh classification grade (Table S2). According to the PIGC mutation status, we divided the HCC patients into the altered group and unaltered group. Kaplan–Meier curves showed that patients in the unaltered group have a relatively longer OS time compared with patients in the altered group (69.51 vs 30.58 months, Figure S5A), while the difference was insignificant via log rank test (P=0.0755). Similarly, HCC patients in the unaltered group exhibited relatively longer DFS time compared with patients in the altered group (23.62 vs 13.14 months, Figure S5B), while the difference was still insignificant via log rank test (P=0.148).
Figure 6 PIGC gene mutation rate and its clinical relevance in liver cancer. (A) The mutation rate of PIGC is 10%. PIGC mutation is significantly correlated with T stage (B), M stage (C), surgical margin resection status (D), and fraction genome alteration (E).
Effect of PIGC Overexpression and Silencing on Proliferation and Migration
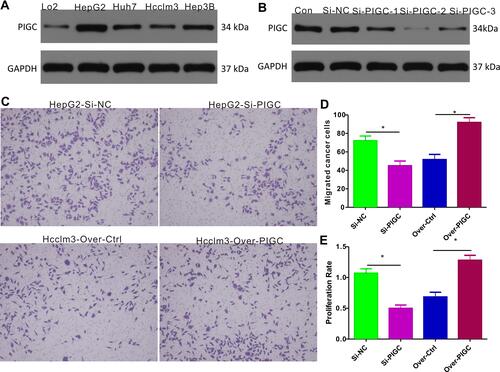
We first determined the PIGC protein expression in cancerous liver cell lines (HepG2, Huh7, Hcclm3, and Hep3B) and normal liver cell line (LO2), and the Western blot results revealed that protein levels of PIGC were significantly higher in liver cancerous cell lines than in the normal liver cell line (). Among the four liver cancerous cell lines, HepG2 expressed the highest PIGC protein, while Hcclm3 expressed the lowest PIGC protein. Hence, we knocked out PIGC in HepG2 cell line and overexpressed PIGC in Hcclm3 cell line. Among the 3 Si-RNAs against PIGC, Si-PIGC-2 exhibited the highest efficiency as revealed by Western blot (), so we chose Si-PIGC-2 for the following experiments. The migration assay ( and ) demonstrated that the migrated cells in PIGC-silenced HepG2 are significantly decreased compared with that in controlled cancer cells (45.0±5.1 vs 72.11 ± 5.11), while the migrated cells are increased in PIGC-overexpressed Hcclm3 (91.89±5.16 vs 51.67±5.59). Moreover, to explore the functional role of PIGC in regulating the proliferation of liver cancerous cells, we determined the proliferation rate in HepG2 and Hcclm3 cancer cells following silencing or overexpression of PIGC. Results of CCK-8 assay revealed that the proliferation rate of PIGC-silenced HepG2 cells is significantly lower than that of the corresponding controlled cells (46.66±5.05% vs 100±6.67%), whereas the overexpression of PIGC in Hcclm3 cells drastically increased cell proliferation (119.6±7.47% vs 63.94±7.17%, ). Taken together, our results provided solid evidence that PIGC takes a crucial role in the proliferation and migration of cancerous liver cells.
Figure 7 Expression of PIGC and effects of PIGC on proliferation and migration in liver cancer cell lines. (A) Expression of PIGC protein is higher in liver cancer cell lines than in normal liver cell line. (B) Si-PIGC-2 is the most efficient Si-RNA revealed by Western blot. (C) PIGC contributes to the migration of cancerous liver cells. (D) Quantitative analysis of migrated cells in four groups. (E) PIGC contributes to the proliferation of cancerous liver cells. *Stands for the P value less than 0.05.
Effect of PIGC Overexpression and Silencing on the Cell Cycle Pathway
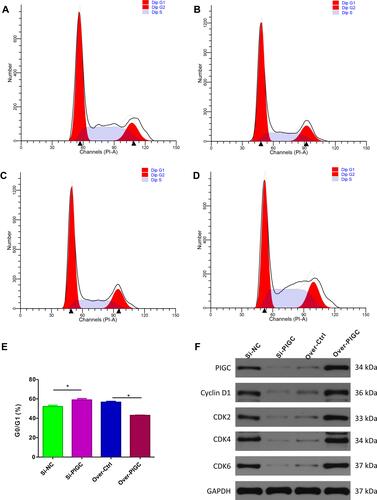
First, we searched the cBioPortal webpage to identify the significant genes which are correlated with the expression of PIGC based on the TCGA-LIHC dataset. Then, we selected the genes (|Pearson r|>0.5, P<0.05) and entered into the ClueGO app using the Cytoscape software for the analysis of KEGG pathways. Among the significant biological pathways (Figure S6), we found that these co-expressed genes were mostly enriched in the cell cycle checkpoint, regulation of mRNA splicing, RNA export form nucleus, regulation of transcription by RNA polymerase III, ATP-dependent chromatin remodeling, protein K48-linked deubiquitination, etc. As the enrichment analysis suggests that PIGC co-expressed genes are mainly enriched in the regulation of the cell cycle checkpoint, we initially applied to validate the bioinformatic conclusion. Flow cytometric analysis showed that G0/GI ratio was increased in PIGC-silenced HepG2 cell line compared to the Si-NC cell line (58.90±1.41% vs 52.12±1.34%, and ). Conversely, G0/GI ratio was dramatically reduced in PIGC-overexpressed Hcclm3 cell line compared to the Hcclm3 cell line transfected with the empty vector (42.94±0.27% vs 56.60±0.84%, and ). Furthermore, we also investigated the expression of CDKs via Western blot in PIGC overexpression and silencing cancerous liver cell lines. When we knocked out the PIGC gene in the HepG2 cell cline, the expressions of Cyclin D1, CDK2, CDK4, and CDK6 were all reduced, whereas the expressions of Cyclin D1, CDK2, CDK4, and CDK6 were significantly upregulated in the PIGC-overexpressed Hcclm3 cell line ( and ).
Figure 8 Effects of PIGC on the cell cycle in liver cancer cell line. (A–D) Flow cytometric analysis showed that G0/GI ratio was increased in PIGC-silenced HepG2 cell line (B) compared to the Si-NC cell line (A). G0/GI ratio was dramatically reduced in PIGC-overexpressed Hcclm3 cell line (D) compared to the Hcclm3 cell line transfected with the empty vector (C). Quantitative analysis of G0/GI ratio in four groups (E). Expression of CDK protein in PIGC-silenced and PIGC-overexpressed cell lines (F). *Stands for the P value less than 0.05.
Discussion
HCC is one of the most prevalent malignant lesions in China, accounting for substantial mortality.Citation5 Therefore, a full understanding of its molecular mechanisms may contribute to discover novel molecular targets for effective treatment. In the current study, we found that expression of PIGC is upregulated in HCC, and both overexpression and PIGC gene mutations correlate to a list of important features. Moreover, the overexpression of PIGC mRNA predicts worse survival (both OS and PFS) among patients with HCC. A series of cellular experiments were conducted to further validate the results generated by comprehensive bioinformatics analysis, and we found that PIGC could promote the proliferation and migration of liver cancerous cells and also inhibit the cell cycle. For the first time, our study elaborated on the prognostic value of PIGC for HCC and preliminarily explored the underlying molecular mechanisms of PIGC in the pathogenesis of HCC.
Whether PIGC is an oncogene or a tumor suppressor is still unknown. This study demonstrated that expression of PIGC was remarkably upregulated in cancerous liver cell lines, which was in line with the results from the TCGA dataset and Oncomine database. Moreover, based on 362 cases of HCC patients from TCGA-LIHC, we found that high expression of PIGC was associated with more malignant features, such as higher tumor grade, lymphatic metastasis, advanced TNM stage, and TP53 mutation. Moreover, we observed that the mutation rate of PIGC was 10% among 370 cases of HCC patients, and amplification was the most common mutation type, which was consistent with the overexpression of PIGC in cancerous liver tissues. Further statistical analysis revealed that PIGC mutation was significantly correlated with T stage and M stage. Hence, we concluded that PIGC might be an oncogene in HCC, and overexpression or mutation signifies aggressive features.
Few studies have investigated molecular biomarkers of HCC,Citation24–Citation26 and the mechanism of HCC seems to be well understood, but the prognosis of HCC patients is still unsatisfactory. Hence, we urgently need to identify novel markers with great prognostic significance, including the molecular targets for HCC. Our study reveals that HCC patients with high expression of PIGC have shorter OS time than those with low expression of PIGC. Moreover, overexpression of PIGC is a risk factor for worse DFS in patients with HCC. As for the PIGC gene mutation, HCC patients without PIGC mutation exhibited more favorable OS than those with PIGC mutation, but the difference between PIGC altered and PIGC unaltered groups was statistically insignificant due to the limited number of patients with PIGC mutation. Similarly, the PIGC altered group exhibited shorter DFS time compared with the PIGC unaltered group. Therefore, PIGC mRNA is a novel biomarker for the prediction of survival among patients with HCC.
Through enrichment analysis, we noticed that PIGC co-expressed genes were involved in several important biological pathways in HCC, and cell cycle checkpoint was the most significant pathway. Cell cycle checkpoint plays a vital role in the induction and metastasis of HCC.Citation27–Citation29 Further experiments were also conducted to verify this bioinformatic finding. Flow cytometric analysis revealed that the ratio of G0/G1 was significantly decreased when we overexpressed PIGC in cancer cells, and the ratio of G0/G1 was obviously increased when we silenced PIGC in cancer cells. Moreover, HCC generally occurs with the abnormal activation of CDKs that regulate the cell cycle.Citation30 Abnormal expression of CDKs usually leads to the APC being out of control and the cell cycle progressing into anaphase when chromosomes have not been correctly separated, accordingly leading to the induction of HCC.Citation31 We detected these common CDKs via Western blot in PIGC silenced and PIGC overexpressed cancer cells. Unexpectedly, silence of PIGC leads to the downregulation of these CDKs, and overexpression of PIGC results in the upregulation of these CDKs. Hence, we infer that PIGC contributes to the proliferation and migration, at least partly by upregulating the cell cycle.
Although this is the first study to illuminate the clinical and prognostic relevance and potential biological function of PIGC in HCC, several questions were not answered in the present study, and further investigation related to PIGC in HCC is still necessary in the future. First, is the expression of PIGC protein different between cancerous liver tissues and normal tissues? Second, can PIGC serve as a diagnostic biomarker for HCC? Third, does the negative association between PIGC expression and DNA methylation still exist in clinical samples? Lastly, will the inhibition of PIGC through a small molecular inhibitor in cancerous liver cells be effective?
Conclusion
Our study found that the expression of PIGC was upregulated in HCC tissues and correlated with aggressive clinical features. PIGC is a novel biomarker for the prediction of survival in patients with HCC and could contribute to the proliferation and migration of liver cancerous cells through the regulation of cell cycle checkpoints. PIGC might serve as a potential oncogene in the pathogenesis and progression of HCC.
Data Sharing Statement
All data generated or analyzed during this study are included in this article and its Supplementary Information Files.
Disclosure
The authors declare that they have no competing interests.
Additional information
Funding
References
- Siegel RL, Miller KD, Jemal A. Cancer statistics, 2019. CA Cancer J Clin. 2019;69:7–34. doi:10.3322/caac.21551
- Villanueva A. Hepatocellular Carcinoma. N Engl J Med. 2019;380:1450–1462. doi:10.1056/NEJMra1713263
- Craig AJ, von Felden J, Garcia-Lezana T, Sarcognato S, Villanueva A. Tumour evolution in hepatocellular carcinoma. Nat Rev Gastroenterol Hepatol. 2020;17:139–152. doi:10.1038/s41575-019-0229-4
- Centers For Disease Control And Prevention, Statistics. NCFH. Trends in liver cancer mortality among adults aged 25 and over in the United States, 2000–2016; 2018.
- Torre LA, Bray F, Siegel RL, Ferlay J, Lortet-Tieulent J, Jemal A. Global cancer statistics, 2012. CA Cancer J Clin. 2015;65:87–108. doi:10.3322/caac.21262
- Anwanwan D, Singh SK, Singh S, Saikam V, Singh R. Challenges in liver cancer and possible treatment approaches. Biochim Biophys Acta Rev Cancer. 2020;1873:188314. doi:10.1016/j.bbcan.2019.188314
- El-Serag HB, Marrero JA, Rudolph L, Reddy KR. Diagnosis and treatment of hepatocellular carcinoma. Gastroenterology. 2008;134:1752–1763. doi:10.1053/j.gastro.2008.02.090
- Barsoum FS, Awad AS, Hussein NH, Eissa RA, El TH. MALAT-1: lncRNA ruling miR-182/PIG-C/mesothelin triad in triple negative breast cancer. Pathol Res Pract. 2020;216:153274. doi:10.1016/j.prp.2020.153274
- Wang LN, Gao MH, Wang B, Cong BB, Zhang SC. A role for GPI-CD59 in promoting T-cell signal transduction via LAT. Oncol Lett. 2018;15:4873–4881. doi:10.3892/ol.2018.7908
- Loertscher R, Lavery P. The role of glycosyl phosphatidyl inositol (GPI)-anchored cell surface proteins in T-cell activation. Transpl Immunol. 2002;9:93–96. doi:10.1016/s0966-3274(02)00013-8
- Leidich SD, Kostova Z, Latek RR, et al. Temperature-sensitive yeast GPI anchoring mutants gpi2 and gpi3 are defective in the synthesis of N-acetylglucosaminyl phosphatidylinositol. Cloning of the GPI2 gene. J Biol Chem. 1995;270:13029–13035. doi:10.1074/jbc.270.22.13029
- Edvardson S, Murakami Y, Nguyen TT, et al. Mutations in the phosphatidylinositol glycan C (PIGC) gene are associated with epilepsy and intellectual disability. J Med Genet. 2017;54:196–201. doi:10.1136/jmedgenet-2016-104202
- Schleinitz D, Kloting N, Lindgren CM, et al. Fat depot-specific mRNA expression of novel loci associated with waist-hip ratio. Int J Obes. 2014;38:120–125. doi:10.1038/ijo.2013.56
- Wang T, Liu H, Pei L, et al. Screening of tumor-associated antigens based on Oncomine database and evaluation of diagnostic value of autoantibodies in lung cancer. Clin Immunol. 2020;210:108262. doi:10.1016/j.clim.2019.108262
- Tang Z, Kang B, Li C, Chen T, Zhang Z. GEPIA2: an enhanced web server for large-scale expression profiling and interactive analysis. Nucleic Acids Res. 2019;47:W556–W560. doi:10.1093/nar/gkz430
- Chandrashekar DS, Bashel B, Balasubramanya S, et al. UALCAN: a portal for facilitating tumor subgroup gene expression and survival analyses. Neoplasia. 2017;19:649–658. doi:10.1016/j.neo.2017.05.002
- Nasif D, Campoy E, Laurito S, et al. Epigenetic regulation of ID4 in breast cancer: tumor suppressor or oncogene? Clin Epigenetics. 2018;10:111. doi:10.1186/s13148-018-0542-8
- Sun CC, Li SJ, Hu W, et al. Comprehensive analysis of the expression and prognosis for E2Fs in human breast cancer. Mol Ther. 2019;27:1153–1165. doi:10.1016/j.ymthe.2019.03.019
- Yu T, Jia W, An Q, Cao X, Xiao G. Bioinformatic analysis of GLI1 and related signaling pathways in chemosensitivity of gastric cancer. Med Sci Monit. 2018;24:1847–1855. doi:10.12659/msm.906176
- Wilting RH, Dannenberg JH. Epigenetic mechanisms in tumorigenesis, tumor cell heterogeneity and drug resistance. Drug Resist Updat. 2012;15:21–38. doi:10.1016/j.drup.2012.01.008
- Long J, Chen P, Lin J, et al. DNA methylation-driven genes for constructing diagnostic, prognostic, and recurrence models for hepatocellular carcinoma. Theranostics. 2019;9:7251–7267. doi:10.7150/thno.31155
- Liu Z, Jiang Y, Yuan H, et al. The trends in incidence of primary liver cancer caused by specific etiologies: results from the Global Burden of Disease Study 2016 and implications for liver cancer prevention. J Hepatol. 2019;70:674–683. doi:10.1016/j.jhep.2018.12.001
- Islami F, Dikshit R, Mallath MK, Jemal A. Primary liver cancer deaths and related years of life lost attributable to hepatitis B and C viruses in India. Cancer Epidemiol. 2016;40:79–86. doi:10.1016/j.canep.2015.11.012
- Fu Y, Xu X, Huang D, et al. Plasma heat shock protein 90alpha as a biomarker for the diagnosis of liver cancer: an official, large-scale, and multicenter Clinical Trial. EBioMedicine. 2017;24:56–63. doi:10.1016/j.ebiom.2017.09.007
- Zhou F, Shang W, Yu X, Tian J. Glypican-3: a promising biomarker for hepatocellular carcinoma diagnosis and treatment. Med Res Rev. 2018;38:741–767. doi:10.1002/med.21455
- Jiao Y, Li Y, Fu Z, et al. OGDHL expression as a prognostic biomarker for liver cancer patients. Dis Markers. 2019;2019:9037131. doi:10.1155/2019/9037131
- Sosnowska M, Kutwin M, Jaworski S, et al. Mechano-signalling, induced by fullerene C60 nanofilms, arrests the cell cycle in the G2/M phase and decreases proliferation of liver cancer cells. Int J Nanomed. 2019;14:6197–6215. doi:10.2147/IJN.S206934
- Xu SQ, Qin Y, Pan DB, et al. Inhibition of WWP2 suppresses proliferation, and induces G1 cell cycle arrest and apoptosis in liver cancer cells. Mol Med Rep. 2016;13:2261–2266. doi:10.3892/mmr.2016.4771
- Zhu Z, Xiao T, Chang X, Hua Y, Gao J. Morusinol exhibits selective and potent antitumor activity against human liver carcinoma by inducing autophagy, G2/M cell cycle arrest, inhibition of cell invasion and migration, and targeting of Ras/MEK/ERK pathway. Med Sci Monit. 2019;25:1864–1870. doi:10.12659/MSM.912992
- Gao X, Wang Y, Li Y, et al. Huganpian, a traditional chinese medicine, inhibits liver cancer growth in vitro and in vivo by inducing autophagy and cell cycle arrest. Biomed Pharmacother. 2019;120:109469. doi:10.1016/j.biopha.2019.109469
- Yan H, Li Z, Shen Q, et al. Aberrant expression of cell cycle and material metabolism related genes contributes to hepatocellular carcinoma occurrence. Pathol Res Pract. 2017;213:316–321. doi:10.1016/j.prp.2017.01.019